 ,1,2, 丁永建,3, 陈艾姣1,2, 张智华1,2, 张世强1,2
Characteristics of warming hiatus of the climate change in Northwest China from 1960 to 2019
LI Zhe,1,2, DING Yongjian,3, CHEN Aijiao1,2, ZHANG Zhihua1,2, ZHANG Shiqiang1,2通讯作者:
收稿日期:2019-09-6修回日期:2020-06-30网络出版日期:2020-09-25
| 基金资助: |
Received:2019-09-6Revised:2020-06-30Online:2020-09-25
| Fund supported: |
作者简介 About authors
李哲(1996-), 女, 陕西汉中人, 硕士生, 主要从事气候变化研究。E-mail:

摘要
关键词:
Abstract
Keywords:
PDF (4240KB)元数据多维度评价相关文章导出EndNote|Ris|Bibtex收藏本文
本文引用格式
李哲, 丁永建, 陈艾姣, 张智华, 张世强. 1960—2019年西北地区气候变化中的Hiatus现象及特征. 地理学报[J], 2020, 75(9): 1845-1859 doi:10.11821/dlxb202009003
LI Zhe, DING Yongjian, CHEN Aijiao, ZHANG Zhihua, ZHANG Shiqiang.
1 引言
全球气候变化已成为制约人类社会发展的重大问题[1]。IPCC第五次评估报告[2]指出1951年以后的全球地表平均温度升高速率达到0.12 ℃/10a,1983—2012年是过去1400年来全球最热的30年,而1998—2012年间平均升温速率只有0.05 ℃/10a,说明1998年(超级厄尔尼诺年)以来全球变暖减缓,出现了变暖停滞(Global Warming Hiatus)现象。变暖停滞对整个气候系统产生了重要影响,如Delworth等[3]指出Hiatus期间热带风异常导致北美西部地区干旱严重;Ueda等[4]发现1999—2013年太平洋降温、印度洋升温对亚洲季风变化影响深刻,印太海温异常导致热带西太平洋降水增多,抑制了东亚中纬度地区降水;Zhao等[5]指出Hiatus导致东亚沿海地区强热带风暴频发;Johnson等[6]发现在Hiatus期间全球陆地夏季极端高温和冬季极端低温出现频率增加;Wang等[7]发现Hiatus期间植被返青期不再提前、枯黄期不再推迟,春秋季物候保持稳定。同时,变暖停滞后的快速升温不容忽视。世界气象组织(WMO)发布的《2018年全球气候状况声明》[8]明确指出,2015—2018年是自有气温记录以来最热的4年。全球变暖导致水循环加强,干旱和湿润地区的极端降水量都呈显著增长,加剧干旱区洪水发生风险[9]。然而Hiatus现象是否在全球各地均存在尚有争议。有****认为最近全球变暖停滞的特征是热带东太平洋出现类似拉尼娜式的降温,而印度洋和热带大西洋升温[4,5];Garfinkel等[10]发现平流层极地涡旋减弱导致欧亚大陆冬季发生Hiatus,并指出即使温室气体浓度增加,这样的停滞还会发生;Winslow等[11]发现全球湖泊水温在Hiatus之前(1985—1998年)显著增加,而在Hiatus期间没有显著变化,证明了Hiatus的存在;赵宗慈等[12]指出1998—2014年的变暖趋缓确实存在,但全球变暖总趋势没有改变;苏京志等[13]认为全球变暖是在冷暖波动中不断升温;Karl等[14]基于更新的全球地表温度数据指出1998—2014年全球升温趋势高于IPCC-AR5的报道,21世纪前15年的升温速率与20世纪后半叶的一样,并没有减缓;Hausfather等[15]在修订海面温度实测值系统偏差的基础上指出1997—2015年的海洋升温速率被低估;Huang等[16]认为在考虑北极快速增暖的情况下全球平均温度并不存在Hiatus现象。另一方面对于变暖停滞的原因也多有争议,一些研究者认为是自然外强迫引起,另一些****认为是气候系统内部变率的作用[17,18,19,20,21,22,23]。就中国地区来看,Li等[24]发现1998—2012年中国年均最高气温下降导致总体平均气温降低,除西南地区外冬季最低温快速下降;王岱等[25]发现2000—2014年中国极端气温出现变暖减缓或变冷;杜勤勤等[26]发现1998—2012年间中国存在同全球变暖停滞类似的增温减缓现象,其中东部季风区为中国最强降温区。
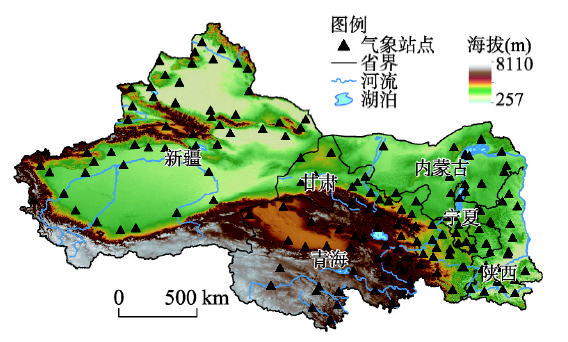
西北地区深居亚欧大陆腹地,包括陕西、甘肃、宁夏、青海、新疆西北5省(自治区)及内蒙古西部(图1),该地区包括青藏高原、蒙新高原和黄土高原交汇地域,生态脆弱、自然环境复杂,是对全球气候变化响应最敏感的区域之一[27]。施雅风等[28,29]提出1987年以来中国天山西部气候由暖干向暖湿转型;陈亚宁等[30]认为自1997年以来西北干旱区温度一直处于高位震荡状态,升温趋势已不十分明显;曲姝霖等[31]发现1996—2015年西北地区极端高温事件出现频次呈弱递减趋势,对全球变暖停滞现象存在响应;Zhang等[32]发现2000年来祁连山疏勒河流域冰川退缩及物质流失加剧;柴中华等[33]发现中国绿洲严寒期缩短。以上研究表明,西北地区是否存在与全球同步的变暖停滞现象尚有争议,对于该停滞是否已经结束,结束后的新的变化特征等问题的研究还不够深入。基于此,本文依据观测资料,对西北地区1960—2019年的气温时空变化特征进行分析,对是否存在Hiatus及其是否已结束进行了探讨。
图1
 新窗口打开|下载原图ZIP|生成PPT
图1中国西北地区范围及气象站点分布
Fig. 1The location of Northwest China and the distribution of meteorological stations
2 数据来源与研究方法
2.1 数据来源
气温数据来自中国气象数据网(Tab. 1
表1
表11960—2019年西北地区气象站点数目变化
Tab. 1
| 年份 | 站点数目(个) | 年份 | 站点数目(个) | 年份 | 站点数目(个) |
|---|---|---|---|---|---|
| 1960年 | 117 | 1966年 | 121 | 1979—1980年 | 165 |
| 1961年 | 118 | 1967年 | 122 | 1981—2017年 | 166 |
| 1962—1964年 | 119 | 1968—1970年 | 123 | 2018—2019年 | 124 |
| 1965年 | 120 | 1971—1978年 | 124 |
新窗口打开|下载CSV
图2
 新窗口打开|下载原图ZIP|生成PPT
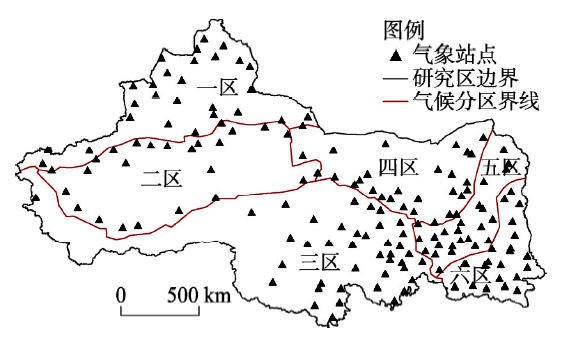
图2中国西北地区气候分区示意图
Fig. 2The climate zones of Northwest China
2.2 研究方法
利用累积距平曲线法、Mann-Kendall突变检验法、滑动t检验法以及Yamamoto检验法进行气温突变分析,通过对比分析来确定较为可靠的突变年份,然后结合线性倾向估计对气温变化进行趋势分析。2.2.1 累积距平曲线 累积距平是一种常用的、由曲线直观判断变化趋势的方法[35]。对于序列
式中:
2.2.2 Mann-Kendall突变检验 Mann-Kendall法是一种非参数统计检验方法,具有人为影响少、定量化程度高的特点[35,36],已被广泛使用。对于具有n个样本量的时间序列x,构造一秩序列:
可见,秩序列Sk是第
式中:UF1 = 0;
按时间序列x逆序
2.2.3 滑动t检验 滑动t检验是考察两组样本平均值的差异是否显著来检验突变[35,36]。对于具有n个样本量的时间序列x,人为设置某一时刻为基准点,基准点前后两段子序列x1和x2的样本分别为n1和n2,两段子序列平均值为
显然
2.2.4 Yamamoto检验 Yamamoto法是从气候信息与气候噪声两方面讨论突变问题,也是用检验两子序列均值的差异是否显著来判别突变[35,36],其原理同滑动
式中:s1和s2分别为序列x1和x2的标准差。若SNRi > 1,则认为在i时刻发生突变;若SNRi > 2,则认为发生强突变。Yamamoto法也存在与滑动t检验相同的缺点,需反复变动子序列长度进行比较[36]。
3 结果分析
3.1 气温突变分析
从气温突变检验分析结果看(表2),西北地区全区年均温在1966年出现了一次突变降低,在1986年、1996年和2012年都发生突变升高,根据滑动t检验和Yamamoto检验结果,1996年的t值波峰及S/N值比1986年和2012年高,说明1996年的突变升温更明显,M-K法检验出来的突变年份2001年超出了α = 0.05的信度线,结合其他方法发现该突变年份不可靠,不是突变点。从各个季节均温突变检测结果看,春季在1974年发生突变降温,在1996年突变升温;夏季气温在1996年出现显著突变上升;秋季在1965年突变降温,在1987年和1997年发生突变升温;冬季气温在1986年和1997年突变升高,1997年升温更显著。对比各分区的年均温突变检测结果,北疆(一区)气温在1988年和1996年发生突变上升;南疆(二区)气温在1996年和2014年突变升高,1996年的突变更显著;青藏高原地区(三区)发生突变升温的年份为1986年和1997年,根据t值波峰及S/N值来看1997年突变更显著;河西走廊及内蒙古西部(四区)在1966年出现突变降温,在1986年、1996年和2012年突变升温;东南部半干旱区(五区)和半湿润区(六区)的气温突变年份一致,都分别在1986年、1996年和2012年发生突变升温,半湿润区在2012年的突变更为显著。Tab. 2
表2
表2西北地区气温突变年份分析
Tab. 2
| 累积距平曲线 | M-K检验 | 滑动t检验 | Yamamoto检验 | ||
|---|---|---|---|---|---|
| 全区 | 年均温 | 1996 | 2001** | 1966*, 1986**, 1996**, 2012* | 1966**, 1986**, 1996**, 2012* |
| 春季 | 1996 | 2004** | 1974*, 1996** | 1974**, 1996** | |
| 夏季 | 1996 | 2000** | 1996** | 1996** | |
| 秋季 | 1997 | 1997** | 1965*, 1987**, 1997** | 1965**, 1987* | |
| 冬季 | 1986, 1997 | 1996** | 1986**, 1997** | 1986*, 1997** | |
| 一区 | 1996 | 1994** | 1988**, 1996** | 1988**, 1996* | |
| 二区 | 1996 | 1997** | 1996**, 2014* | 1996**, 2014* | |
| 三区 | 1997 | 1997** | 1986**, 1997** | 1986**, 1997** | |
| 四区 | 1996 | 1992** | 1966**, 1986**, 1996**, 2012** | 1966**, 1986*, 1996**, 2012** | |
| 五区 | 1996 | 1995** | 1986**, 1996**, 2012* | 1986*, 1996**, 2012** | |
| 六区 | 1996 | 1997** | 1986**, 1996**, 2012** | 1996*, 2012** | |
新窗口打开|下载CSV
总体来看,西北地区年均温在1986年、1996年和2012年突变升高,春、夏季气温在1996年突变升高,秋、冬季气温在1986年左右和1997年突变上升;各分区年均温基本上都在1986年和1996年发生突变升温,青藏高原在1997年突变升温,比其他区晚1年,东部3个分区在2012年再次突变升温。李珍等[37]对新疆气候突变分析发现新疆在1980年代中期进入增温多雨时期;丁一汇等[38]指出青藏高原地区年平均气温分别在20世纪80年代中期和90年代中期突变增暖,90年代中期的突变更显著;贾文雄等[39]发现祁连山区春夏季气温在1997年发生突变,秋冬季在1985年左右发生突变;孟秀敬等[40]指出河西走廊在1986年发生增温突变;高茂盛等[41]发现陕西省平均气温在20世纪90年代中期发生显著突变。本文检测出的气温突变年份与先前的研究基本一致,但由于先前其他****的研究时间序列不够,未能检测出2012年这一显著突变升温年份。
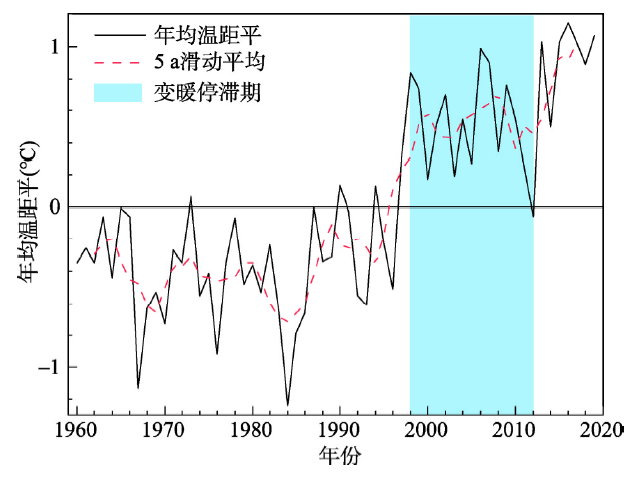
根据突变检验得到的突变年份,结合气温距平变化图(图3),发现西北地区年均气温在1996年显著升温突变后,于1998年开始进入高位震荡,1998—2012年间没有升温趋势,2012年出现气温极低值,之后再次快速升温;秋、冬季平均气温在1997年突变上升于1998年之后趋于平稳状态并在2012年出现极低值;春季平均气温在1996年突变升高后于1997—2011年间保持平稳状态,并在2011年出现极低值;夏季平均气温于1996年突变上升后继续保持升温态势,在1998年和2012年左右没有出现极值。因此为探讨西北地区不同时段气温变化情况,本文将研究时间序列划分为1960—1998年、1998—2012年和2012—2019年,其中春季以1960—1997年、1997—2011年、2011—2019年划分。
图3
 新窗口打开|下载原图ZIP|生成PPT
图31960—2019年西北地区年均气温距平变化
Fig. 3Annual mean air temperature anomalies in Northwest China from 1960 to 2019
3.2 气温年际变化
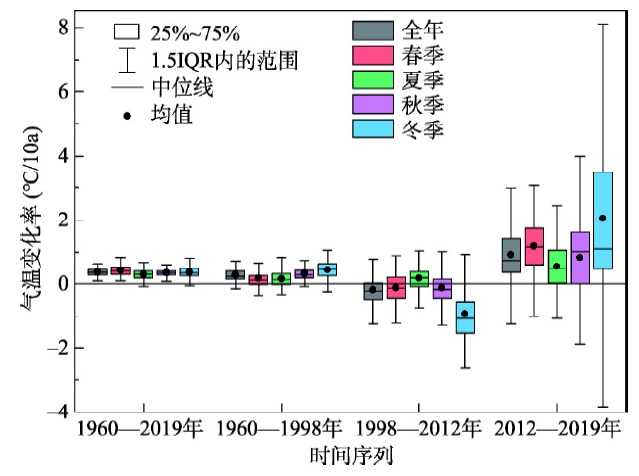
1960—2019年西北地区年均气温整体上呈显著(α = 0.01)上升趋势,增温速率为0.26 ℃/10a,与过去半个多世纪以来中国平均升温趋势(0.23 ℃/10a)[2]基本一致,是全球平均升温速率(0.12 ℃/10a)[2]的2倍。其中1960—1998年呈不显著升温态势(0.08 ℃/10a),1998—2012年间西北地区年均气温表现为降低趋势,变化率为-0.20 ℃/10a,低于IPCC-AR5给出的同期全球平均地表升温速率(0.05 ℃/10a)[2],表明1998—2012年西北地区年均气温出现了与全球陆地一致的变暖停滞(Hiatus)现象,甚至表现出明显降温。2012年以后,西北地区年均气温快速上升,增温幅度高达1.04 ℃/10a。WMO发布的《2018年全球气候状况声明》[8]指出2015—2018年是有记录以来4个最热年份,全球变暖仍在加速。这说明无论在全球尺度还是西北地区均经历变暖停滞后的快速增温,不容忽视。从整个1960—2019年时间序列看,西北地区各季节平均气温都显著(α = 0.01)上升,但不同时段不同季节气温变化特征有所差异(表3、图4)。1960—1998年春、夏季均温变化趋势不明显,气温变化率分别为-0.05 ℃/10a、0.03 ℃/10a,秋、冬季升温幅度明显,分别为0.13 ℃/10a和0.19 ℃/10a。1998—2012年春、秋、冬季平均气温都呈下降趋势,冬季最为明显,降幅达0.93 ℃/10a,相较于1960—1998年冬季的升温速率下降了1.12 ℃/10a,春、秋季气温下降速率分别为0.14 ℃/10a、0.13 ℃/10a;夏季表现为升温趋势,速率为0.16 ℃/10a,该速率相较于1960—1998年夏季气温变化率有所提升。由此可见,在1998—2012年间西北地区尤其是冬季表现出明显降温,夏季仍然升温。其中,春季均温是按1997—2011年计算,表现为降温趋势,可看出春季均温比秋、冬季均温及年均温提前1年开始和结束停滞期。从北半球尺度看,Kosaka等[21]指出21世纪以来北半球冬季出现降温现象,而夏季大部分地区仍保持升温趋势;Trenberth等[42]发现北半球的冬季尤其是欧亚大陆出现最强烈的变暖停滞现象;邢武成等[43]认为夏季气温显著上升带来的消融是天山冰川退缩的主要原因。这表明西北地区季节气温变化趋势与北半球基本一致。2012年后各季节均温都迅速升高,以冬季升温速率最快,增幅达1.96 ℃/10a,春、秋季分别为1.48 ℃/10a、1.00 ℃/10a,夏季升温速率最慢,为0.48 ℃/10a。
Tab. 3
表3
表3不同时间序列西北地区全年和季节均温线性变化率(℃/10a)
Tab. 3
| 时间序列 | 1960—2019年 | 1960—1998年 | 1998—2012年 | 2012—2019年 |
|---|---|---|---|---|
| 年均温 | 0.26** | 0.08 | -0.20 | 1.04 |
| 春季均温 | 0.29** | -0.05 | -0.14 | 1.48 |
| 夏季均温 | 0.24** | 0.03 | 0.16 | 0.48 |
| 秋季均温 | 0.25** | 0.13 | -0.13 | 1.00 |
| 冬季均温 | 0.26** | 0.19 | -0.93 | 1.96 |
新窗口打开|下载CSV
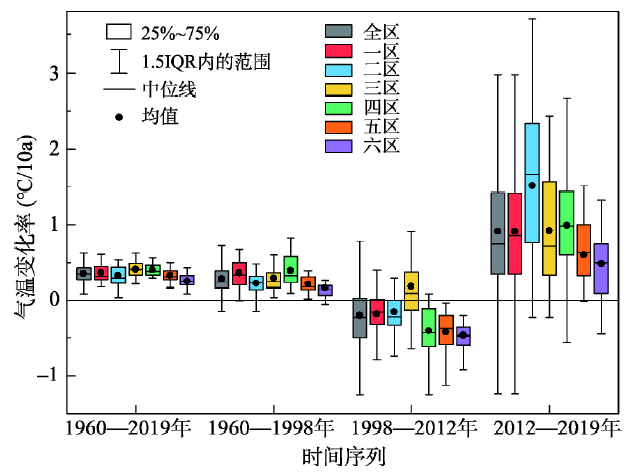
图4
 新窗口打开|下载原图ZIP|生成PPT
图4不同时间序列西北地区各站点全年和季节均温线性变化率
Fig. 4Trend of annual and seasonal average air temperature at each station in Northwest China in different periods
3.3 气温变化空间差异
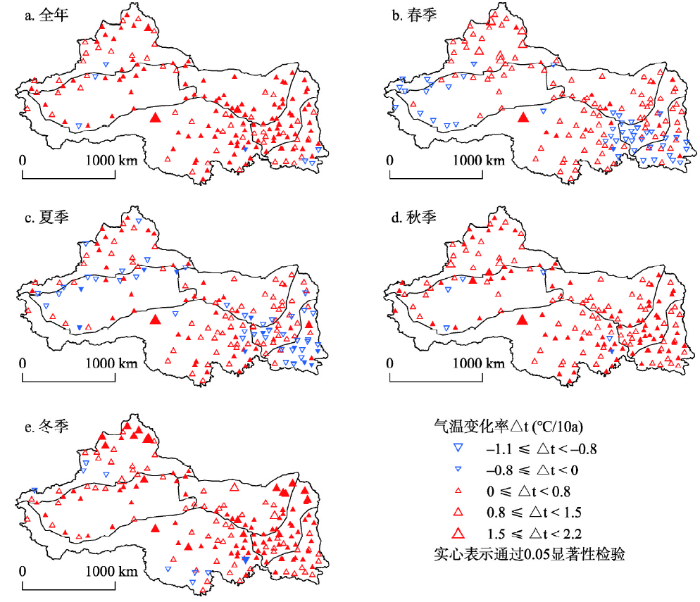
1960—2019年间西北地区各分区年均温都显著(α = 0.01)上升,但在不同时段内不同分区的气温变化特征具有明显的区域差异(表4、图5、图6)。1960—1998年西北地区年均温上升站点占比95.7%(159个),其中显著(α = 0.05)升温的站点占69.1%(110个),河西走廊及内蒙古西部地区升温最快,达到0.32 ℃/10a(α = 0.01)。从不同季节看,冬季升温最明显,94.5%(157个)的站点升温,显著(α = 0.05)升温站点有90个;秋季升温站点占96.3%(160个),但显著(α = 0.05)升温的站点个数(79个)不及冬季;春、夏季升温站点约占71%(118个),夏季显著(α = 0.05)升温站点个数(43个)比春季(14个)多,春、夏季在南疆和东南部半湿润半干旱地区约有48个站点呈降温趋势。Tab. 4
表4
表4不同时间序列西北地区各分区年均温线性变化率(℃/10a)
Tab. 4
| 时间序列 | 1960—2019年 | 1960—1998年 | 1998—2012年 | 2012—2019年 |
|---|---|---|---|---|
| 全区 | 0.26** | 0.08 | -0.20 | 1.04 |
| 一区 | 0.28** | 0.19 | -0.18 | 1.00 |
| 二区 | 0.26** | 0.10 | -0.16 | 1.34 |
| 三区 | 0.35** | 0.19** | 0.18 | 0.63 |
| 四区 | 0.39** | 0.32** | -0.41 | 0.32 |
| 五区 | 0.32** | 0.21** | -0.42 | 0.60 |
| 六区 | 0.23** | 0.10 | -0.47* | 0.63 |
新窗口打开|下载CSV
图5
 新窗口打开|下载原图ZIP|生成PPT
图5不同时间序列西北地区各分区站点年均温线性变化率
Fig. 5Trend of annual average air temperature at stations of each zone in Northwest China in different periods
图6
 新窗口打开|下载原图ZIP|生成PPT
图61960—1998年西北地区全年和各季节平均气温变化率的空间变化趋势
Fig. 6Spatial variation trend of annual and seasonal average air temperature in Northwest China during 1960-1998
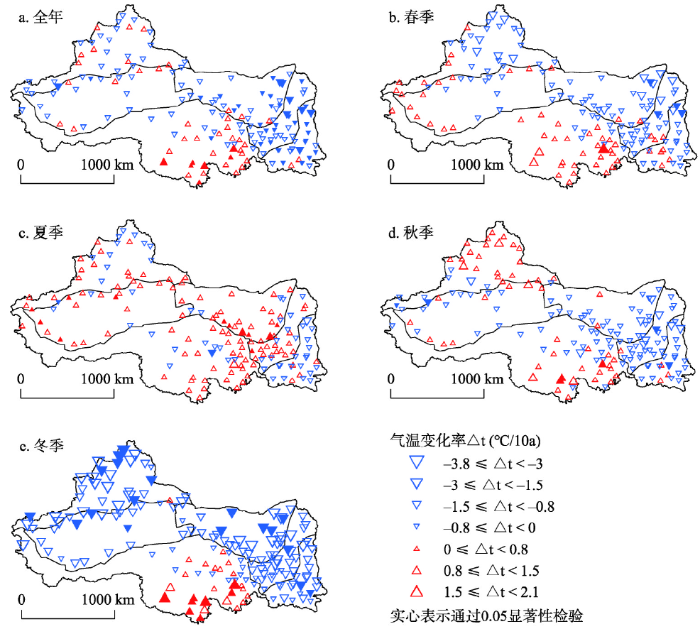
1998—2012年间,除青藏高原年均气温仍保持上升态势外,其余分区年均气温均呈现明显降低趋势(表4、图5、图7)。西北地区有72.8%(121个)的站点年均温呈现下降趋势,其中显著(α = 0.05)降温的站点有39个,主要集中在西北地区东部3个分区(半湿润区、半干旱区、河西走廊及内蒙古西部),其降温速率达到0.41 ℃/10a以上,超出西北地区平均降温速率的2倍,其中东南部半湿润区降温最为显著(α = 0.05),降幅为0.47 ℃/10a;南疆和北疆降温幅度略低于西北地区整体水平,平均降温速率为0.17 ℃/10a。青藏高原在1998—2012年间表现为升温趋势,升温速率为0.18 ℃/10a,其中青海有7个站点显著(α = 0.05)升温。由此可见,1998—2012年间西北地区除青藏高原外均表现出降温现象,东南部降温最显著,青藏高原仍保持升温。这与段安民等[44]指出的在全球变暖趋缓期青藏高原仍迅速增温的结论一致。姚晓军等[45]发现2000—2011年间可可西里地区湖冰冻结时间推迟、消融时间提前,认为气温上升是主要影响因素之一,也间接证明了高原在持续增温。分季节看,西北大部分地区冬季呈现快速降温,降温站点占比84.3%(140个),升温站点仅占15.7%(26个),升温主要集中在青藏高原地区;春、秋季降温站点约占66%(109个),降温区与年均温相似,其中北疆地区春季表现为降温、秋季为升温。夏季西北地区整体上仍表现为升温,升温站点占66.2%(110个),其中显著(α = 0.05)升温有12个站点,降温区主要分布在东南部半湿润区及北疆北部。总体来看,冬季降温对年均温的下降贡献最大,夏季整体升温,青藏高原在各季节均表现为升温。
图7
 新窗口打开|下载原图ZIP|生成PPT
图71998—2012年西北地区全年和各季节平均气温变化率的空间变化趋势
Fig. 7Spatial variation trend of annual and seasonal average air temperature in Northwest China during 1998-2012
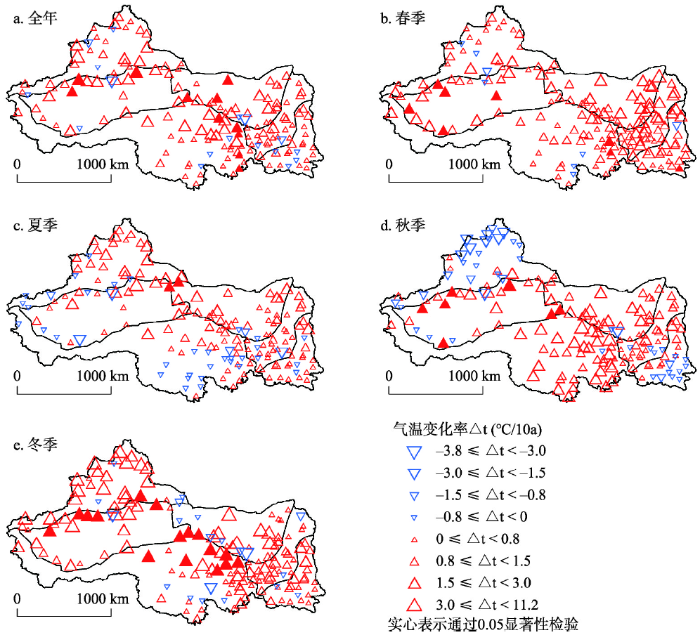
2012—2019年间,西北地区气温再次快速增加,年均温上升站点占89.7%(149个),显著(α = 0.05)升温的站点有11个,降温站点仅有17个(表4、图5、图8)。从空间上看,南疆升温最快,升温速率达1.34 ℃/10a;北疆地区紧随其后,增温速率为1.00 ℃/10a;其次为青藏高原和东南部半湿润区、半干旱区,年均温线性变化率平均达到0.62 ℃/10a;河西走廊及内蒙古西部升温相对较慢,为0.32 ℃/10a。从各季节看,冬季升温最为迅速,有87.9%(146个)的站点气温呈快速上升趋势,其中有16个站点显著(α = 0.05)升温,主要集中在南疆和青藏高原;春季升温站点占95.1%(158个),但升温幅度和显著升温站点个数不及冬季;夏、秋季升温站点约占75%(125个),夏季在青藏高原地区有17个站点降温,秋季在北疆和东南部半湿润区有30个站点降温。
图8
 新窗口打开|下载原图ZIP|生成PPT
图82012—2019年西北地区全年和各季节平均气温的空间变化趋势
Fig. 8Spatial variation trend of annual and seasonal average air temperature in Northwest China during 2012-2019
4 结论与讨论
4.1 结论
(1)西北地区全区年均温在1966年突变降低,1986年、1996年和2012年分别突变升高;春、夏季气温在1996年突变升高,秋、冬季气温在1986年左右和1997年突变上升;各分区年均温基本上都在1986年和1996年发生突变升温,青藏高原在1997年突变升温,比其他区晚1年,东部3个分区在2012年再次突变升温。西北地区平均气温在1996年左右突变升高后基本上在1998—2012年间保持高位震荡,2012年后再次突变上升。(2)1998—2012年间西北地区年均气温变化率为-0.20 ℃/10a,呈现出与全球陆地一致的变暖停滞(Hiatus)现象,甚至表现出降温。分季节看,冬季降温最明显,气温变化率为-0.93 ℃/10a;夏季仍保持升温,升温速率为0.16 ℃/10a;春季均温的变暖停滞时期为1997—2011年,气温变化率为-0.14 ℃/10a,比秋、冬季均温及年均温提前1年开始和结束停滞期。1998—2012年间除青藏高原外的西北地区均表现出降温现象,东南部降温最显著,气温变化率为-0.47 ℃/10a,青藏高原仍保持升温,升温速率为0.18 ℃/10a。
(3)2012年Hiatus结束后到2019年间,西北地区年均温快速升高,气温变化率高达1.04 ℃/10a,升温趋势不容忽视。从不同季节看,冬季升温最快、夏季最慢,分别为1.96 ℃/10a、0.48 ℃/10a;从空间上看,南疆升温最快,升温速率达1.34 ℃/10a,河西走廊及内蒙古西部升温相对较慢,气温变化率为0.32 ℃/10a。
4.2 讨论
在全球温室气体排放量剧增的背景下,仍有区域在1998—2012年出现了明显的变暖停滞现象,其驱动机制引发诸多国内外****进行探索,目前将该机制主要分为2类:① 辐射强迫下降,即太阳活动减弱、火山活动变化及平流层水汽减少。如Kaufmann等[46]认为1998—2008年间太阳活动处于低值期,太阳辐射能量下降部分抵消了温室效应,导致全球变暖停滞;Santer等[19]发现考虑火山爆发影响的气候模型能更好地模拟出1998—2012年间的变暖停滞;Solomon等[47]研究表明在1980—2000年间,平流层水汽增加导致全球地表变暖加速,而在2000年之后,平流层水汽减少约10%,导致2000—2009年地表变暖速率降低25%。② 气候系统内部变率作用,主要是海洋中热量传输变化造成。科学家们[48,49,50]普遍认为温室气体排放量剧增导致的多余的热量是进入了700 m以下的深海之中,而上层海洋热量并未明显增加,导致观测到的全球变暖停滞,Balmaseda等[49]发现热量转移到热带太平洋和印度洋深处,Chen等[50]认为热量增加区主要位于大西洋和南大洋深海。Kosaka等[21]提出全球变暖停滞主要是因为赤道东太平洋变冷,Risbey等[51]认为1997—1998年的强厄尔尼诺导致太平洋年代际震荡(PDO)呈负位相,造成赤道中东太平洋海温降低,England等[52]认为是赤道信风增强导致Hadley环流和Walker环流增强,造成赤道中东太平洋变冷,未能向大气辐射多余热量,使得全球变暖停滞;Chen等[50]指出大西洋经向翻转流(AMOC)增强将热带海水输送到北大西洋深海,导致北大西洋变暖,进而影响大气环流异常和和赤道东太平洋降温。目前,关于变暖停滞的区域和形成机制的讨论多集中在海洋,因为海洋是巨大的热量储存库,而对于陆地上不同地区出现变暖停滞现象的特征和机制研究还较为有限。Garfinkel等[10]指出2000年以来平流层极地涡旋减弱导致欧亚大陆冬季降温;He等[53]发现西伯利亚地区在全球变暖停滞期经历了显著降温,而常绿针叶林仍继续扩张;Xie等[54]发现在1998—2013年中国年均气温出现明显的变冷趋势,以冷季降温为主,这与大气环流变化有关;杜勤勤等[26]指出1998—2012年中国东部季风区和西北干旱区对全球变暖停滞的响应显著,而青藏高寒区的响应并不显著;Huang等[16]表明1998—2012年间北极地区气温加剧变暖,不存在变暖停滞。本文的研究结论证实了1998—2012年间中国西北地区存在变暖停滞现象,冬季降温最明显,夏季没有降温,青藏高原在此期间仍保持升温。已有研究[10, 55-58]表明西伯利亚高压、极地涡旋、北极海冰、北半球环状模/北极涛动、太平洋年代际振荡、以及厄尔尼诺—南方涛动对中国冬季气温有很强的年代际影响,可以解释变暖停滞期冬季的剧烈降温及停滞结束后的快速升温现象。然而西北地区乃至全国的变暖停滞与太阳活动、火山爆发、平流层水汽增减等外部强迫影响因子之间有何关联?作为气候变化“放大器”的青藏高原在此期间却没有表现出同步变暖停滞现象,同样寒冷的北极地区也仍在加剧升温,两者之间有什么关系?其背后的形成机制又是什么?这些问题都需要在今后的研究中进一步探讨。
尽管1998—2012年间的变暖停滞确实存在,但许多科学家认为全球变暖仍在继续[1, 12, 59-60],极端高温事件也频繁发生[6]。对于未来是否还会出现类似的Hiatus现象,Nicola等[61]指出如果21世纪末地球上化石燃料排放量保持在RCP 8.5情景下的高排放水平,那么像21世纪初10年左右的变暖停滞现象将不会再发生。本文发现在2012年变暖停滞结束后的西北地区再次出现加速升温,且变暖趋势不容忽视。因此,在今后的研究中一方面要加强对未来气候变化的预估,积极应对极端气候灾害的挑战,同时更需要国际间合作共同控制温室气体排放,实现人类可持续发展。
参考文献 原文顺序
文献年度倒序
文中引用次数倒序
被引期刊影响因子
DOI:10.11820/dlkxjz.2014.07.002URL [本文引用: 2]

2 since 1750. It led to more than half of global warming since the 1950s (with 95 % confidence). It is predicted using Coupled Model Intercomparison Project Phase 5 (CMIP5) and Representative Concentration Pathways (RCPs) that the global mean surface temperature will continue to rise for the end of this century, the frequency of extreme events such as heat waves and heavy precipitation will increase, and precipitation will present a trend of "the dry becomes drier, the wet becomes wetter". The temperature of the upper ocean will increase by 0.6 to 2.0℃ compared to the period of 1986 to 2005, heat will penetrate from the surface to the deep ocean which will affect ocean circulation, and sea level will rise by 0.26 to 0.82 m in 2100. Cryosphere will continue to warm. To control global warming, humans need to reduce the greenhouse gas emissions. If the increase in temperature is higher than 2℃ than before industrialization, the mean annual economic losses worldwide will reach 0.2% to 2.0% of income, and cause large-scale irreversible effects, including death, disease, food insecurity, inland flooding and water logging, and rural drinking water and irrigation difficulties that affect human security. If taking prompt actions, however, it is still possible to limit the increase in temperature within 2℃. To curb the gradually out-of-control global warming and achieve the goal of sustainable development of the human society, global efforts to reduce emissions are needed.]]>
[本文引用: 2]
[本文引用: 4]
DOI:10.1175/JCLI-D-14-00616.1URL [本文引用: 1]
URLPMID:26564801 [本文引用: 2]
Recent research indicates that the cooling trend in the tropical Pacific Ocean over the past 15 years underlies the contemporaneous hiatus in global mean temperature increase. During the hiatus, the tropical Pacific Ocean displays a La Nina-like cooling pattern while sea surface temperature (SST) in the Indian Ocean has continued to increase. This SST pattern differs from the well-known La Nina-induced basin-wide cooling across the Indian Ocean on the interannual timescale. Here, based on model experiments, we show that the SST pattern during the hiatus explains pronounced regional anomalies of rainfall in the Asian monsoon region and thermodynamic effects due to specific humidity change are secondary. Specifically, Indo-Pacific SST anomalies cause convection to intensify over the tropical western Pacific, which in turn suppresses rainfall in mid-latitude East Asia through atmospheric teleconnection. Overall, the tropical Pacific SST effect opposes and is greater than the Indian Ocean SST effect.
URLPMID:29662073 [本文引用: 2]
The recent global warming hiatus (GWH) was characterized by a La Nina-like cooling in the tropical Eastern Pacific accompanied with the Indian Ocean and the tropical Atlantic Ocean warming. Here we show that the recent GWH contributed significantly to the increased occurrence of intense tropical cyclones in the coastal regions along East Asia since 1998. The GWH associated sea surface temperature anomalies triggered a pair of anomalous cyclonic and anticyclonic circulations and equatorial easterly anomalies over the Northwest Pacific, which favored TC genesis and intensification over the western Northwest Pacific but suppressed TC genesis and intensification over the southeastern Northwest Pacific due to increased vertical wind shear and anticyclonic circulation anomalies. Results from atmospheric general circulation model experiments demonstrate that the Pacific La Nina-like cooling dominated the Indian Ocean and the tropical Atlantic Ocean warming in contributing to the observed GWH-related anomalous atmospheric circulation over the Northwest Pacific.
URLPMID:29712890 [本文引用: 2]
The recent levelling of global mean temperatures after the late 1990s, the so-called global warming hiatus or slowdown, ignited a surge of scientific interest into natural global mean surface temperature variability, observed temperature biases, and climate communication, but many questions remain about how these findings relate to variations in more societally relevant temperature extremes. Here we show that both summertime warm and wintertime cold extreme occurrences increased over land during the so-called hiatus period, and that these increases occurred for distinct reasons. The increase in cold extremes is associated with an atmospheric circulation pattern resembling the warm Arctic-cold continents pattern, whereas the increase in warm extremes is tied to a pattern of sea surface temperatures resembling the Atlantic Multidecadal Oscillation. These findings indicate that large-scale factors responsible for the most societally relevant temperature variations over continents are distinct from those of global mean surface temperature.
URLPMID:31160586 [本文引用: 1]
Phenology plays a fundamental role in regulating photosynthesis, evapotranspiration, and surface energy fluxes and is sensitive to climate change. The global mean surface air temperature data indicate a global warming hiatus between 1998 and 2012, while its impacts on global phenology remains unclear. Here we use long-term satellite and FLUXNET records to examine phenology trends in the northern hemisphere before and during the warming hiatus. Our results based on the satellite record show that the phenology change rate slowed down during the warming hiatus. The analysis of the long-term FLUXNET measurements, mainly within the warming hiatus, shows that there were no widespread advancing (or delaying) trends in spring (or autumn) phenology. The lack of widespread phenology trends partly led to the lack of widespread trends in spring and autumn carbon fluxes. Our findings have significant implications for understanding the responses of phenology to climate change and the climate-carbon feedbacks.
[本文引用: 2]
DOI:10.1038/nclimate3160URL [本文引用: 1]
DOI:10.1002/2016GL072035URLPMID:28356606 [本文引用: 3]
The recent hiatus in global-mean surface temperature warming was characterized by a Eurasian winter cooling trend, and the cause(s) for this cooling is unclear. Here we show that the observed hiatus in Eurasian warming was associated with a recent trend toward weakened stratospheric polar vortices. Specifically, by calculating the change in Eurasian surface air temperature associated with a given vortex weakening, we demonstrate that the recent trend toward weakened polar vortices reduced the anticipated Eurasian warming due to increasing greenhouse gas concentrations. Those model integrations whose stratospheric vortex evolution most closely matches that in reanalysis data also simulate a hiatus. While it is unclear whether the recent weakening of the midwinter stratospheric polar vortex was forced, a properly configured model can simulate substantial deviations of the polar vortex on decadal timescales and hence such hiatus events, implying that similar hiatus events may recur even as greenhouse gas concentrations rise.
[本文引用: 1]
[本文引用: 2]
[本文引用: 2]
DOI:10.3878/j.issn.1006-9895.1512.15242URL [本文引用: 1]
The slowdown in the global mean surface temperature (GMST) warming over the past decade or so,referred to as the global warming "hiatus",has attracted wide attention and also cast public doubt on global warming.Great efforts have been made to verify the global warming hiatus,as well as its causes and influences.This paper reviews and summarizes results of recent researches on the global warming hiatus.It is generally accepted that the GMST warming tendency is slowing down recently.So far,proposed reasons to explain the hiatus include:the prolonged solar minimum,the increase in anthropogenic and natural aerosol emissions,and changes in ocean heat storage/re-distribution.Particularly,the increased ocean heat storage below 700 m has been identified during the global warming hiatus.Most of the models participating the Coupled Model Intercomparison Project Phase 5 failed to capture the global warming hiatus and therefore overestimated the observed trend in GMST.One general consensus is that natural climate variability instead of the external forcing caused the recent global warming hiatus.It is argued that the global warming hiatus would likely stop within several years or several decades,depending on the transition of the Pacific Decadal Oscillation.If the radiative forcing of the greenhouse gases continues to intensify,an apparent increase in GMST would be expected in future.We suggest that future research related to the global warming hiatus should focus on:(1) more accurate estimation of the GMST and the ocean heat content;(2) better understanding of the transition of decadal and multi-decadal (Pacific and Atlantic) oscillations;(3) uptake of energy stored in deep oceans and its impact on regional climate.
[本文引用: 1]
DOI:10.1126/science.aaa5632URLPMID:26044301 [本文引用: 1]
Much study has been devoted to the possible causes of an apparent decrease in the upward trend of global surface temperatures since 1998, a phenomenon that has been dubbed the global warming
URLPMID:28070556 [本文引用: 1]
Sea surface temperature (SST) records are subject to potential biases due to changing instrumentation and measurement practices. Significant differences exist between commonly used composite SST reconstructions from the National Oceanic and Atmospheric Administration's Extended Reconstruction Sea Surface Temperature (ERSST), the Hadley Centre SST data set (HadSST3), and the Japanese Meteorological Agency's Centennial Observation-Based Estimates of SSTs (COBE-SST) from 2003 to the present. The update from ERSST version 3b to version 4 resulted in an increase in the operational SST trend estimate during the last 19 years from 0.07 degrees to 0.12 degrees C per decade, indicating a higher rate of warming in recent years. We show that ERSST version 4 trends generally agree with largely independent, near-global, and instrumentally homogeneous SST measurements from floating buoys, Argo floats, and radiometer-based satellite measurements that have been developed and deployed during the past two decades. We find a large cooling bias in ERSST version 3b and smaller but significant cooling biases in HadSST3 and COBE-SST from 2003 to the present, with respect to most series examined. These results suggest that reported rates of SST warming in recent years have been underestimated in these three data sets.
DOI:10.1038/s41558-017-0009-5URL [本文引用: 2]
DOI:10.1038/505276aURLPMID:24429612 [本文引用: 1]
DOI:10.1126/science.aac9225URLPMID:26273042 [本文引用: 1]
DOI:10.1038/NGEO2098URL [本文引用: 2]
Despite continued growth in atmospheric levels of greenhouse gases, global mean surface and tropospheric temperatures have shown slower warming since 1998 than previously(1-5). Possible explanations for the slow-down include internal climate variability(3,4,6,7), external cooling influences(1,2,4,8-11) and observational errors(12,13). Several recent modelling studies have examined the contribution of early twenty-first-century volcanic eruptions(1,2,4,8) to the muted surface warming. Here we present a detailed analysis of the impact of recent volcanic forcing on tropospheric temperature, based on observations as well as climate model simulations. We identify statistically significant correlations between observations of stratospheric aerosol optical depth and satellite-based estimates of both tropospheric temperature and short-wave fluxes at the top of the atmosphere. We show that climate model simulations without the effects of early twenty-first-century volcanic eruptions overestimate the tropospheric warming observed since 1998. In two simulations with more realistic volcanic influences following the 1991 Pinatubo eruption, differences between simulated and observed tropospheric temperature trends over the period 1998 to 2012 are up to 15% smaller, with large uncertainties in the magnitude of the effect. To reduce these uncertainties, better observations of eruption-specific properties of volcanic aerosols are needed, as well as improved representation of these eruption-specific properties in climate model simulations.
DOI:10.1175/JCLI-D-12-00548.1URL [本文引用: 1]
Globally averaged surface air temperatures in some decades show rapid increases (accelerated warming decades), and in other decades there is no warming trend (hiatus decades). A previous study showed that the net energy imbalance at the top of the atmosphere of about 1 W m(-2) is associated with greater increases of deep ocean heat content below 750 m during the hiatus decades, while there is little globally averaged surface temperature increase or warming in the upper ocean layers. Here the authors examine processes involved with accelerated warming decades and address the relative roles of external forcing from increasing greenhouse gases and internally generated decadal climate variability associated with interdecadal Pacific oscillation (IPO). Model results from the Community Climate System Model, version 4 (CCSM4), show that accelerated warming decades are characterized by rapid warming of globally averaged surface air temperature, greater increases of heat content in the upper ocean layers, and less heat content increase in the deep ocean, opposite to the hiatus decades. In addition to contributions from processes potentially linked to Antarctic Bottom Water (AABW) formation and the Atlantic meridional overturning circulation (AMOC), the positive phase of the IPO, adding to the response to external forcing, is usually associated with accelerated warming decades. Conversely, hiatus decades typically occur with the negative phase of the IPO, when warming from the external forcing is overwhelmed by internally generated cooling in the tropical Pacific. Internally generated hiatus periods of up to 15 years with zero global warming trend are present in the future climate simulations. This suggests that there is a chance that the current observed hiatus could extend for several more years.
DOI:10.1038/nature12534URL [本文引用: 3]
Despite the continued increase in atmospheric greenhouse gas concentrations, the annual-mean global temperature has not risen in the twenty-first century(1,2), challenging the prevailing view that anthropogenic forcing causes climate warming. Various mechanisms have been proposed for this hiatus in global warming(3-6), but their relative importance has not been quantified, hampering observational estimates of climate sensitivity. Here we show that accounting for recent cooling in the eastern equatorial Pacific reconciles climate simulations and observations. We present a novel method of uncovering mechanisms for global temperature change by prescribing, in addition to radiative forcing, the observed history of sea surface temperature over the central to eastern tropical Pacific in a climate model. Although the surface temperature prescription is limited to only 8.2% of the global surface, our model reproduces the annual-mean global temperature remarkably well with correlation coefficient r = 0.97 for 1970-2012 (which includes the current hiatus and a period of accelerated global warming). Moreover, our simulation captures major seasonal and regional characteristics of the hiatus, including the intensified Walker circulation, the winter cooling in northwestern North America and the prolonged drought in the southern USA. Our results show that the current hiatus is part of natural climate variability, tied specifically to a La-Nina-like decadal cooling. Although similar decadal hiatus events may occur in the future, the multi-decadal warming trend is very likely to continue with greenhouse gas increase.
DOI:10.1038/NCLIMATE2355URL [本文引用: 1]
Reasons for the apparent pause in the rise of global-mean surface air temperature (SAT) after the turn of the century has been a mystery, undermining confidence in climate projections(1-3). Recent climate model simulations indicate this warming hiatus originated from eastern equatorial Pacific cooling4 associated with strengthening of trade winds5. Using a climate model that overrides tropical wind stress anomalies with observations for 19582012, we show that decadal-mean anomalies of global SAT referenced to the period 19611990 are changed by 0.11, 0.13 and -0.11 degrees C in the 1980s, 1990s and 2000s, respectively, without variation in human-induced radiative forcing. They account for about 47%, 38% and 27% of the respective temperature change. The dominant wind stress variability consistent with this warming/cooling represents the deceleration/acceleration of the Pacific trade winds, which can be robustly reproduced by atmospheric model simulations forced by observed sea surface temperature excluding anthropogenic warming components. Results indicate that inherent decadal climate variability contributes considerably to the observed global-mean SAT time series, but that its influence on decadal-mean SAT has gradually decreased relative to the rising anthropogenic warming signal.
URLPMID:26884089 [本文引用: 1]
Superimposed on a pronounced warming trend, the Indian Ocean (IO) sea surface temperatures (SSTs) also show considerable decadal variations that can cause regional climate oscillations around the IO. However, the mechanisms of the IO decadal variability remain unclear. Here we perform numerical experiments using a state-of-the-art, fully coupled climate model in which the external forcings with or without the observed SSTs in the tropical eastern Pacific Ocean (TEP) are applied for 1871-2012. Both the observed timing and magnitude of the IO decadal variations are well reproduced in those experiments with the TEP SSTs prescribed to observations. Although the external forcings account for most of the warming trend, the decadal variability in IO SSTs is dominated by internal variability that is induced by the TEP SSTs, especially the Inter-decadal Pacific Oscillation (IPO). The IPO weakens (enhances) the warming of the external forcings by about 50% over the IO during IPO's cold (warm) phase, which contributes about 10% to the recent global warming hiatus since 1999. The decadal variability in IO SSTs is modulated by the IPO-induced atmospheric adjustment through changing surface heat fluxes, sea surface height and thermocline depth.
[本文引用: 1]
[本文引用: 1]
[本文引用: 1]
[本文引用: 2]
[本文引用: 2]
[本文引用: 1]
[本文引用: 1]
[本文引用: 1]
[本文引用: 1]
[本文引用: 1]
[本文引用: 1]
[本文引用: 1]
[本文引用: 1]
[本文引用: 1]
[本文引用: 1]
[本文引用: 1]
[本文引用: 1]
[本文引用: 1]
[本文引用: 1]
[本文引用: 1]
[本文引用: 4]
[本文引用: 4]
[本文引用: 5]
[本文引用: 5]
[本文引用: 1]
[本文引用: 1]
[本文引用: 1]
[本文引用: 1]
[本文引用: 1]
[本文引用: 1]
[本文引用: 1]
[本文引用: 1]
[本文引用: 1]
[本文引用: 1]
[本文引用: 1]
[本文引用: 1]
[本文引用: 1]
[本文引用: 1]
[本文引用: 1]
DOI:10.11821/dlxb201507008URL [本文引用: 1]
Based on the boundary data of lakes, some moderate-high resolution remote sensing datasets including MODIS and Landsat TM/ETM+ images and the meteorological data, the spatial-temporal variations of lake ice in the Hoh Xil region during the period 2000-2011 are analyzed by using RS and GIS technology. And the factors affecting the lake ice phenology are also discussed. Some conclusions can be drawn as follows. (1) The freeze-up start (FUS) and freeze-up end (FUE) of lake ice appears in late October - early November, and mid-November - early December, respectively. The duration of lake ice freeze-up is about half a month. The time of break-up start (BUS) and break-up end (BUE) of lake ice is relatively dispersed, and appears in late April - early June, and early May - early June, respectively. The ice duration (ID) and the complete ice duration (CID) of lakes are 196 days and 181 days, respectively. (2) The phenology of lake ice in the Hoh Xil region changed dramatically in the last 10 years. Specifically, the FUS and FUE time of lake ice showed an increasingly delaying trend. In contrast, the BUS and BUE time of lake ice presented an advance. This led to the reduction of the ID and CID of lake ice. The average rates of ID and CID were -2.21 d/a and -1.91 d/a, respectively. (3) The variations of phenology and evolution of lake ice are the results of local and climatic factors. The temperature, lake area, salinity and shape of the shoreline are the main factors affecting the phenology of lake ice. (4) The spatial process of lake ice freeze-up is contrary to its break-up process. The type of lake ice extending from one side of lakeshore to the opposite side is dominant in the Hoh Xil region.
[本文引用: 1]
[本文引用: 1]
DOI:10.1126/science.1182488URLPMID:20110466 [本文引用: 1]
Stratospheric water vapor concentrations decreased by about 10% after the year 2000. Here we show that this acted to slow the rate of increase in global surface temperature over 2000-2009 by about 25% compared to that which would have occurred due only to carbon dioxide and other greenhouse gases. More limited data suggest that stratospheric water vapor probably increased between 1980 and 2000, which would have enhanced the decadal rate of surface warming during the 1990s by about 30% as compared to estimates neglecting this change. These findings show that stratospheric water vapor is an important driver of decadal global surface climate change.
DOI:10.1038/nclimate1229URL [本文引用: 1]
[本文引用: 2]
DOI:10.1126/science.1254937URLPMID:25146282 [本文引用: 3]
A vacillating global heat sink at intermediate ocean depths is associated with different climate regimes of surface warming under anthropogenic forcing: The latter part of the 20th century saw rapid global warming as more heat stayed near the surface. In the 21st century, surface warming slowed as more heat moved into deeper oceans. In situ and reanalyzed data are used to trace the pathways of ocean heat uptake. In addition to the shallow La Nina-like patterns in the Pacific that were the previous focus, we found that the slowdown is mainly caused by heat transported to deeper layers in the Atlantic and the Southern oceans, initiated by a recurrent salinity anomaly in the subpolar North Atlantic. Cooling periods associated with the latter deeper heat-sequestration mechanism historically lasted 20 to 35 years.
[本文引用: 1]
[本文引用: 1]
[本文引用: 1]
[本文引用: 1]
[本文引用: 1]
[本文引用: 1]
[本文引用: 1]
[本文引用: 1]
[本文引用: 1]
[本文引用: 1]
[本文引用: 1]
[本文引用: 1]
