 , 徐成东
, 徐成东Geodetector: Principle and prospective
WANGJinfeng, XUChengdong收稿日期:2016-10-15
修回日期:2011-01-5
网络出版日期:2017-01-20
版权声明:2017《地理学报》编辑部本文是开放获取期刊文献,在以下情况下可以自由使用:学术研究、学术交流、科研教学等,但不允许用于商业目的.
基金资助:
作者简介:
-->
展开
摘要
关键词:
Abstract
Keywords:
-->0
PDF (5534KB)元数据多维度评价相关文章收藏文章
本文引用格式导出EndNoteRisBibtex收藏本文-->
1 引言
空间统计学于20世纪60年代兴起,其理论基础为空间自相关,突破了经典统计学的独立同分布假设前提[1]。基于空间自相关,一系列方法工具被研制出来,主要包括空间自相关检验Moran's I[2]、半变异函数[3]、Ripley K[4];热点探测Gi[5]、LISA[6]、SatScan[7];空间插值方法Kriging[3]、贝叶斯最大熵BME[8];空间回归SAR/MAR/CAR[9-11]、GWR[12]、空间贝叶斯层次模型BHM[13]等。这些方法工具大大促进了人们对于具有空间自相关性数据的分析和利用。随着定位及观测技术的发展和普及,无论是更精细或者更大范围的研究,还是空间大数据,空间分层异质性(spatial stratified heterogeneity)问题凸显。空间分层异质性,简称空间分异性或区异性,是指层内方差小于层间方差的地理现象,例如地理分区、气候带、土地利用图、地貌图、生物区系、区际经济差异、城乡差异以及主体功能区等 等[14-19],是空间数据的另一大特性。“层(strata)”是统计学概念,大体对应地理上的类(classes)或子区域(sub regions)。
虽然已有上百种分类算法K-means、SOM等可用于分类或分区,但是针对空间分异性的统计学方法尚十分有限。目前,主要方法包括空间分异性测度和因子分析的地理探测器q统计[20-21];在不同样本条件下的区域总量估算、空间插值和空间抽样的系列统计量:当有分层样本时的MSN[22-23]、当样本有偏时的Bshade[24-26]、当只有单样本点时的SPA模型[27]、小样本多单元报告以及多边形图层之间的互相转换的Sandwich模型[28]。
地理探测器是探测空间分异性,以及揭示其背后驱动力的一组统计学方法。其核心思想是基于这样的假设:如果某个自变量对某个因变量有重要影响,那么自变量和因变量的空间分布应该具有相似性[29-30]。地理分异既可以用分类算法来表达,例如环境遥感分类;也可以根据经验确定,例如胡焕庸线。地理探测器擅长分析类型量,而对于顺序量、比值量或间隔量,只要进行适当的离散化[31],也可以利用地理探测器对其进行统计分析。因此,地理探测器既可以探测数值型数据,也可以探测定性数据,这正是地理探测器的一大优势。地理探测器的另一个独特优势是探测两因子交互作用于因变量。交互作用一般的识别方法是在回归模型中增加两因子的乘积项,检验其统计显著性。然而,两因子交互作用不一定就是相乘关系。地理探测器通过分别计算和比较各单因子q值及两因子叠加后的q值,可以判断两因子是否存在交互作用,以及交互作用的强弱、方向、线性还是非线性等。两因子叠加既包括相乘关系,也包括其他关系,只要有关系,就能检验出来。
本文主要阐述了地理探测器的基本原理,并介绍地理探测器软件;通过对比分析地理探测器在自然科学、社会科学、环境科学和人类健康方面的几个典型应用案例,讨论了地理探测器的适用条件和优势,提出了可能遇到问题的对策。
2 地理探测器原理
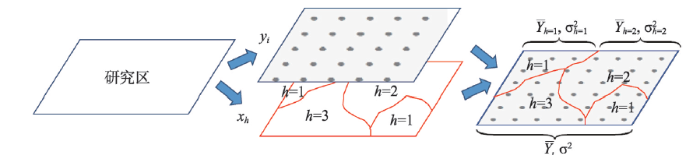
空间分异性是地理现象的基本特点之一。地理探测器是探测和利用空间分异性的工具。地理探测器包括4个探测器。分异及因子探测:探测Y的空间分异性;以及探测某因子X多大程度上解释了属性Y的空间分异(图1)。用q值度量[29],表达式为:
式中:h = 1, …, L为变量Y或因子X的分层(Strata),即分类或分区;Nh和N分别为层h和全区的单元数;
 显示原图|下载原图ZIP|生成PPT
图1地理探测器原理
-->Fig. 1The principle of geographical detector
-->
q值的一个简单变换满足非中心F
式中:λ为非中心参数;
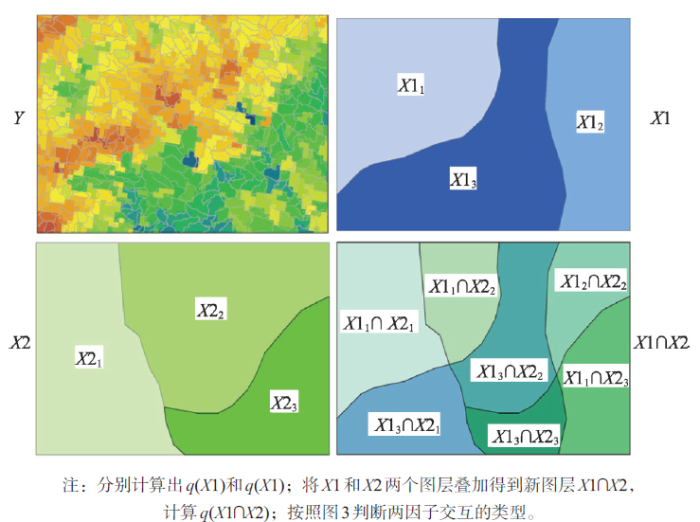
交互作用探测:识别不同风险因子Xs之间的交互作用,即评估因子X1和X2共同作用时是否会增加或减弱对因变量Y的解释力,或这些因子对Y的影响是相互独立的。评估的方法是首先分别计算两种因子X1和X2对Y的q值:q(X1)和q(X2),并且计算它们交互(叠加变量X1和X2两个图层相切所形成的新的多边形分布,图2)时的q值:
风险区探测:用于判断两个子区域间的属性均值是否有显著的差别,用t统计量来检验:
式中:
零假设H0:
 显示原图|下载原图ZIP|生成PPT
图2交互作用探测
-->Fig. 2Detection of interaction
-->
 显示原图|下载原图ZIP|生成PPT
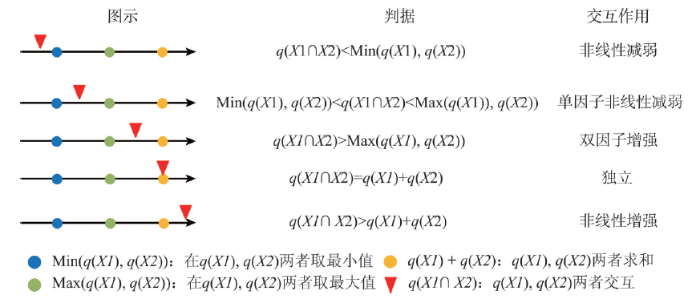
图3两个自变量对因变量交互作用的类型
-->Fig. 3Types of interaction between two covariates
-->
生态探测:用于比较两因子X1和X2对属性Y的空间分布的影响是否有显著的差异,以F统计量来衡量:
式中:NX1及NX2分别表示两个因子X1和X2的样本量;SSWX1和SSWX2分别表示由X1和X2形成的分层的层内方差之和;L1和L2分别表示变量X1和X2分层数目。其中零假设H0:SSWX1=SSWX2。如果在α的显著性水平上拒绝H0,这表明两因子X1和X2对属性Y的空间分布的影响存在着显著的差异。
3 地理探测器软件
GeoDetector是根据上述原理,用Excel编制的地理探测器软件,可从以下网址免费下载:http://www.geodetector.org/。地理探测器使用步骤包括:
(1)数据的收集与整理:这些数据包括因变量Y和自变量数据X。自变量应为类型量;如果自变量为数值量,则需要进行离散化处理。离散可以基于专家知识,也可以直接等分或使用分类算法如K-means等。
(2)将样本(Y, X)读入地理探测器软件,然后运行软件,结果主要包括4个部分:比较俩区域因变量均值是否有显著差异;自变量X对因变量的解释力;不同自变量对因变量的影响是否有显著的差异,以及这些自变量对因变量影响的交互作用。
地理探测器探测两变量Y和X的关系时,对于面数据(多边形数据)和点数据,有不同的处理方式。
对于面数据,两变量Y和X的空间粒度经常是不同的。例如,因变量Y为疾病数据,一般以行政单元记录;环境自变量或其代理变量X的空间格局往往是循自然或经济社会因素而形成的,如不同水文流域、地形分区、城乡分区等。因此,为了在空间上匹配这两个变量,首先将Y均匀空间离散化,再将其与X分布叠加,从而提取每个离散点上的因变量和自变量值(Y, X)。格点密度可以根据研究的目标而提前指定。如果格点密度大,计算结果的精度会较高,但是计算量也会较大。因此在实际操作时须要考虑精度与效率的平衡。GeoDetector的输入数据如表1所示,其中每条记录都是一个格点,各列分别存储因变量Y和自变量X。
Tab. 1
表1
表1GeoDetector数据输入格式
Tab. 1Input table for the GeoDetector
| Y | X1 | X2 | … | Xm | |
|---|---|---|---|---|---|
| 格点1 | y1 | x11 | x12 | … | x1m |
| 格点2 | y2 | x21 | x22 | … | x2m |
| … | … | … | … | … | … |
| 格点n | yn | xn1 | xn2 | … | xnm |
新窗口打开
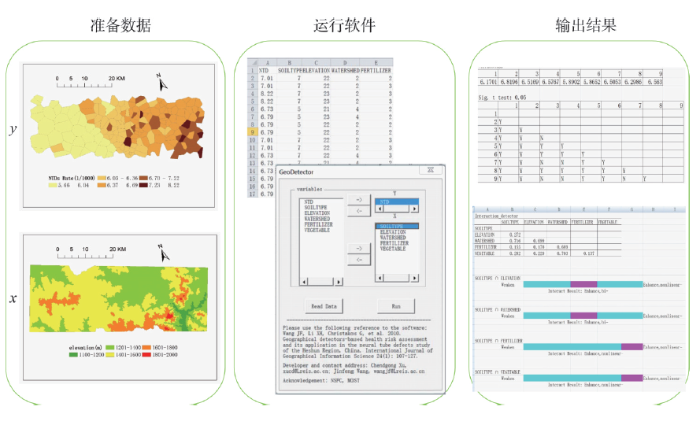
对于点数据:如果观测数据是通过随机抽样或系统抽样而得到,并且样本量足够大,可以代表总体,则可以直接利用此数据在地理探测器软件中进行计算。如果样本有偏,不能代表总体,则需要用一些纠偏的方法对数据进一步的处理之后再在地理探测器软件中进行计算。图4示意了地理探测器软件的数据准备、软件界面和输出。
 显示原图|下载原图ZIP|生成PPT
图4地理探测器软件用户界面
-->Fig. 4Users interface of the GeoDetector
-->
4 应用案例
首先,结合新生儿神经管畸形空间变异的环境因子识别详尽演示GeoDetector的使用步骤;随后,分别介绍了地理探测器在自然科学(美国地表切割因子分析)、社会科学(中国城市化驱动力识别)和环境污染(土壤抗生素空间差异的控制因子分析)等不同领域的典型应用;最后,对地理探测器的应用案例进行分析比较,并归纳总结。4.1 新生儿神经管畸形空间变异的环境因子识别[20 ]
GeoDetector对某县1998-2006年的神经管畸形出生缺陷(NTDs)的发生(Y)进行了环境风险因子分析。环境风险因子或其代理变量(X)包括:高程、土壤类型、流域分区以及蔬菜产量和化肥使用量等社会经济变量[20](图5)。图6显示了本研究中所用的网格点,格点间距为1 km,共1145个,用于将Y(数值量)和X(类型量)匹配起来。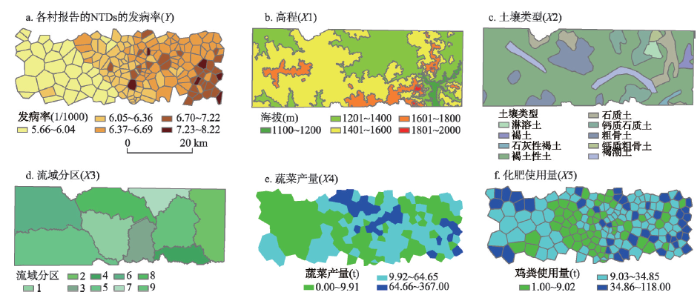 显示原图|下载原图ZIP|生成PPT
图5某县新生儿神经管畸形的环境因子分析的数据[
-->Fig. 5The prevalence of neural tube defects and its covariates or proxies
-->
 显示原图|下载原图ZIP|生成PPT
图6某县新生儿神经管畸形的环境因子分析中用到的网格点[
-->Fig. 6Grid points to match neural tube defects and its covariates
-->
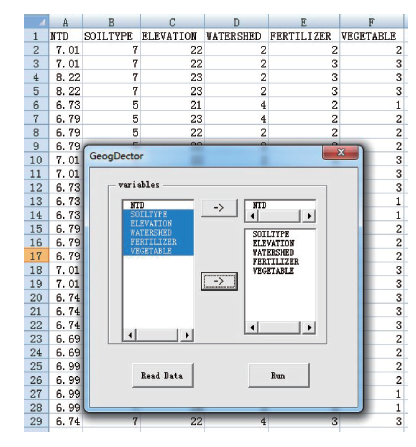 显示原图|下载原图ZIP|生成PPT
图7数据输入的格式及运行界面
-->Fig. 7Table of the input data and the users' interface of GeoDetector software
-->
显示原图|下载原图ZIP|生成PPT图8风险区探测、风险因子探测、生态探测以及交互探测的结果
-->Fig. 8Risk area detector (a), Risk factor detector (b), Ecological detector (c) and Interaction detector (d)
-->
输入数据以及软件运行输出结果如图7所示。图8显示了风险因子探测的结果。图8a显示了对于单个风险因子(高程等级)而言的风险区探测的结果,其中图8a的表格第一行的数字“21”、“22”、“23”等是此环境因子各分区的编号,为类型量;第二行是在每个类型区内的NTDs的平均发病率,为数值量。接下来的第6~10行是各类型分区的NTDs发病率之间是否存在统计差异的判断,采用显著性水平为0.05的t检验,“Y”表示存在显著性差异,“N”表示不存在显著性差异。图8b展示的是所有风险因子q值的计算结果,结果表明水文流域变量(X3)具有最高的q值,说明这些变量中河流是决定NTDs空间格局的最主要的环境因子。图8c是生态探测的输出,结果显示就对NTD空间分布的作用而言,水文流域与其他变量存在着显著差异。图8d是交互探测的结果,其中第3~5行是两两变量交互作用后的q值,结果表明,任何两种变量对NTDs空间分布的交互作用都要大于第一种变量的独自作用。
4.2 美国陆表切割度空间变异的主导因素探测[34 ]
地表切割度控制了水土流失、土地利用和生态功能,是历史和现实多因子作用的综合结果。美国的地表切割密度及其格局呈现出空间分层异质性(spatial stratified heterogeneity)。Luo等[34]将地理探测器分别运用于美国8大地形区探测其形成的主导因子。发现最大q值所对应的因子随着不同特征和地质历史的地形区而变化。例如,岩性主导了山区地形,地形曲率(curvature)控制了平原区地形,冰期控制中央低地(图9)。地理探测器提供了反演地表过程因子的客观构架。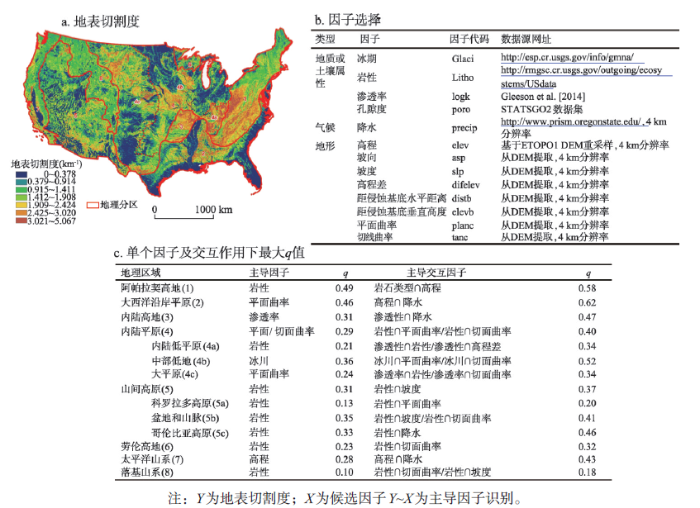 显示原图|下载原图ZIP|生成PPT
图9美国地表切割度及其控制因子探测[
-->Fig. 9Land dissection in US and the detection of its controlling factors
-->
4.3 中国县域城市化空间变异的驱动力[35 ]
城市化是中国过去和未来各20年最大的社会经济空间运动。认识县域城镇化的形成机制为确立县域城镇化的发展战略,因地制宜地引导城镇化的地域模式提供参考依据。收集全国各县城市化率数据(图10a)以及候选解释变量数据(图10b),将地理探测器分别运用于106国道样带、北方边境样带、东部沿海样带、长江沿岸样带和陇海兰新铁路沿线样带,发现城市化驱动力在不同样带不同(图10c)。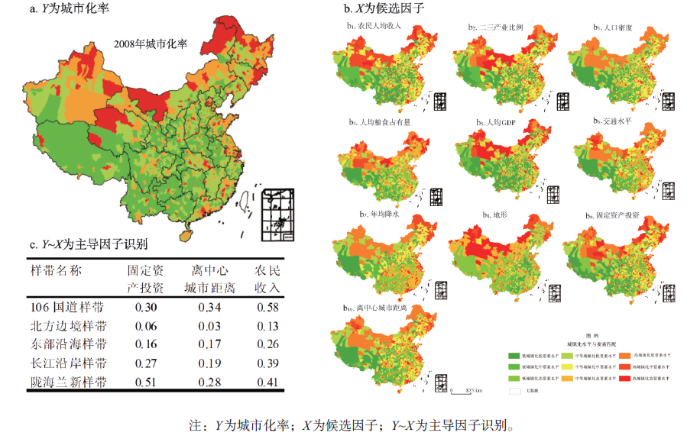 显示原图|下载原图ZIP|生成PPT
图10中国城市化率及其驱动因子探测[
-->Fig. 10Urbanization rate in China and the detection of its driving forces
-->
4.4 土壤抗生素残留空间变异的因子分析[36 ]
土壤和蔬菜里的抗生素残留通过食物链传递影响人类健康。山东省寿光县是中国最大的有机蔬菜种植基地,施用鸡粪;而鸡的饲料和饮水含有抗生素。研究区是寿光县的一个乡,面积约160 km2。寻找FQs类抗生素(Y)与候选影响因子(X)(包括蔬菜种植模式、肥料类型和数量、种植年限、大棚面积、地形起伏)之间的关系(图11)。地理探测器q值如下:蔬菜种植模式(0.28)>使用鸡粪肥料数量(0.20)>高程(0.18)>种植年限(0.09)>鸡粪类型(0.060)>大棚面积(0.02)。可见,蔬菜种植模式是FQs抗生素空间分异的最重要的控制因素,例如,“黄瓜—黄瓜”模式(先种黄瓜,收获后再种黄瓜)对于FQs空间分异的决定力,是“辣椒—西瓜”模式(先种辣椒,收获后接着种西瓜)的3倍;排在第二位的鸡粪肥料使用量对FQs污染也有相当的影响。基于以上发现,政策建议是,为了达到既减少FQs土壤污染,又不对当地蔬菜生产产生过多影响的目的,一个有效而又可行的方案是调节种植模式和鸡粪使用模式(<6 kg/m2 每年;干鸡粪多于湿鸡粪)。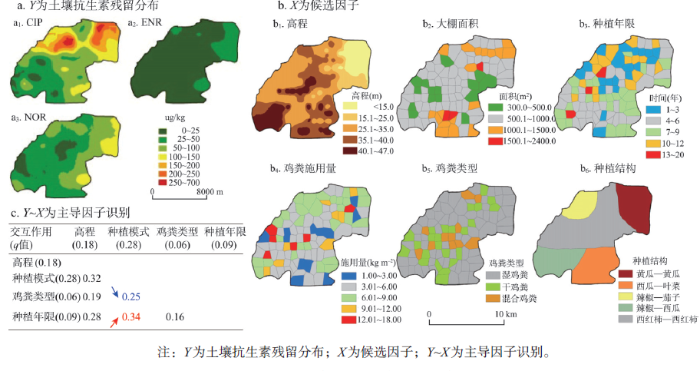 显示原图|下载原图ZIP|生成PPT
图11土壤抗生素残留及其影响因素探测[
-->Fig. 11Antibiotic residual in soil and the detection of its determinaints
-->
4.5 地理探测器应用案例分析比较
本文归纳了至2016年底,地理探测器在各方面的运用,对案例问题、研究区域、因变量Y、自变量或其代理变量X、研究发现和结论等方面进行归纳(附录),分析比较可以发现地理探测器主要运用领域包括:土地利用[37-45]、公共健康[46-54]、区域经济[35, 44, 55-61]、区域规划[45, 62-63]、旅游[64-66]、考古[67]、地质[34]、气象[68-70]、植物[71]、生态[72-75]、环境[76-78]、污染[34, 79-81]、遥感[82]和计算机网络[83]等。地理探测器已被运用于从自然到社会十分广泛的领域;其研究区域大到国家尺度,小到一个乡镇尺度。在这些应用中,地理探测器主要被用来分析各种现象的驱动力和影响因子以及多因子交互作用。这主要是因为地理探测器q值具有明确的物理含义,没有线性假设,客观地探测出自变量解释了100×q%的因变量。地理探测器在运用于因子和驱动力分析时,因变量是数值量,而自变量是类型量;如果自变量是数值量,需要将其离散化为类型量。
地理探测器作为驱动力和因子分析的有力工具[20]已经在以上案例以及关于精准扶贫的研究中得到验证。实际上,地理探测器还可以作为空间分异性分析的有力工具[21],这在关于胡焕庸线、中国热带北界的研究中可得到充分证明。
5 结论和讨论
5.1 空间分异性检验是空间数据分析的必要环节
空间自相关性和空间分异性是空间数据的两大特性,也是空间数据的两大信息资源,可以挖掘利用,以认识其背后过程机理。现代空间统计学是围绕空间自相关展开的。地理数据中的类型量广泛存在,它体现了地理对象的空间分异性,表现为层内方差小于层间方差。地理探测器是度量、挖掘和利用空间异质性的新工具,其理论核心是通过空间异质性来探测因变量与自变量之间空间分布格局的一致性,据此度量自变量对因变量的解释度,即q值。地理探测器比一般统计量有更强的势(Power),更加确信,强烈提示因果关系,因为两个变量在二维空间分布一致比两个变量的一维曲线的一致要难得多。地理探测器是空间数据探索性分析的有力工具。产生空间分异性的原因是多样的:可能由于各层(类)的机理不同,也可能是由于各层(类)的因子不同、或者各层(类)的主导因子不同。这些不同都会导致空间分异性。用全局模型分析具有异质性的对象将掩盖对象的异质性,被混杂效应所干扰,甚至导致错误的结论。因此,在数据分析开始时,就应当首先探测是否存在空间异质性,据此确定是使用全局模型、还是选取局域模型;是使用全域变量还是选用局域变量;是使用全局参数还是局域参数?表2为不同对象性质所对应的建模策略。
Tab. 2
表2
表2空间分异性和建模策略
Tab. 2Spatial stratified heterogeneity and modelling strategies
| 空间静态 | 空间分异 | ||||
|---|---|---|---|---|---|
| 机理分异 | 因素分异 | 因素影响力分异 | 原因不清 | ||
| A全局模型 | B不同模型 | C不同变量 | D不同参数 | E数据分组 | |
| 模型f | 一个 | 多个模型 | 一个模型 | 一个模型 | 尝试B |
| 变量x | 一个(组) | 一个(组)/每个模型 | 多组变量 | 一组变量 | 尝试C |
| 参数b | 一个(组) | 一个(组)/每个模型 | 多组参数 | 多组参数 | 尝试D |
| 举例 | 一个模型 y=f(x, b) CLR; Krige | 不同层不同模型 yh =fh(xh, bh) | 不同层不同变量 yh =f(xh, bh) | 不同层不同参数 yh =f(x, bh) GWR; MLM | 洪水预报:春季融雪/秋季降雨 |
新窗口打开
5.2 地理探测器的适用条件
表3比较了空间自相关检验、地理探测器和线性回归的研究对象,变量类型,统计量,模型原理,以及统计推论的差异。表4比较了地理探测器与方差分析的异同,可见地理探测器包含方差分析,比方差分析适用面更加广泛,并且具有明确的物理含义。Tab. 3
表3
表3空间热点、空间分异性和空间线性回归
Tab. 3Comparison between spatial hotspot, spatial stratified heterogeneity and spatial linear regression
| 空间热点检验 | 空间分异性检验 | 空间线性回归 | |
|---|---|---|---|
| 空间过程 | 空间局域异质性 | 空间分层异质性 | 平稳线性过程 |
| 变量 | 数值量y | 数值量y~类型量 x | 数值量y~数值量x |
| 统计量 | Getis Gi; LISA; SatScan | q统计 | β |
| 原理 | 统计量的观测值与随机期望值之差 | 两变量空间分布的一致性; x分层(分类/分区)使q值最大 | 两变量回归误差; x最优系数使R2最小 |
| 结论 | y的空间热点区 | y的解释变量x,x解释了100×q% q = SSBy/SSTy | y对x的弹性,b b = dy/dx |
新窗口打开
归纳起来,地理探测器可以为3方面使用:① 度量给定数据的空间分异性;② 寻找变量最大的空间分异;③ 寻找因变量的解释变量。
地理探测器的适用条件:① 擅长自变量X为类型量(如土地利用图),因变量Y为数值量(碳排放)的分析;② 当因变量Y和自变量X均为数值量,对X离散化转换为类型量后,运用地理探测器建立的Y和X之间的关系将比经典回归更加可靠,尤其当样本量<30时。因为统计学一般要求样本单元数>30;而地理探测器的X为类型量,同类相似,因此样本单元的代表性增加了,或者说地理探测器可以用<30的样本量达到更大样本量其他模型才能达到的统计精度;③ 对变量无线性假设,属于方差分析(ANOVA)范畴,物理含义明确的,其大小反映了X(分层或分类)对Y解释的百分比100×q%。表4展示了地理探测器与方差分析的差异。④ 地理探测器探测两变量真正的交互作用,而不限于计量经济学预先指定的乘性交互。⑤ 地理探测器原理保证了其对多自变量共线性免疫。⑥ 在分层中,要求每层至少有2个样本单元。样本越多,估计方差越小。
Tab. 4
表4
表4地理探测器q统计与方差分析的区别
Tab. 4Comparison between the GeoDetector q-statistic and ANOVA
| 均值;方差 | |||||
|---|---|---|---|---|---|
| 方差分析 | F = | F = 9894 | N/A | N/A | F = 0 |
| q-统计 | q = 1 | q = 0.8 | q = 0.7 | q = 0.6 | q = 0 |
新窗口打开
5.3 灵活使用地理探测器
地理探测器可以灵活使用,① 既可以探测全局驱动力(最大q值所对应的自变量),如某县神经管畸形发生的环境因子[20];也可以探测不同地区的局域驱动力(不同地区最大q值对应的自变量),如在不同样带城市化主导驱动力不同[35]和美国不同区域地表切割度主导因子[34];还可以探测驱动力的时间变化(不同时间段的q值),如干预前后神经管畸形主导因子的变化[74]和遥感图像滤波前后地物可分性变化[82];也可以探测不同尺度的驱动力,例如中国住宅价格在全国、省会、地级市、县不同层次各因子解释力不同[58]。② 数值量可以离散化为类型量,例如将GDP分级,从而数值量也可以使用地理探测器。③ Y和X均有空间分布,但并非必须在地理空间上分层,也可以对属性分层,即Y或X的分层可以是地理空间、时间、或者属性。以上抛砖引玉,读者可以思考各种有创意的使用方法。④ 基于Excel的地理探测器软件GeoDetector只有一个用户界面,“一键式”操作很容易掌握;不需要安装任何GIS组件,不需要用户具有GIS知识和操作技能,所有的空间信息都存储于格点中,小巧、免费;在软件使用时须要注意,对于变量采用不同的离散化粒度会对模型结果有影响,一般选择q值最大的离散化方案[31]。5.4 地理探测器使用中常见问题和解决方案
地理探测器使用中经常遇到的问题和应对方法。① 地理探测器中的自变量必须为类型量,如果数据中此变量为连续型变量,软件运行时则会报错。因变量可以为连续型变量或是二值变量。② 数据准备阶段,一般来说有两种方式生成类型数据(即形成空间分区或分层):一是通过专业知识,比如气温或降水等数据,可以通过气候带的定义等方式来确定空间上的分区;二是通过数据的分类算法来形成空间分区,目前的分类算法包括多种,如等间距法、分位数法、K-means等,也包括多种基于专业领域知识的分类算法[18],分类的效果可通过地理探测器的q统计量来评价,q值越大分区效果越好。③ 类型数据不要求必需空间连续。如土地利用类型数据中,同一类型的数据可能分布在不同的区域,空间上不一定连续。④ 空间面数据及点数据需要转换为软件输入数据:对于不规则的面状数据(如行政区域),首先通过格点化的方法生成空间上系统分布(如间距固定的规则格点)的样本点,然后把每个格点所在位置的自变量及因变量的信息提取出来,最后在把这些提取出的数据作为输入数据在软件中运行;对于规则的面状数据,如网格化数据(遥感数据),可直接利用网格提取出点数据(如中心点),然后与“不规则的面状数据”处理流程相同,利用点数据把相关变量信息提取出来,作为输入数据在软件中运行;对于随机抽样或系统抽样获取的点状数据,可直接利用此数据,并输入数据在软件中运行。对于采样有偏的点状数据,可以通过多种纠偏的方法处理后再计算。例如,样本量较少,但可以覆盖所有类型的情况,可通过Sandwich方法(www.sssampling.org/sandwich)面插值后,再利用前面所述“不规则的面状数据”的方法进一步处理;样本量较少,且不能覆盖所有类型区域,则可通过BSHADE方法(www.sssampling.org/bshade)进行插值后再做进一步的处理。⑤ 每个分层中要求至少有两个样本点,软件就可以计算。实际计算时,样本量越大,计算结果越准确。对于样本量的具体要求,与研究对象的性质有关。如果研究对象在每个层内都是均质的,则每个层内两个样本点就足够;如果研究对象在每个层内存在较大的空间异质性,则需要较大的样本量才能反映对象的真实性质,文献中常把30个样本作为大样本。⑥ q值多大时才有意义?就像其它模型(如线性回归中的R2)一样,没有明确的定义,不同专业有不同的要求。q值的物理含义是自变量x解释了100×q%的因变量y。⑦ 如何选择影响因子?与其它模型一样,选择影响因子(自变量)需要根据专业知识或借助数据探索性分析。⑧ 变量是否有正态分布的假设?如果不对q值进行统计显著性检验,此时q值仍有明确的物理意义,但不必正态分布的假设。⑨ 因变量是否要求为正值?是否需要做规一化处理?因变量不要求必需为正值,也不需要做规一化。⑩ 软件最大可容纳多少行的数据?是否可以在WPS中运行?是否可以在MAC的Excel中运行?软件最大可容纳数据量与Excel中VBA程序的限制有关,最大行是32767。软件目前版本不可以在WPS中运行,也不可以在MAC的Excel中运行。 软件是否需要借助GIS软件的处理?对于数据准备过程中的格点化以及空间叠置分析中需借助于GIS软件。 对于自变量的共线性,如何处理?地理探测器对于共线性免疫,可不用处理。附表
附表地理探测器更多典型应用
| 问题 | 区域 | 因变量Y | 自变量X | 研究发现和结论Y~X | 文献 | |
|---|---|---|---|---|---|---|
| 2008年汶川地震儿童死亡的影响因素 | 四川 汶川 | 儿童地震死亡率 | 地震烈度、高程、坡度、距断裂距离、地貌、GDP、人口密度、房屋类型 | 地震烈度、房屋倒塌和坡度是5岁以下儿童地震死亡的主要因子。高程、断裂、地貌、人口密度、GDP与地震烈度和房屋倒塌交互作用增加了死亡率。坡度引起滑坡。 | [23] | |
| 土壤抗生素空间分异的影响因素 | 山东 寿光 | 土壤抗生素浓度 | 高程、温室面积、种植年、鸡粪数量、鸡粪类型、种植模式 | ① 种植模式是土壤抗生素空间差异的主导因子,例如黄瓜—黄瓜模式(种植黄瓜收获后再接着种黄瓜)的q值是辣椒—西瓜模式的3倍;② 种植模式与鸡粪量交互大大增加了土壤抗生素污染。政策建议:调整种植结构以缓解土壤抗生素污染。 | [36] | |
| 伤寒副伤寒的影响因素 | 云南 玉溪 红塔区 | 伤寒副伤寒发病率 | 人均GDP、医疗机构数量、农民比例、人口密度、NDVI、地貌 | 社会因子对发病率影响最大。农民比例和人口密度分别解释了发病率的q = 78.3%和q = 73.8%;两者交互解释了q = 84.7%的发病率。 | [50] | |
| 手足口病的影响因素 | 中国 | 0~9岁儿童手足口病发病率 | 月均温、月降水、相对湿度、人口密度、小学生密度、中学生密度、GDP、产业结构 | 0~9岁以下儿童密度主导了手足口病的空间变异、随后的控制因子是第三产业和GDP。第三产业和儿童密度交互解释了q = 42%的手足口病空间差异,GDP与第三产业交互q = 34%,它们均大于单因子作用。第三产业具有人口流动性强的特征。 | [47] | |
| 城市景观的控制因素 | 福建 厦门 | 森林景观连通度 | 天气、FMPI、高程、人口 | 人口密度与各种生态因子交互作用,线性或非线性,帮助增强了森林景观的连通性。 | [38] | |
| 建设用地演变机理 | 南通市 | 建设用地变化速率 | 反映自然基底条件、经济发展水平、社会生活状况、政策制度环境方面15个指标 | 城乡建设用地变化形成机理差异显著,城镇用地增长受控于多种复杂因素,影响力最高的为城镇居民社会生活状况,而农村居民点用地变化则更多依赖于区位因素条件的影响,表现出其用地变化的先天依赖性与变化单一性。 | [39] | |
| 分析2010年国家级经开区经济增长率的空间分异,其核心影响因素 | 全国 | 开发区GDP增长率 | 共15个因素。内部:优惠政策、土地和劳动力成本等;外部:母城的社会经济基础,交通可达性、产业结构、投资水平、资源束缚和城市环境质量 | 影响国家级经开区经济增长率的核心因素构成在三大地区间存在差异:中部为劳动力成本变化、开发区外贸水平变化、开发区优惠政策调整、交通可达性和城市产业支撑能力;西部为开发区优惠政策调整、城市产业支撑能力、开发区外贸水平变化、开发区产业相对规模和城市投资水平;东部为开发区优惠政策调整、劳动力成本变化、城市投资水平、城市经济发展水平和城市经济活力。 | [56] | |
| 县域人均粮食占有量的形成机理 | 江西省 | 人均粮食占有量 | 人均粮食、种植结构、复种指数、灌溉指数、人均耕地面积、人均GDP、地均化肥、农机总动力、农民人均收入、农林牧渔劳动力 | 江西省县域人均粮食的空间格局主要受人均粮食占有量与人均耕地面积的影响;其次为农机总动力投入、农村居民人均纯收入、种植结构、复种指数;较低的经济水平使得全省人均粮食对自然地理条件表现出较大的依赖;4条样带县域人均粮食主导因子有区别。 | [57] | |
| 血吸虫螺情地理因素探测 | 湖北省 | 活螺密度 | DEM、水系、土壤类型和土壤质地、植被类型和植被覆盖度、土地利用 | 筛选出的地理环境指示因子及其适宜类型或范围,可应用于钉螺孳生地的遥感监测,减少钉螺调查采样的成本。 | [75] | |
| 县域新增耕地影响因素? | 湖北省 | 新增耕地数量 | 耕地面积、地形地貌、投资规模、建设规模、人均GDP、未利用地面积、经济密度、城镇化率、产业结构、人口密度等 | 2010年县域新增耕地主要影响因子为现有耕地面积、地貌类型、项目投资、建设规模和人均GDP。自然条件和土地整治政策为主要影响要素。 | [43] | |
| 甘肃省县域城镇化地域分异成因 | 甘肃省 | 县域城镇化率 | 共17个指标:反映空间集聚、经济发展、社会发展、基础设施 | 各地区城镇化进程差异实质机理并不相同,除陇东地区受到基础设施建设的影响最为突出外,其他地区都显示为受经济增长及社会发展影响最大。 | [44] | |
| 问题 | 区域 | 因变量Y | 自变量X | 研究发现和结论Y~X | 文献 | |
| 人类活动和生态因素对城市地表温影响 | 厦门 | 城市林地温度 | 人口密度、林地调查、DEM、遥感影像等 | 树种和高程是城市地表温度的最主要的因子;人类活动与特定的生态因子交互作用线性或非线性地增加了地表温度;高程和主导树种交互在高温和低温区交互显著。该发现帮助改进城市冷岛空间格局的模拟预测。 | [68] | |
| 水电站污染的来源分析 | 多瑙河 | 潜在生态风险(PERI) | 沿河河流及沉积物采样点集:重金属 | 沉积物中生态风险指标危险度PERI因子排序:Hg>Cd>As~Cu>Pb >> Zn。 | [79] | |
| 工业CO2排放的因子分析 | 内蒙古 | CO2 排放量 | GDP, 产业结构、城市化率、经济增长率人口和公路密度 | 决定力排序:人口>城市化>人均GDP>产业水平>能源强度;存在交互作,最大的交互作用是GDP和公路密度解释CO2排放的71%. | [80] | |
| 乡村居民点的空间分布特征与优化 | 中国乡镇 | 乡村居民点人口密度 | 中国行政和交通图、县级经济社会统计 | 乡村居民点分布受传统和经济影响,经济发展影响变得更加显著;其他因素包括据公路距离、农业机械化、人均粮食产量、人均耕地面积、人口密度、高程、降水等。 | [63] | |
| 蚂蚱种群动力学 | 内蒙古 | 蚂蚱密度 | 生物量等多生态 因子 | 主导因子和交互作用,为分异空间上蚂蚱疫病控制提供科学依据。 | [73] | |
| 耕地占用与补偿的驱动力及其时变 | 江苏省 | 2005-2010年3个时段耕地占用/补偿 | 自然基底、经济发展水平、社会状况、政策制度共15个指标 | 区域经济发展水平与耕地占用和补充数量的空间分布一致性最高,主要驱动因素随时间变化,2005-2010年非经济因素驱动作用增强,经济因素是主要驱动力。 | [40] | |
| 贵州煤矿区植被指数变化影响因素 | 贵州煤矿区 | 2000-2014年NDVI | 高程、坡度、坡向、土壤、多年平均降水量、多年平均气温和煤炭年产量 | 煤炭产量对矿区植被变化的解释力在7个因子中处于第3位,在遵义、毕节和六盘水市,其解释力分别排第4、第5和第5位,对植被变化解释力最大的是自然环境因子中的降水、土壤和坡度。 | [71] | |
| 大熊猫适宜区建模 | 四川雅安 | 大熊猫出现点 | 海拔、坡度、坡向、地形指数、距水源距离、植被类型、主食竹及距公路距离 | 各因子解释力(PD值)依次为:主食竹(0.6936)、海拔(0.2745)、植被类型(0.2705)、坡度(0.1887)、地形指数(0.0582)、距道路距离(0.0315)、距水源距离(0.0126)、坡向(0.0026)。具有好的生态学可解释性。 | [74] | |
| 中国老龄化空间差异的影响因子 | 中国县域 | 2000-2010年人口普查2283县人口老龄化 | 自然因素为11类生态区划;人口因素2000年年龄;经济增长、教育、卫生等 | 各因子解释力(PD值)依次为:2000年老龄化程度(q = 0.63)>10年间步入老年人口比重(q = 0.51)>平均存活子女数(q = 0.01);自然区划(q = 0.37),人均受教育年限(q = 0.14)。 | [42] | |
| 乡村聚落格局分异因子 | 宁夏盐池风沙区 | 2005-2012年乡村聚落点位 | 自然地形、区位条件及社会经济发展水平因素 | 乡村聚落空间布局分异主要受区位条件和自然地形的影响,其中区位条件影响作用力最显著,社会经济发展水平对其影响力不显著。 | [53] | |
| 县域住宅价格空间差异的影响因子 | 中国县域 | 2014年中国2873县住宅平均单价 | 租房户比重、城镇流动人口数量、城镇在岗职工平均工资、房地产从业人口比重、土地平均出让价格 | 租房户比例、流动人口规模、住房支付能力、住房市场活跃度、土地成本是中国住宅价格差异的5个核心影响因素,不同行政等级子市场的影响因素作用强度各异。全国、省会、地级市、县不同层次各因子解释力不同。 | [58] | |
| 村庄空间分布影响因素 | 中国 | 340万个自然村庄点数据来自2012年1:25万《中国电子地图》 | 高程、降水、城镇化率、交通线、固定资产投资、离中心城市距离、农村经济、人口密度等13个指标 | 村庄分布受到传统因素和经济发展双重因子的影响,传统影响因素依然在发挥作用,但经济发展的影响愈加明显。不同区域地形、水资源条件对村庄分布影响显著。交通条件、产业非农化、经济发展、农业现代化发展对乡村生活、生产空间的空间形态和分布模式产生剧烈影响。 | [62] | |
| PM2.5污染事件的影响因素 | 京津冀 | PM2.5污染事件数 | 污染企业数、降水、地形、人口数量、地表覆盖类型、年均相对湿度、年均风速 | 污染企业总数(影响力为0.97,下同)、降水量(0.93)、地形坡度(0.89)对PM2.5污染的影响显著高于其他风险因子。 | [81] | |
| 问题 | 区域 | 因变量Y | 自变量X | 研究发现和结论Y~X | 文献 | |
| 中国产业结构升级的控制因子 | 全国 | 产业结构层次系数 | 对外直接投资存量、投资流量、能源、资本、劳动力、消费水平、技术进步、国际贸易、经济水平 | 中国产业结构升级水平还受多种因素的影响,不同时期不同要素对产业结构升级水平的影响力存在差异。 | [60] | |
| 蚂蚱疫病的适生区分析 | 内蒙古镶黄旗 | 蚂蚱密度 | 高程、坡向、坡度、植被类型、土地覆被 | 两因子交互对蚂蚱密度作用明显:高程与土壤沙化等;坡向与土壤沙化等。主导因子识别帮助改进模型预报和生态控制管理。 | [72] | |
| 量化史前文化与河流的关系 | 河南省 | 遗址的密度\裴李岗时期\仰韶前期\仰韶后期\龙山时期 | 离河距离 | 克服前人研究史前聚落遗址分布与水系相关性研究方法的主观性。裴李岗文化时期、仰韶文化前期、仰韶文化后期、龙山文化时期,离水距离因子对遗址密度分布的决定力分别为39.5%、70.8%、73.0%和59.8%。 | [67] | |
| 产业结构升级因子时空差异 | 中国 | 产业结构层次系数 | GDP、电力消耗、资本、劳动力、消费水平、技术进步、贸易 | 2003-2008年和2010-2012年两个阶段,对外投资流量和存量对产业结构升级水平有很高的影响力。产业结构升级受到能源、资本、劳动力、消费、技术、贸易影响。 | [61] | |
| 农村用地地理要素识别 | 环渤海 | 农村居民点用地1985、1995、2000 | 1985、1995、2000年土地利用、地理、经济社会共17个指标 | 农村居民点用地主要驱动力是农村经济发展水平、劳动力非农化程度、和据中心城区距离。 | [45] | |
| 气温变化影响因素 | 东北 | 1960-2011各点平均气温数据时间线性倾向率 | 气候区划图、地貌区划图、植被区划图、土壤区划图、DEM、社会经济数据等 | 因子贡献量由大到小为植被类型、地貌类型、湿地率、GDP、土壤类型、人口密度、农田率、气候类型、海拔高度、森林率;社会因子增强了自然因子的贡献量,共同导致气温变化。 | [70] | |
| 居民宜居满意度的影响机理 | 北京 | 7000个居民个人宜居综合评分 | 7000个居民问卷34个宜居要素及个体属性。 | 北京市居民宜居满意度受噪音、生活设施、人文环境、出行便利、自然环境、安全环境和休闲等7个因子控制。个体与家庭对宜居满意度影响存在交互增强作用。 | [78] | |
| 植被物候影响因素 | 陕西 | 滤波前后NDVI | 各类林地和农田共14类 | q值越大,说明图像各个地物类型间的区分性越大,图像的噪声信息越少。Whittaker滤波能够有效减少NDVI原始影像的噪声,提高影像辨识度。 | [82] | |
| 城市休闲商务区RBD的成因 | 北京 | RBD面积 | 交通、居民密度、游客密度、景区位置、地价 | 大型购物中心型RBD规模受旅客密度、本地居民密度影响。休闲型商业街类型RBD受游客密度控制。城市休闲区类型RBD受与景区距离、游客密度影响较强。 | [65] | |
| 沙漠化驱动力 | 陕西 | 植被覆盖率 | 3类9个变量:自然条件、气候、人类因子 | 土壤类型、降水和风速是沙漠化的主导因子。自然要素而不是人为活动对沙漠化起更大的作用 | [76] | |
| 土地扩张驱动力 | 北京 | 建成区扩张率 | 地形、距河距离、人口、社会经济、政策 | 多因子相互作用较单因子对于建成区扩张有更大的作用。 | [37] | |
| 神经管畸形影响因子 | 山西 | 神经管畸形发病率 | 高程、土壤类型、土地利用、距河远近、距断裂线距离 | 在和顺q值:土壤(6%)>据煤区距离(4.7%)>距河流距离(4.2%);在原平q值:土壤(16.8%)>高程(16.3%)>断裂带(14%)。Q值随县不同,干预前后不同。 | [48] | |
| 美国陆表切割度的影响因素识别 | 美国 | 陆表切割度 | 气候、坡度、地形、岩石、土壤、植被 | 岩性控制了山区的切割度;曲率控制了平原区的地表切割度;冰川控制了前冰川地区的陆表切割度。地理探测器提供了一个客观的框架用来揭示控制地球表层过程的影响因素。 | [33] | |
| 沙区景观的控制因子分析 | 毛乌素沙区 | NDVI;沙覆盖比例等 | 地形、水系、气候潜在植物生产力、风力、岩性、人文因子 | 气候潜在生产力、局地地形和水系是景观的主导因子;东部沙漠化以人类活动成因为主;西两沙漠化以自然因子为主。 | [77] | |
| 残疾人就业的影响因素分析 | 中国 | 残疾人就业率 | 城市化、产业结构、人均GDP、旅客周转量、工资、社保率、医生数、医疗保险、失业险、人口密度 | 决定力q排序:医生数>旅客周转量>城市化率>产业结构>医疗保险>失业险>社保率。帮助政府制定因地制宜的残疾人就业政策。 | [49] | |
新窗口打开
The authors have declared that no competing interests exist.
参考文献 原文顺序
文献年度倒序
文中引用次数倒序
被引期刊影响因子
| [1] | |
| [2] | Biometrika. 1950 Jun;37(1-2):17-23. |
| [3] | |
| [4] | ABSTRACT Spatial point processes may be analysed at two levels. Quadrat and distance methods were designed for the sampling of a population in the field. In this paper we consider those situations in which a map of a spatial pattern has been produced at some cost and we wish to extract the maximum possible information. We review the stochastic models which have been proposed for spatial point patterns and discuss methods by which the fit of such a model can be tested. Certain models are shown to be the equilibrium distributions of spatial-temporal stochastic processes. The theory is illustrated by several case studies. |
| [5] | Introduced in this paper is a family of statistics, G, that can be used as a measure of spatial association in a number of circumstances. The basic statistic is derived, its properties are identified, |
| [6] | |
| [7] | The scan statistic is commonly used to test if a one dimensional point process is purely random, or if any clusters can be detected. Here it is simultaneously extended in three directions:(i) a spatial scan statistic for the detection of clusters in a multi-dimensional point process is proposed, (ii) the area of the scanning window is allowed to vary, and (iii) the baseline process may be any inhomogeneous Poisson process or Bernoulli process with intensity pro-portional to some known function. The main interest is in detecting clusters not explained by the baseline process. These methods are illustrated on an epidemiological data set, but there are other potential areas of application as well. |
| [8] | Publication » Random Field Models in Earth Sciences. |
| [9] | ABSTRACT Statistical data are ”spatial” when they are compiled according to a topographical classification or simply consist of a pattern of points, or are otherwise associated with maps or locations. The authors’ earlier ”Spatial autocorrelation.” Academic Press (1973) addressed hypothesis testing for the correlation and trend in a spatially-observed variable. The new book is enlarged to cover extensive recent work on models and analysis of spatial patterns. Compared to B. D. Ripley’s book ”Spatial statistics.” (1981; Zbl 0583.62087)] the present book contains more evaluation of the statistical performance of proposed methods upon case studies (mainly demographic), and less exposition of mathematical aspects of model-building or image analysis. Features are the discussions of scale and of model identification, caveats on the use of statistical methods based on independence, and analysis of regression residuals. Correlograms (but not spectral analysis) are prominent. The book is addressed to a mixed audience and supplies 258 references. |
| [10] | Spatial econometrics : methods and models by Luc Anselin (Studies in operational regional science, 4) Kluwer Academic Publishers, c1988 : pbk |
| [11] | |
| [12] | |
| [13] | Spatial data analysis : theory and practice Robert Haining Cambridge University Press, 2003 : pbk |
| [14] | <p> 地理学长期关注的人类与环境之间的相互关系,以及地球表层重要特征及其空间结构变化,正逐渐成为当代科学和社会的核心议题,直指今天大众和决策者的紧迫关切。然而,社会对地理学的认识还很不充分,以至于在应对环境变化、资源稀缺、发展失衡、国家冲突等重大问题上受到很多限制。因此,很有必要以当代科学和社会的视角来重新认识地理学。笔者以全球变化和可持续发展的新视角,论述了地理学的研究对象、认识途径、核心概念、在科学知识体系中的地位、在满足社会需求中的作用,以及在国家科技发展中的作用。</p> . <p> 地理学长期关注的人类与环境之间的相互关系,以及地球表层重要特征及其空间结构变化,正逐渐成为当代科学和社会的核心议题,直指今天大众和决策者的紧迫关切。然而,社会对地理学的认识还很不充分,以至于在应对环境变化、资源稀缺、发展失衡、国家冲突等重大问题上受到很多限制。因此,很有必要以当代科学和社会的视角来重新认识地理学。笔者以全球变化和可持续发展的新视角,论述了地理学的研究对象、认识途径、核心概念、在科学知识体系中的地位、在满足社会需求中的作用,以及在国家科技发展中的作用。</p> |
| [15] | . 正如所有事物都在时间中存在而有其历史一样,所有现象也在空间中存在而有其地理。地理学是认识世界不可或缺的重要视角。从地理学的研究对象、研究途径、学科构成,地理学的关键概念和研究核心,地理学对科学的贡献、在人类知识体系中的地位以及实践价值等方面,可以认识到当代地理学的性质及其作用。 . 正如所有事物都在时间中存在而有其历史一样,所有现象也在空间中存在而有其地理。地理学是认识世界不可或缺的重要视角。从地理学的研究对象、研究途径、学科构成,地理学的关键概念和研究核心,地理学对科学的贡献、在人类知识体系中的地位以及实践价值等方面,可以认识到当代地理学的性质及其作用。 |
| [16] | <p>中国主体功能区划方案是刻画未来中国国土空间开发与保护格局的规划蓝图,主体功能区规划已上升为主体功能区战略和主体功能区制度。2004-2014年,笔者组织系列研究项目,配合国家编制主体功能区规划,研究地域功能基础理论和功能区划技术流程,提出国家和省区尺度进行空间管制的地域功能区域类型为城市化区域、粮食安全区域、生态安全区域、文化和自然遗产区域等4类,在此基础上转化为以县级行政区划为单元的优化开发、重点开发、限制开发和禁止开发4类主体功能区。研制了由水资源、土地资源,生态重要性、生态脆弱性、环境容量、灾害危险性、经济发展水平、人口集聚度和交通优势度等9类可定量指标及战略选择为1项定性指标构成的地域功能识别指标体系,进行了单项指标评价,开发并运用地域功能适宜程度综合评价指数进行了综合评价,测算了各省区保护类区域下限、开发类区域上限以及开发强度等关键参数;研讨了以规划为应用指向的主体功能区划分方法,形成中国首部主体功能区划方案,按照全国主体功能区规划口径,2020年与2010年相比,全国国土空间开发强度从3.48%增加到3.91%;按照省区集成的主体功能区规划口径,优化、重点、限制开发区域的土地面积比重分别为1.48%、13.60%、84.92%,城市化、粮食安全、生态安全区域的土地面积比重分别为15.08%、26.11%、58.81%。结合区域发展水平、资源环境承载状态、民生质量等相关分析,给出了主体功能区的主要特征。通过区划方案校验,国家和省区分两级采用笔者主持制定的《主体功能区划技术规程》互动完成的全国主体功能区划方案,同预判的吻合程度多为80%以上。</p> . <p>中国主体功能区划方案是刻画未来中国国土空间开发与保护格局的规划蓝图,主体功能区规划已上升为主体功能区战略和主体功能区制度。2004-2014年,笔者组织系列研究项目,配合国家编制主体功能区规划,研究地域功能基础理论和功能区划技术流程,提出国家和省区尺度进行空间管制的地域功能区域类型为城市化区域、粮食安全区域、生态安全区域、文化和自然遗产区域等4类,在此基础上转化为以县级行政区划为单元的优化开发、重点开发、限制开发和禁止开发4类主体功能区。研制了由水资源、土地资源,生态重要性、生态脆弱性、环境容量、灾害危险性、经济发展水平、人口集聚度和交通优势度等9类可定量指标及战略选择为1项定性指标构成的地域功能识别指标体系,进行了单项指标评价,开发并运用地域功能适宜程度综合评价指数进行了综合评价,测算了各省区保护类区域下限、开发类区域上限以及开发强度等关键参数;研讨了以规划为应用指向的主体功能区划分方法,形成中国首部主体功能区划方案,按照全国主体功能区规划口径,2020年与2010年相比,全国国土空间开发强度从3.48%增加到3.91%;按照省区集成的主体功能区规划口径,优化、重点、限制开发区域的土地面积比重分别为1.48%、13.60%、84.92%,城市化、粮食安全、生态安全区域的土地面积比重分别为15.08%、26.11%、58.81%。结合区域发展水平、资源环境承载状态、民生质量等相关分析,给出了主体功能区的主要特征。通过区划方案校验,国家和省区分两级采用笔者主持制定的《主体功能区划技术规程》互动完成的全国主体功能区划方案,同预判的吻合程度多为80%以上。</p> |
| [17] | <p>主体功能区思想下的国土协调开发是当前主导的区域发展理论。这种区域思想指导下的产业结构演化路径以及由此形成的新型区域协调关系是需要关注的重大问题。基于省级多区域动态CGE模型, 面向主体功能区格局进行区域分析, 并开展白、黄、蓝3 种区域产业政策情景模拟, 其中白情景作为比对的基准情景, 黄情景和蓝情景分别刻划面向优化开发主导区金融服务业的倾向政策和面向重点开发主导区工业发展的倾向政策。研究发现主体功能区的竞争主要体现为优化开发主导区和重点开发主导区之间的竞争, 在推进“主体功能区政策”作用下, 区域差距将会增大, 区域自然收敛的动力还不足以较快缩小区域差距, 从而需要更强烈的区域政策进行调控。另外, 区域产业结构自然演化的结果会带来“自动”碳减排, 从而衍生出更强的减排政策评判标准。</p> . <p>主体功能区思想下的国土协调开发是当前主导的区域发展理论。这种区域思想指导下的产业结构演化路径以及由此形成的新型区域协调关系是需要关注的重大问题。基于省级多区域动态CGE模型, 面向主体功能区格局进行区域分析, 并开展白、黄、蓝3 种区域产业政策情景模拟, 其中白情景作为比对的基准情景, 黄情景和蓝情景分别刻划面向优化开发主导区金融服务业的倾向政策和面向重点开发主导区工业发展的倾向政策。研究发现主体功能区的竞争主要体现为优化开发主导区和重点开发主导区之间的竞争, 在推进“主体功能区政策”作用下, 区域差距将会增大, 区域自然收敛的动力还不足以较快缩小区域差距, 从而需要更强烈的区域政策进行调控。另外, 区域产业结构自然演化的结果会带来“自动”碳减排, 从而衍生出更强的减排政策评判标准。</p> |
| [18] | 提出了基于案例推理 (CBR)的遥感分类的新方法。基于规则的专家系统被用来提高遥感分类的效率。但所涉及的规则可能多达上百或上千条 ,有的问题根本无法用规则来表达。CBR只是根据以往的案例进行推理 ,克服了基于规则的推理方法的不足 ,可以用来解决一些复杂的资源环境问题。利用CBR和模糊数学结合 ,并通过分层随机采样来控制案例在空间上的分布 ,以反映复杂环境所造成的光谱变化 ,由此解决遥感分类中的“同物异谱”现象。实验表明 ,所建立的案例库可以被重复多次使用 ,分类的效果比监督分类和非监督分类要好。 . 提出了基于案例推理 (CBR)的遥感分类的新方法。基于规则的专家系统被用来提高遥感分类的效率。但所涉及的规则可能多达上百或上千条 ,有的问题根本无法用规则来表达。CBR只是根据以往的案例进行推理 ,克服了基于规则的推理方法的不足 ,可以用来解决一些复杂的资源环境问题。利用CBR和模糊数学结合 ,并通过分层随机采样来控制案例在空间上的分布 ,以反映复杂环境所造成的光谱变化 ,由此解决遥感分类中的“同物异谱”现象。实验表明 ,所建立的案例库可以被重复多次使用 ,分类的效果比监督分类和非监督分类要好。 |
| [19] | Abstract Zoning strategic agricultural land for protection has become important in reducing agricultural land loss in rapidly growing areas. In this paper, a constrained CA model based on the integration of remote sensing, GIS, and cellular automata (CA) techniques was developed to overcome the limitations of the existing methods commonly used by planners in zoning land for agricultural protection. Remote sensing data were used to calculate the normalized difference vegetation index (NDVI) which was the initial map used for the model. The factors of land suitability and geometry were embedded in the model to facilitate the rational allocation of land for agricultural protection. The CA model was implemented within a geographic information system which provided useful constraint information and modeling environment. "Grey cells" were defined in the CA model to improve modeling accuracy. The model has been tested in the Pearl River Delta, one of the fastest growing areas in China. |
| [20] | Physical environment, man‐made pollution, nutrition and their mutual interactions can be major causes of human diseases. These disease determinants have distinct spatial distributions across geographical units, so that their adequate study involves the investigation of the associated geographical strata. We propose four geographical detectors based on spatial variation analysis of the geographical strata to assess the environmental risks of health: the risk detector indicates where the risk areas are; the factor detector identifies factors that are responsible for the risk; the ecological detector discloses relative importance between the factors; and the interaction detector reveals whether the risk factors interact or lead to disease independently. In a real‐world study, the primary physical environment (watershed, lithozone and soil) was found to strongly control the neural tube defects (NTD) occurrences in the Heshun region (China). Basic nutrition (food) was found to be more important than man‐made pollution (chemical fertilizer) in the control of the spatial NTD pattern. Ancient materials released from geological faults and subsequently spread along slopes dramatically increase the NTD risk. These findings constitute valuable input to disease intervention strategies in the region of interest. |
| [21] | Abstract Spatial stratified heterogeneity, referring to the within-strata variance less than the between strata-variance, is ubiquitous in ecological phenomena, such as ecological zones and many ecological variables. Spatial stratified heterogeneity reflects the essence of nature, implies potential distinct mechanisms by strata, suggests possible determinants of the observed process, allows the representativeness of observations of the earth, and enforces the applicability of statistical inferences. In this paper, we propose a q-statistic method to measure the degree of spatial stratified heterogeneity and to test its significance. The q value is within [0,1] (0 if a spatial stratification of heterogeneity is not significant, and 1 if there is a perfect spatial stratification of heterogeneity). The exact probability density function is derived. The q-statistic is illustrated by two examples, wherein we assess the spatial stratified heterogeneities of a hand map and the distribution of the annual NDVI in China. |
| [22] | |
| [23] | MONITORING NETWORK; OPTIMAL SELECTION; KRIGING VARIANCE; AREAL RAINFALL; AVERAGE; DESIGN |
| [24] | Background Population health attributes (such as disease incidence and prevalence) are often estimated using sentinel hospital records, which are subject to multiple sources of uncertainty. When applied to these health attributes, commonly used biased estimation techniques can lead to false conclusions and ineffective disease intervention and control. Although some estimators can account for measurement error (in the form of white noise, usually after de-trending), most mainstream health statistics techniques cannot generate unbiased and minimum error variance estimates when the available data are biased. Methods and Findings A new technique, called the Biased Sample Hospital-based Area Disease Estimation (B-SHADE), is introduced that generates space-time population disease estimates using biased hospital records. The effectiveness of the technique is empirically evaluated in terms of hospital records of disease incidence (for hand-foot-mouth disease and fever syndrome cases) in Shanghai (China) during a two-year period. The B-SHADE technique uses a weighted summation of sentinel hospital records to derive unbiased and minimum error variance estimates of area incidence. The calculation of these weights is the outcome of a process that combines: the available space-time information; a rigorous assessment of both, the horizontal relationships between hospital records and the vertical links between each hospital's records and the overall disease situation in the region. In this way, the representativeness of the sentinel hospital records was improved, the possible biases of these records were corrected, and the generated area incidence estimates were best linear unbiased estimates (BLUE). Using the same hospital records, the performance of the B-SHADE technique was compared against two mainstream estimators. Conclusions The B-SHADE technique involves a hospital network-based model that blends the optimal estimation features of the Block Kriging method and the sample bias correction efficiency of the ratio estimator method. In this way, B-SHADE can overcome the limitations of both methods: Block Kriging's inadequacy concerning the correction of sample bias and spatial clustering; and the ratio estimator's limitation as regards error minimization. The generality of the B-SHADE technique is further demonstrated by the fact that it reduces to Block Kriging in the case of unbiased samples; to ratio estimator if there is no correlation between hospitals; and to simple statistic if the hospital records are neither biased nor space-time correlated. In addition to the theoretical advantages of the B-SHADE technique over the two other methods above, two real world case studies (hand-foot-mouth disease and fever syndrome cases) demonstrated its empirical superiority, as well. |
| [25] | If not handled properly, a biased sample from a population usually results in a biased estimation of the population. The bias of a sample can be caused by selection bias or attrition bias. The B-SHADE (Biased Sentinel Hospital based Area Disease Estimation) model provides a best linear unbiased estimation (BLUE) solution by incorporating the ratio between the sample and the population, the autocorrelation within the population, and support from historical data. Three extensions are proposed and implemented in the software based on the B-SHADE model. First, we extend the original population total-oriented estimation method to population mean estimation, which is another important parameter in sampling. Second, a historical sample rather than a historical population is found to be applicable in population mean estimation. This is particularly important in practice, where there is no integrated historical population information but good historical samples. Finally, efficient sampling optimization based on the simulated annealing algorithm is proposed and implemented in the software. This is useful in evaluating the efficiency of old samples and designing new samples. A demonstration shows that when the "vertical" relationship and "horizontal" correlation can be well represented and calculated from historical data, the result estimated by the B-SHADE model is better than results from traditional simple random sampling and ratio estimation. Although the B-SHADE model was originally designed for sentinel hospitals, the software is a common tool for similar problems in different applications. |
| [26] | Some climate datasets are incomplete at certain places and times. A novel technique called the point estimation model of Biased Sentinel Hospitals-based Area Disease Estimation (P-BSHADE) is introduced to interpolate missing data in temperature datasets. Effectiveness of the technique was empirically evaluated in terms of an annual temperature dataset from 1950 to 2000 in China. The P-BSHADE technique uses a weighted summation of observed stations to derive unbiased and minimum error variance estimates of missing data. Both the ratio and covariance between stations were used in calculation of these weights. In this way, interpolation of missing data in the temperature dataset was improved, and best linear unbiased estimates (BLUE) were obtained. Using the same dataset, performance of P-BSHADE was compared against three estimators: kriging, inverse distance weighting (IDW), and spatial regression test (SRT). Kriging and IDW assume a homogeneous stochastic field, which may not be the case. SRT employs spatiotemporal data and has the potential to consider temperature nonhomogeneity caused by topographic differences, but has no objective function for the BLUE. Instead, P-BSHADE takes into account geographic spatial autocorrelation and nonhomogeneity, and maximizes an objective function for the BLUE of the target station. In addition to the theoretical advantages of P-BSHADE over the three other methods, case studies for an annual Chinese temperature dataset demonstrate its empirical superiority, except for the SRT from 1950 to 1970. |
| [27] | There has been discrepancies between the daily air quality reports of the Beijing municipal government, observations recorded at the U.S. Embassy in Beijing, and Beijing residents' perceptions of air quality. This study estimates Beijing's daily area PM(2.5) mass concentration by means of a novel technique SPA (Single Point Areal Estimation) that uses data from the single PM(2.5) observation station of the U.S Embassy and the 18 PM(10) observation stations of the Beijing Municipal Environmental Protection Bureau. The proposed technique accounts for empirical relationships between different types of observations, and generates best linear unbiased pollution estimates (in a statistical sense). The technique extends the daily PM(2.5) mass concentrations obtained at a single station (U.S. Embassy) to a citywide scale using physical relations between pollutant concentrations at the embassy PM(2.5) monitoring station and at the 18 official PM(10) stations that are evenly distributed across the city. Insight about the technique's spatial estimation accuracy (uncertainty) is gained by means of theoretical considerations and numerical validations involving real data. The technique was used to study citywide PM(2.5) pollution during the 423-day period of interest (May 10, 2010 to December 6, 2011). Finally, a freely downloadable software library is provided that performs all relevant calculations of pollution estimation. |
| [28] | Spatial sampling is widely used in environmental and social research. In this paper we consider the situation where instead of a single global estimate of the mean of an attribute for an area, estimates are required for each of many geographically defined reporting units (such as counties or grid cells) because their means cannot be assumed to be the same as the global figure. Not only may survey costs greatly increase if sample size has to be a function of the number of reporting units, estimator sampling error tends to be large if the population attribute of each reporting unit can be estimated by using only those samples actually lying inside the unit itself. This study proposes a computationally simple approach to multi-unit reporting by using analysis of variance and incorporating wice-stratified statistics. We assume that, although the area is heterogeneous (the mean varies across the area), it can be zoned (or stratified) into homogeneous subareas (the mean is constant within each subarea) and, in addition, that it is possible to acquire prior knowledge about this partition. This zoning of the study area is independent of the reporting units. The zone estimates are transferred to the reporting units. We call the methodology sandwich estimation and we report two contrasting empirical studies to demonstrate the application of the methodology and to compare its performance against some other existing methods for tackling this problem. Our study shows that sandwich estimation performs well against two other frequently used, probabilistic, model-based approaches to multi-unit reporting on stratified heterogeneous surfaces whilst having the advantage of computational simplicity. We suggest those situations where sandwich estimation might be expected to do well. Keywords: sandwich estimation, heterogeneous surface, zoning; kriging estimates, hierarchical Bayesian estimates Spatial sampling is widely used in environmental and social research. In this paper we consider the situation where instead of a single global estimate of the mean of an attribute for an area, estimates are required for each of many geographically defined reporting units (such as counties or grid cells) because their means cannot be assumed to be the same as the global figure. Not only may survey costs greatly increase if sample size has to be a function of the number of reporting units, estimator sampling error tends to be large if the population attribute of each reporting unit can be estimated by using only those samples actually lying inside the unit itself. This study proposes a computationally simple approach to multi-unit reporting by using analysis of variance and incorporating wice-stratified statistics. We assume that, although the area is heterogeneous (the mean varies across the area), it can be zoned (or stratified) into homogeneous subareas (the mean is constant within each subarea) and, in addition, that it is possible to acquire prior knowledge about this partition. This zoning of the study area is independent of the reporting units. The zone estimates are transferred to the reporting units. We call the methodology sandwich estimation and we report two contrasting empirical studies to demonstrate the application of the methodology and to compare its performance against some other existing methods for tackling this problem. Our study shows that sandwich estimation performs well against two other frequently used, probabilistic, model-based approaches to multi-unit reporting on stratified heterogeneous surfaces whilst having the advantage of computational simplicity. We suggest those situations where sandwich estimation might be expected to do well. Keywords: sandwich estimation, heterogeneous surface, zoning; kriging estimates, hierarchical Bayesian estimates |
| [29] | Abstract Physical environment, man‐made pollution, nutrition and their mutual interactions can be major causes of human diseases. These disease determinants have distinct spatial distributions across geographical units, so that their adequate study involves the investigation of the associated geographical strata. We propose four geographical detectors based on spatial variation analysis of the geographical strata to assess the environmental risks of health: the risk detector indicates where the risk areas are; the factor detector identifies factors that are responsible for the risk; the ecological detector discloses relative importance between the factors; and the interaction detector reveals whether the risk factors interact or lead to disease independently. In a real‐world study, the primary physical environment (watershed, lithozone and soil) was found to strongly control the neural tube defects (NTD) occurrences in the Heshun region (China). Basic nutrition (food) was found to be more important than man‐made pollution (chemical fertilizer) in the control of the spatial NTD pattern. Ancient materials released from geological faults and subsequently spread along slopes dramatically increase the NTD risk. These findings constitute valuable input to disease intervention strategies in the region of interest. |
| [30] | Human health is affected by many environmental factors. Geographical detector is software based on spatial variation analysis of the geographical strata of variables to assess the environmental risks to human health: the risk detector indicates where the risk areas are; the factor detector identifies which factors are responsible for the risk; the ecological detector discloses the relative importance of the factors; and the interaction detector reveals whether the risk factors interact or lead independently to disease. (C) 2012 Elsevier Ltd. All rights reserved. |
| [31] | The geographical detectors model is a new spatial analysis method for the assessment of health risks. It is adapted to discrete risk factors. Meanwhile, the geographical detectors model also effectively analyzes the continuous risk factors by discretizing the continuous data into discrete data. The biggest difficulty is in deciding how to discretize continuous risk factors using the most appropriate discretization method. In this paper, we will discuss the selection of an optimal discretization method for geographical detectors-based risk assessment, and exemplify the process using neural tube defects (NTD) from the Heshun County, Shanxi Province, China. |
| [32] | |
| [33] | Previous studies of land dissection density (D) often find contradictory results regarding factors controlling its spatial variation. We hypothesize that the dominant controlling factors (and the interactions between them) vary from region to region due to differences in each region's local characteristics and geologic history. We test this hypothesis by applying a geographical detector method to eight physiographic divisions of the conterminous United States and identify the dominant factor(s) in each. The geographical detector method computes the power of determinant (q) that quantitatively measures the affinity between the factor considered and D. Results show that the factor (or factor combination) with the largest q value is different for physiographic regions with different characteristics and geologic histories. For example, lithology dominates in mountainous regions, curvature dominates in plains, and glaciation dominates in previously glaciated areas. The geographical detector method offers an objective framework for revealing factors controlling Earth surface processes. |
| [34] | Recent studies in PM2.5 sources show that anthropogenic emissions are the main contributors to haze pollution. Due to their essential roles in establishing policies for improving air quality, socioeconomic drivers of PM2.5 levels have attracted increasing attention. Unlike previous studies focusing on the annual PM2.5 concentration (Cyear), this paper focuses on the accumulation phase of PM2.5 during the pollution episode (PMAE) in the Yangtze River Delta in China. This paper mainly explores the spatial variations of PMAE and its links to the socioeconomic factors using a geographical detector and simple linear regression. The results indicated that PM2.5 was more likely to accumulate in more developed cities, such as Nanjing and Shanghai. Compared with Cyear, PMAE was more sensitive to socioeconomic impacts. Among the twelve indicators chosen for this study, population density was an especially critical factor that could affect the accumulation of PM2.5 dramatically and accounted for the regional difference. A 1% increase in population density could cause a 0.167% rise in the maximal increment and a 0.214% rise in the daily increase rate of PM2.5. Additionally, industry, energy consumption, and vehicles were also significantly associated with PM2.5 accumulation. These conclusions could serve to remediate the severe PM2.5 pollution in China. |
| [35] | 本文综合运用样带、地统计、地理探测器等多种研究方法,分析了1990年以来中国县域城镇化的时空特征及形成机理。研究表明①中国县域城镇化水平时空动态的差异特征显著,北方边境县域高城镇化和东部沿海县域高城镇化形成的“人字形”空间形态逐渐凸显;以武汉都市圈为中心的两湖地区、成渝地区、关中—天水经济区的县域城镇化水平提升较快,西南地区、青藏高原地区保持较低的城镇化水平;②2000年以来中国县域城镇化水平及其变化速度的区域差异逐渐缩小,陇海兰新线、长江沿线、北方边境、106国道、东部沿海样带县域城镇化差异明显;县域经济发展阶段、固定资产投资、离中心城市距离、二三产业水平、农民人均纯收入、人口密度是影响县域城镇化空间分异的主要因素,同时粮食生产主导定位、非农业人口统计口径、城镇设置标准等因素也影响县域城镇化水平及发展过程。未来城镇化发展应遵循地域差异,凸显主导功能,推进优化与重点发展区的集约型城镇化、耕地与粮食主产区的分流型城镇化、生态与水源保护区的迁移型城镇化,以及园区与城镇近郊区的融入型城镇化,实现城乡土地资源集约利用,促进城镇化进程中人—地—业耦合与协调发展。 . 本文综合运用样带、地统计、地理探测器等多种研究方法,分析了1990年以来中国县域城镇化的时空特征及形成机理。研究表明①中国县域城镇化水平时空动态的差异特征显著,北方边境县域高城镇化和东部沿海县域高城镇化形成的“人字形”空间形态逐渐凸显;以武汉都市圈为中心的两湖地区、成渝地区、关中—天水经济区的县域城镇化水平提升较快,西南地区、青藏高原地区保持较低的城镇化水平;②2000年以来中国县域城镇化水平及其变化速度的区域差异逐渐缩小,陇海兰新线、长江沿线、北方边境、106国道、东部沿海样带县域城镇化差异明显;县域经济发展阶段、固定资产投资、离中心城市距离、二三产业水平、农民人均纯收入、人口密度是影响县域城镇化空间分异的主要因素,同时粮食生产主导定位、非农业人口统计口径、城镇设置标准等因素也影响县域城镇化水平及发展过程。未来城镇化发展应遵循地域差异,凸显主导功能,推进优化与重点发展区的集约型城镇化、耕地与粮食主产区的分流型城镇化、生态与水源保护区的迁移型城镇化,以及园区与城镇近郊区的融入型城镇化,实现城乡土地资源集约利用,促进城镇化进程中人—地—业耦合与协调发展。 |
| [36] | . Abstract Recent studies have demonstrated the persistence of antibiotics in soil, especially in areas of vegetable cultivation. However, there are very few studies of the influence of planting regimes on the levels of antibiotic pollution. This work introduces geographical-detector models to investigate the relationship between planting patterns (vegetable planting model, manure type and quantity, planting age, greenhouse area, and topographic elevation) and residual fluoroquinolones (FQs) in soil in a pilot project in Shouguang County, Shandong Province (the largest vegetable-producing area in China). The results led to the following findings. 1. The vegetable planting model is the major determinant of the spatial stratification of FQ in the soil. For example, the "cucumber-cucumber" model (growing cucumbers after cucumbers) has a three-fold power of determinant compared to the "pepper-melon" model (growing melons after peppers). 2. Planting age (years with continuous vegetable cultivation) does not necessarily affect the spatial distribution of FQ owing to their relatively short degradation period. 3. Interactions between risk factors were more significant than the individual factors for FQ pollution. In particular, the interaction between the vegetable planting model and amount of manure resulted in the highest pollution level. The findings of the present study make it possible to introduce effective and practical measures to alleviate pollution of soils by FQ in the study area. Adjustment of the vegetable cultivation models and application of chicken manure (less than 6kg/m(2) manure annually with a more dry than fresh manure) could be an effective and flexible approach to alleviate FQ pollution. |
| [37] | |
| [38] | Geographical detector models provide a quantitative approach for evaluating spatial correlations among ecological factors, population density and landscape connectivity. Here, we used a geographical model to assess the influence of different gradients of urbanization, human activities and various environmental factors on the connectivity of urban forest landscapes in Xiamen, China from 1996 to 2006. Our overarching hypothesis is that human activity has modified certain ecological factors in a way that has affected the connectivity of urban forest landscapes. Therefore, spatiotemporal distributions of landscape connectivity should be similar to those of ecological factors and can be represented quantitatively. Integral indices of connectivity and population density were employed to represent urban forest landscape connectivity and human activity, respectively. We then simulated the spatial relationship between forest patches and population density with Conefor 2.6 software. A geographical detector model was used to identify the dominant factors that affect urban forest landscape connectivity. The results showed that a distance of 600聽m was the threshold of node importance. Mean annual temperature, mean annual precipitation, elevation, patch area, population density and dominant species had significant effects on the node importance. Mean annual temperature was more significant than population density in controlling the spatial pattern of the delta of the integral index of connectivity (dIIC). The spatial interaction between population density and various ecological factors as well as their linearly enhanced or nonlinearity enhanced urban forest landscape connectivity. In conclusion, a combination of graph theory and geographical detector models is effective for quantitatively evaluating interactive relationships among ecological factors, population density and landscape connectivity. |
| [39] | 本文选择东部沿海“国家两大发展战略”交汇城市——南通市作为研究区,面对其新形势下的用地需求与矛盾,综合运用建设用地变化测度指标、城乡建设用地协调评价模型、地理探测器等多种研究方法,分析了2001-2011年南通市城乡建设用地演变时空特征及形成机理,结果表明:①南通市城镇用地扩张速度具有明显的阶段性与波动性,空间分布呈现“北高南低、西高东低、沿江高于沿海”的特征,同时其扩张弹性系数总体处于较高水平,未达到理想集约利用状态;②南通市农村居民点用地在城镇化推进下并未与农村人口非农化减少相挂钩,在研究期内基本处于加速增长态势,空间分布表现为“中部沿海扩展、南北沿江减少”的特征,过半数区、县(市)农村居民点用地增长模式属于人减地增粗放型;③全市城乡建设用地变化不甚协调,多数区、县(市)农村居民点用地增加量大于城镇用地增加量,且城镇发展不能较好满足城镇人口增长需要,在一定程度上影响了城镇化质量;④城乡建设用地变化形成机理差异显著,城镇用地增长受控于多种复杂因素,影响力最高的为城镇居民社会生活状况,而农村居民点用地变化则更多依赖于区位因素条件的影响,表现出其用地变化的先天依赖性与变化单一性。 . 本文选择东部沿海“国家两大发展战略”交汇城市——南通市作为研究区,面对其新形势下的用地需求与矛盾,综合运用建设用地变化测度指标、城乡建设用地协调评价模型、地理探测器等多种研究方法,分析了2001-2011年南通市城乡建设用地演变时空特征及形成机理,结果表明:①南通市城镇用地扩张速度具有明显的阶段性与波动性,空间分布呈现“北高南低、西高东低、沿江高于沿海”的特征,同时其扩张弹性系数总体处于较高水平,未达到理想集约利用状态;②南通市农村居民点用地在城镇化推进下并未与农村人口非农化减少相挂钩,在研究期内基本处于加速增长态势,空间分布表现为“中部沿海扩展、南北沿江减少”的特征,过半数区、县(市)农村居民点用地增长模式属于人减地增粗放型;③全市城乡建设用地变化不甚协调,多数区、县(市)农村居民点用地增加量大于城镇用地增加量,且城镇发展不能较好满足城镇人口增长需要,在一定程度上影响了城镇化质量;④城乡建设用地变化形成机理差异显著,城镇用地增长受控于多种复杂因素,影响力最高的为城镇居民社会生活状况,而农村居民点用地变化则更多依赖于区位因素条件的影响,表现出其用地变化的先天依赖性与变化单一性。 |
| [40] | 基于1987、2000、2005和2010年4个时点的土地利用动态监测数据,运用重心模型、区位基尼系数、地理集中度、地理探测器模型,分析江苏省1987—2010年耕地占补时空特征及其主要驱动因子。结果显示:11987—2010年江苏省耕地占用和补充的数量均持续增加,速度不断加快,且大部分发生在平原地区,苏南地区比例较高,占用和补充的水田比例都较高。2在1987—2000年、2000—2005年、2005—2010年3个监测时段,耕地占用的重心先向南移动,又大幅度向北移动,耕地补充的重心则持续由苏北移向苏南,三大地区的占补平衡率存在较大差异。3耕地占用的主要去向是建设占用,50.83%是农村居民点占用;耕地补充的主要途径是土地整治和农业结构调整,其中59.63%的补充耕地来源于农村居民点整理。4从整个监测时段来看,区域经济发展水平与耕地占用和补充数量的空间分布一致性最高,不同监测时段主要驱动因素不同,2005—2010年非经济因素的驱动作用增强。江苏省耕地占补时空特征具有明显的差异性,经济因素是其主要驱动因子,应合理调整产业布局和区域整体规划,保护耕地,促进城乡社会经济协调发展。 . 基于1987、2000、2005和2010年4个时点的土地利用动态监测数据,运用重心模型、区位基尼系数、地理集中度、地理探测器模型,分析江苏省1987—2010年耕地占补时空特征及其主要驱动因子。结果显示:11987—2010年江苏省耕地占用和补充的数量均持续增加,速度不断加快,且大部分发生在平原地区,苏南地区比例较高,占用和补充的水田比例都较高。2在1987—2000年、2000—2005年、2005—2010年3个监测时段,耕地占用的重心先向南移动,又大幅度向北移动,耕地补充的重心则持续由苏北移向苏南,三大地区的占补平衡率存在较大差异。3耕地占用的主要去向是建设占用,50.83%是农村居民点占用;耕地补充的主要途径是土地整治和农业结构调整,其中59.63%的补充耕地来源于农村居民点整理。4从整个监测时段来看,区域经济发展水平与耕地占用和补充数量的空间分布一致性最高,不同监测时段主要驱动因素不同,2005—2010年非经济因素的驱动作用增强。江苏省耕地占补时空特征具有明显的差异性,经济因素是其主要驱动因子,应合理调整产业布局和区域整体规划,保护耕地,促进城乡社会经济协调发展。 |
| [41] | 为探寻农地非农化水平空间非均衡及形成机理,确定影响因素对重庆市及所属不同区域农地非农化水平的决定力。研究基于交叉学科视角,利用1997—2013年重庆及所属37个区县(不含渝中区)面板数据,运用Dagum基尼系数和地理探测器模型分析重庆市农地非农化水平的空间非均衡及形成机理。结果表明:重庆市农地非农化水平的时空动态地域性差异特征明显,呈现以区域Ⅰ为中心,区域Ⅱ为中心拓展区,区域Ⅲ和Ⅳ为外围的"中心—外围"空间分异格局;重庆市农地非农化水平空间分布表现出高度非均衡特征,其空间非均衡程度在研究时段内呈现出明显的"W"型波浪变化形态,地区间差距仍是导致重庆市农地非农化水平空间非均衡形成的主因;重庆市农地非农化水平空间非均衡形成机理存在显著分区差异,农地非农化水平受控于多种复杂因素,要素禀赋、经济发展水平、社会发展状况及政策制度环境分别是影响研究区农地非农化水平空间分异的基础条件、内在动力、中坚力量和外在条件;影响不同区域农地非农化水平的主导因素具有显著差异性。综合以上结论:由于研究区农地非农化水平空间非均衡特征明显,并受多因素影响,且各因素对不同区域农地非农化水平的决定作用差异明显,所以开展不同区域农地非农化水平空间非均衡及形成机理研究对于农地非农化管控十分重要。 . 为探寻农地非农化水平空间非均衡及形成机理,确定影响因素对重庆市及所属不同区域农地非农化水平的决定力。研究基于交叉学科视角,利用1997—2013年重庆及所属37个区县(不含渝中区)面板数据,运用Dagum基尼系数和地理探测器模型分析重庆市农地非农化水平的空间非均衡及形成机理。结果表明:重庆市农地非农化水平的时空动态地域性差异特征明显,呈现以区域Ⅰ为中心,区域Ⅱ为中心拓展区,区域Ⅲ和Ⅳ为外围的"中心—外围"空间分异格局;重庆市农地非农化水平空间分布表现出高度非均衡特征,其空间非均衡程度在研究时段内呈现出明显的"W"型波浪变化形态,地区间差距仍是导致重庆市农地非农化水平空间非均衡形成的主因;重庆市农地非农化水平空间非均衡形成机理存在显著分区差异,农地非农化水平受控于多种复杂因素,要素禀赋、经济发展水平、社会发展状况及政策制度环境分别是影响研究区农地非农化水平空间分异的基础条件、内在动力、中坚力量和外在条件;影响不同区域农地非农化水平的主导因素具有显著差异性。综合以上结论:由于研究区农地非农化水平空间非均衡特征明显,并受多因素影响,且各因素对不同区域农地非农化水平的决定作用差异明显,所以开展不同区域农地非农化水平空间非均衡及形成机理研究对于农地非农化管控十分重要。 |
| [42] | 2000年以来,中国的老龄化进程加快,人口老龄化已经成为中国社会经济发展必须面对的新常态与核心问题之一.本文从县域尺度出发,基于2000和2010年的人口普查数据,应用标准差椭圆、地理探测器等方法,分析了10年间中国2283个县域单元人口老龄化的空间分布、区域差异及其影响因素.结果表明:①人口老龄化空间分布模式多样,胡焕庸线西北半壁以均质化、轴带特征为主;而胡焕庸线东南半壁则呈现出核心—外围的分布特征.②2000-2010年间,人口老龄化均值从6.7%增至8.7%,表明中国县域全面进入老年型社会,步入老年型的县域多集中于内陆、东北地区、丝绸之路经济带沿线区;10年间人口老龄化总体空间格局较为稳定,但人口老龄化的变动趋势差异显著.③人口老龄化在“胡焕庸线”两侧、不同地域类型间、城乡间、民族自治地区与非民族自治地区间、贫困与非贫困地区间存在差异,且差异变动的方向并不一致.④影响人口老龄化的核心因素为各区域往期人口年龄结构、步入老年序列人口比重、人口流出的比例等. . 2000年以来,中国的老龄化进程加快,人口老龄化已经成为中国社会经济发展必须面对的新常态与核心问题之一.本文从县域尺度出发,基于2000和2010年的人口普查数据,应用标准差椭圆、地理探测器等方法,分析了10年间中国2283个县域单元人口老龄化的空间分布、区域差异及其影响因素.结果表明:①人口老龄化空间分布模式多样,胡焕庸线西北半壁以均质化、轴带特征为主;而胡焕庸线东南半壁则呈现出核心—外围的分布特征.②2000-2010年间,人口老龄化均值从6.7%增至8.7%,表明中国县域全面进入老年型社会,步入老年型的县域多集中于内陆、东北地区、丝绸之路经济带沿线区;10年间人口老龄化总体空间格局较为稳定,但人口老龄化的变动趋势差异显著.③人口老龄化在“胡焕庸线”两侧、不同地域类型间、城乡间、民族自治地区与非民族自治地区间、贫困与非贫困地区间存在差异,且差异变动的方向并不一致.④影响人口老龄化的核心因素为各区域往期人口年龄结构、步入老年序列人口比重、人口流出的比例等. |
| [43] | 为加强对湖北省土地整治新增耕地数量时空格局的认识,以2001-2010年批复实施的土地整治项目为基础,以县域为研究单元,运用区位基尼系数、地理集中度和地理探测器模型等研究方法,分析了全省土地整治新增耕地数量的时空差异及其影响因素。结果表明:随着城镇化的快速发展和土地整治资金、技术的持续投入,2001-2010年湖北省土地整治新增耕地总量呈显著增长趋势,地理分布上表现为高度集聚;2001-2010年县域新增耕地数量具有明显的地域差异性,其地理重心呈现了由西向东、由南向北偏移的运动轨迹;县域新增耕地来源结构以整理来源型、开发-整理来源型和综合来源型为主,区域差异特征明显,鄂西南山地区、鄂中平原区和鄂东丘陵区的新增耕地主要为整理来源型,鄂北岗地区主要为开发-整理来源型,鄂西北山地区以及黄石、随州、孝感等地多为综合来源型;2010年县域新增耕地数量空间格局的主要影响因子及其影响力为耕地面积(24.26%)、地貌类型(23.65%)、项目投资(19.94%)、建设规模(18.16%)和人均GDP(11.05%),自然条件和土地整治政策为主要影响要素,社会经济要素对2010年新增耕地数量空间分异的影响偏小。该研究为湖北省土地整治战略制定和重大工程布局安排提供科学依据。 . 为加强对湖北省土地整治新增耕地数量时空格局的认识,以2001-2010年批复实施的土地整治项目为基础,以县域为研究单元,运用区位基尼系数、地理集中度和地理探测器模型等研究方法,分析了全省土地整治新增耕地数量的时空差异及其影响因素。结果表明:随着城镇化的快速发展和土地整治资金、技术的持续投入,2001-2010年湖北省土地整治新增耕地总量呈显著增长趋势,地理分布上表现为高度集聚;2001-2010年县域新增耕地数量具有明显的地域差异性,其地理重心呈现了由西向东、由南向北偏移的运动轨迹;县域新增耕地来源结构以整理来源型、开发-整理来源型和综合来源型为主,区域差异特征明显,鄂西南山地区、鄂中平原区和鄂东丘陵区的新增耕地主要为整理来源型,鄂北岗地区主要为开发-整理来源型,鄂西北山地区以及黄石、随州、孝感等地多为综合来源型;2010年县域新增耕地数量空间格局的主要影响因子及其影响力为耕地面积(24.26%)、地貌类型(23.65%)、项目投资(19.94%)、建设规模(18.16%)和人均GDP(11.05%),自然条件和土地整治政策为主要影响要素,社会经济要素对2010年新增耕地数量空间分异的影响偏小。该研究为湖北省土地整治战略制定和重大工程布局安排提供科学依据。 |
| [44] | 以甘肃省各县域作为研究单元,首先利用ArcGIS软件中的自然 断点分级法,对其县域差异演化过程进行分析.其次采用变异系数、威廉森系数、最大最小系数,分析甘肃省各地区县域城镇化地域差异特征.最后利用地理探测器 模型对县域城镇化地域分异成因进行分析.研究表明:(1)甘肃省各地区县域城镇化仍存在一定的差距,东西差距明显,而中部地区除兰州、白银地区城镇化进程 突出外,其他地区发展缓慢.(2)各地区内部县域城镇化差异特征不尽相同,陇中地区主要表现为空间集聚和基础设施建设差异较大;河西地区主要表现为经济增 长和社会发展差异大,南部地区城镇化率普遍偏低,内部差异不大.(3)各地区城镇化进程差异实质机理并不相同,除陇东地区受到基础设施建设的影响最为突出 外,其他地区都显示为受经济增长及社会发展影响最大. . 以甘肃省各县域作为研究单元,首先利用ArcGIS软件中的自然 断点分级法,对其县域差异演化过程进行分析.其次采用变异系数、威廉森系数、最大最小系数,分析甘肃省各地区县域城镇化地域差异特征.最后利用地理探测器 模型对县域城镇化地域分异成因进行分析.研究表明:(1)甘肃省各地区县域城镇化仍存在一定的差距,东西差距明显,而中部地区除兰州、白银地区城镇化进程 突出外,其他地区发展缓慢.(2)各地区内部县域城镇化差异特征不尽相同,陇中地区主要表现为空间集聚和基础设施建设差异较大;河西地区主要表现为经济增 长和社会发展差异大,南部地区城镇化率普遍偏低,内部差异不大.(3)各地区城镇化进程差异实质机理并不相同,除陇东地区受到基础设施建设的影响最为突出 外,其他地区都显示为受经济增长及社会发展影响最大. |
| [45] | 科学辨识农村居民点演变特征及其空间指向性机理,将丰富乡村地理学及村庄规划学科的研究内容。以农村居民点用地矢量数据为基础,集成格网统计、地理探测器和Logistic回归等研究方法,定量识别环渤海地区农村居民点时空地域格局及空间指向性特征。主要结论如下:1农村聚落密度和分散程度自东北向西南逐渐增加,传统农区乡村聚落密度较高。2黄淮海、鲁南等传统农区,大多农民处于"城乡双漂"的生计状态,助推农村聚落用地持续扩张,在5 km×5 km网格单元内,农村居民点用地面积多数超过3 km2。3中心地城市的持续外扩,外围农村居民点用地类型随之转变消失。4农村聚落的空间分布呈现出一定的交通指向、中心地指向、耕地资源禀赋指向、环境宜居地域指向等指向性特征。 . 科学辨识农村居民点演变特征及其空间指向性机理,将丰富乡村地理学及村庄规划学科的研究内容。以农村居民点用地矢量数据为基础,集成格网统计、地理探测器和Logistic回归等研究方法,定量识别环渤海地区农村居民点时空地域格局及空间指向性特征。主要结论如下:1农村聚落密度和分散程度自东北向西南逐渐增加,传统农区乡村聚落密度较高。2黄淮海、鲁南等传统农区,大多农民处于"城乡双漂"的生计状态,助推农村聚落用地持续扩张,在5 km×5 km网格单元内,农村居民点用地面积多数超过3 km2。3中心地城市的持续外扩,外围农村居民点用地类型随之转变消失。4农村聚落的空间分布呈现出一定的交通指向、中心地指向、耕地资源禀赋指向、环境宜居地域指向等指向性特征。 |
| [46] | On 12 May, 2008, a devastating earthquake registering 8.0 on the Richter scale occurred in Sichuan Province, China, taking tens of thousands of lives and destroying the homes of millions of people. Many of the deceased were children, particular children less than five years old who were more vulnerable to such a huge disaster than the adult. In order to obtain information specifically relevant to further researches and future preventive measures, potential risk factors associated with earthquake-related child mortality need to be identified. We used four geographical detectors (risk detector, factor detector, ecological detector, and interaction detector) based on spatial variation analysis of some potential factors to assess their effects on the under-five mortality. It was found that three factors are responsible for child mortality: earthquake intensity, collapsed house, and slope. The study, despite some limitations, has important implications for both researchers and policy makers. |
| [47] | Hand, foot and mouth disease (HFMD) is a common infectious disease, causing thousands of deaths among children in China over the past two decades. Environmental risk factors such as meteorological factors, population factors and economic factors may affect the incidence of HFMD. In the current paper, we used a novel model-geographical detector technique to analyze the effect of these factors on the incidence of HFMD in China. We collected HFMD cases from 2,309 counties during May 2008 in China. The monthly cumulative incidence of HFMD was calculated for children aged 0-9 years. Potential risk factors included meteorological factors, economic factors, and population density factors. Four geographical detectors (risk detector, factor detector, ecological detector, and interaction detector) were used to analyze the effects of some potential risk factors on the incidence of HFMD in China. We found that tertiary industry and children exert more influence than first industry and middle school students on the incidence of HFMD. The interactive effect of any two risk factors increases the hazard for HFMD transmission. |
| [48] | Abstract Background: Neural tube defects (NTDs) are congenital birth defects that occur in the central nervous system, and they have the highest incidence among all birth defects. Shanxi Province in China has the world's highest rate of NTDs. Since the 1990s, China's government has worked on many birth defect prevention programs to reduce the occurrence of NTDs, such as pregnancy planning, health education, genetic counseling, antenatal ultrasonography and serological screening. However, the rate of NTDs in Shanxi Province is still higher than the world's average morbidity rate after intervention. In addition, Shanxi Province has abundant coal reserves, and is the largest coal production province in China. The objectives of this study are to determine the temporal and spatial variation of the NTD rate in rural areas of Shanxi Province, China, and identify geographical environmental factors that were associated with NTDs in the risk area. Methods: In this study, Heshun County and Yuanping County in Shanxi Province, which have high incidence of NTDs, were selected as the study areas. Two paired sample T test was used to analyze the changes in the risk of NTDs from the time dimension. Ripley's k function and spatial filtering were combined with geographic information system (GIS) software to study the changes in the risk of NTDs from the spatial dimension. In addition, geographical detectors were used to identify the risk geographical environmental factors of NTDs in the study areas, especially the areas close to the coal sites and main roads. Results: In both Heshun County and Yuanping County, the incidence of NTDs was significantly (P<0.05) reduced after intervention. The results from spatial analysis showed that significant spatial heterogeneity existed in both counties. NTD clusters were still identified in areas close to coal sites and main roads after interventions. This study also revealed that the elevation, fault and soil types always had a larger influence on the incidence of NTDs in our study areas. In addition, distance to the river was a risk factor of NTDs in areas close to the coal sites and main roads. Conclusion: The existing interventions may have played an important role to reduce the incidence of NTDs. However, there is still spatial heterogeneity in both counties after using the traditional intervention methods. The government needs to take more measures to strengthen the environmental restoration to prevent the occurrence of NTDs, especially those areas close to coal sites and main roads. The outcome of this research provides an important theoretical basis and technical support for the government to prevent the occurrence of NTDs. |
| [49] | Abstract During the formulation of employment disability policy, policymakers are often interested in regional variations of disability employment. Decision-makers are required to distinguish between various geographical factors. However, few previous studies take spatial heterogeneity into account and most of them conducted only a qualitative analysis. Geographical detectors based on spatial variation analyses of identified factors were applied in the study to establish connections between regional features and the disability employment rate, and to identify the city groups with significantly higher and lower percentage rates of disability employment. It is the first application of spatial statistics in studying the employment problem of the disabled. The findings can help the government formulate reasonable adjustments to both job opportunities for, and work roles of, disabled people. |
| [50] | Background Typhoid and paratyphoid fever are endemic in Hongta District and their prevalence, at 113 per 100,000 individuals, remains the highest in China. However, the exact sources of the disease and its main epidemiological characteristics have not yet been clearly identified. Methods and Findings Numbers of typhoid and paratyphoid cases per day during the period 2006 to 2010 were obtained from the Chinese Center of Disease Control (CDC). A number of suspected disease determinants (or their proxies), were considered for use in spatiotemporal analysis: these included locations of discharge canals and food markets, as well as socio-economic and environmental factors. Results showed that disease prevalence was spatially clustered with clusters decreasing with increasing distance from markets and discharge canals. More than half of the spatial variance could be explained by a combination of economic conditions and availability of health facilities. Temporal prevalence fluctuations were positively associated with the monthly precipitation series. Polluted hospital and residential wastewater was being discharged into rainwater canals. Salmonella bacteria were found in canal water, on farmland and on vegetables sold in markets. Conclusion Disease transmission in Hongta district is driven principally by two spatiotemporally coupled cycles: one involving seasonal variations and the other the distribution of polluted farmland (where vegetables are grown and sold in markets). Disease transmission was exacerbated by the fact that rainwater canals were being used for disposal of polluted waste from hospitals and residential areas. Social factors and their interactions also played a significant role in disease transmission. |
| [51] | 以广州市主城区为研究区,着眼于街道等微观尺度,首先通过实地调查分析法、核密度分析法、标准差椭圆法,探究登革热时空传播特征;其次结合交叉相关性分析法与地理探测器,分析温度、湿度、气压、用地类型对登革热传播的影响,讨论了不同用地类型交互作用与登革热扩散的关系。研究表明:1)登革热时空传播具明显的阶段性特征,多发生于居住环境较差、人口密度较高的区域,并快速向外扩散;2)登革热发展初期,以输入型病例为主;3)环境较差、老年人口众多、人员构成复杂、交通便捷的老城区是登革热高爆发风险区域;4)温度、湿度、气压对登革热传播存在显著滞后性影响关系,温度、湿度与登革热传播呈正相关关系,气压与登革热传播呈负相关关系;5)居民人口分布与登革热传播关系最为密切,池塘、农田、草地、公共绿地交互地区会增加登革热传播风险。 . 以广州市主城区为研究区,着眼于街道等微观尺度,首先通过实地调查分析法、核密度分析法、标准差椭圆法,探究登革热时空传播特征;其次结合交叉相关性分析法与地理探测器,分析温度、湿度、气压、用地类型对登革热传播的影响,讨论了不同用地类型交互作用与登革热扩散的关系。研究表明:1)登革热时空传播具明显的阶段性特征,多发生于居住环境较差、人口密度较高的区域,并快速向外扩散;2)登革热发展初期,以输入型病例为主;3)环境较差、老年人口众多、人员构成复杂、交通便捷的老城区是登革热高爆发风险区域;4)温度、湿度、气压对登革热传播存在显著滞后性影响关系,温度、湿度与登革热传播呈正相关关系,气压与登革热传播呈负相关关系;5)居民人口分布与登革热传播关系最为密切,池塘、农田、草地、公共绿地交互地区会增加登革热传播风险。 |
| [52] | 以广州市2014年登革热疫情早期11周内679个登革热病例数据为例,提出了一种基于扩展Knox检验的疾病时空传播网络模型,研究登革热疫情早期时空传播特征.首先,应用扩展Knox检验方法发现2周1km内、1周5~7 km两个时空标度下,病例之间具有显著的时空交互特征;其次,提取两个时空标度下的病例点对,分别构造时空近邻传播(STAT)网络和日常移动传播(HDMT)网络;最后,对STAT和HDMT传播网络的同配性、空间特征、网络中心位置进行对比分析.结果显示,广州市登革热传播是空间近邻交叉传播和空间扩散传播的混合传播模式;利用STAT网络亲近中心度标识出的“爆发中心”与病例空间核密度中心基本重合,HDMT网络中介中心度标识出的“扩散中枢”多位于城市快速交通干线附近. . 以广州市2014年登革热疫情早期11周内679个登革热病例数据为例,提出了一种基于扩展Knox检验的疾病时空传播网络模型,研究登革热疫情早期时空传播特征.首先,应用扩展Knox检验方法发现2周1km内、1周5~7 km两个时空标度下,病例之间具有显著的时空交互特征;其次,提取两个时空标度下的病例点对,分别构造时空近邻传播(STAT)网络和日常移动传播(HDMT)网络;最后,对STAT和HDMT传播网络的同配性、空间特征、网络中心位置进行对比分析.结果显示,广州市登革热传播是空间近邻交叉传播和空间扩散传播的混合传播模式;利用STAT网络亲近中心度标识出的“爆发中心”与病例空间核密度中心基本重合,HDMT网络中介中心度标识出的“扩散中枢”多位于城市快速交通干线附近. |
| [53] | 为科学辨识盐池北部风沙区乡村聚落演变特征及其影响因素,该文基于2005年及2012年土地利用数据提取乡村聚落,运用空间韵律指数、空间统计测度模型、GIS热点制图及地理探测器模型等来定量展现乡村聚落的规模、布局及形态的演变特征,探索自然地形、区位条件及社会经济发展水平因素对乡村聚落格局分异的影响力。研究结果表明:盐池北部风沙区乡村聚落规模整体缩减,集约用地程度提高,斑块形态趋向简单规则发展,聚落分布重心朝东南方向迁移;乡村聚落空间集聚程度进一步加强,分布密度呈'中密外疏'的空间特征;聚落规模'热点'区布局基本未变,而'冷点'区表现出了明显的轮换特征。近8 a期间,乡村聚落分布逐渐向草地、林地靠拢,且远离沙源,乡村聚落的变迁映射出沙区人地关系趋于缓和,人类活动正在以积极的方式逐渐优化沙区的生态人居环境。基于1 km×1 km网格单元进行的地理探测器分析表明研究区乡村聚落空间布局分异主要受区位条件和自然地形的影响,其中区位条件影响作用力最显著,主要表现为离农业灌区距离、离沙源距离、城镇临近度3个指标,而社会经济发展水平对其影响力不显著。该研究可为沙区乡村聚落的空间布局优化与调控、新农村建设规划及沙区聚落人居环境改善提供决策参考。 . 为科学辨识盐池北部风沙区乡村聚落演变特征及其影响因素,该文基于2005年及2012年土地利用数据提取乡村聚落,运用空间韵律指数、空间统计测度模型、GIS热点制图及地理探测器模型等来定量展现乡村聚落的规模、布局及形态的演变特征,探索自然地形、区位条件及社会经济发展水平因素对乡村聚落格局分异的影响力。研究结果表明:盐池北部风沙区乡村聚落规模整体缩减,集约用地程度提高,斑块形态趋向简单规则发展,聚落分布重心朝东南方向迁移;乡村聚落空间集聚程度进一步加强,分布密度呈'中密外疏'的空间特征;聚落规模'热点'区布局基本未变,而'冷点'区表现出了明显的轮换特征。近8 a期间,乡村聚落分布逐渐向草地、林地靠拢,且远离沙源,乡村聚落的变迁映射出沙区人地关系趋于缓和,人类活动正在以积极的方式逐渐优化沙区的生态人居环境。基于1 km×1 km网格单元进行的地理探测器分析表明研究区乡村聚落空间布局分异主要受区位条件和自然地形的影响,其中区位条件影响作用力最显著,主要表现为离农业灌区距离、离沙源距离、城镇临近度3个指标,而社会经济发展水平对其影响力不显著。该研究可为沙区乡村聚落的空间布局优化与调控、新农村建设规划及沙区聚落人居环境改善提供决策参考。 |
| [54] | 经典统计学处理公共卫生数据空间属性数据的能力不足,空间统计学具有优势,由此得到广泛应用.目前空间统计学在公共卫生领域主要应用有:疾病制图、分布格局探测、空间相互关系分析、病因分析以及时空预警等方面. . 经典统计学处理公共卫生数据空间属性数据的能力不足,空间统计学具有优势,由此得到广泛应用.目前空间统计学在公共卫生领域主要应用有:疾病制图、分布格局探测、空间相互关系分析、病因分析以及时空预警等方面. |
| [55] | Resource-based cities face unique challenges when undergoing urban transitions because their non-renewable resources will eventually be exhausted. In this article, we introduce a new method of evaluating the urban transition performance of resource-based cities from economic, social and eco-environmental perspectives. A total of 19 resource-based cities in Northeast China are studied from 2003 to 2012. The results show that resource-based cities in Jilin and Liaoning provinces performed better than those in Heilongjiang province. Liaoyuan, Songyuan and Baishan were ranked as the top three resource-based cities; and Jixi, Yichun and Heihe were ranked last. Multi-resource and petroleum resource-based cities performed better than coal and forestry resource-based cities. We also analyzed the factors influencing urban transition performance using the method of the geographic detector. We found that capital input, road density and location advantage had the greatest effects on urban transition performance, followed by urban scale, remaining resources and the level of sustainable development; supporting policies and labor input had the smallest effects. Based on these insights, we have formulated several recommendations to facilitate urban transitions in China鈥檚 resource-based cities. |
| [56] | 建设国家级经济技术开发区(经开区)是中国扩大对外开放和促进区 域发展的重要政策.历经30年多发展,国家级经开区已遍布全国,其个体间的发展差异也由于不同的动力机制而日趋显著.认识和探讨国家级经开区经济增长率的 空间分异及其核心影响因素,对因地制宜制定发展策略、引导开发区高效发展具有重要意义.运用变异系数和地理探测器方法,分析2010年国家级经开区经济增 长率的空间分异,并探测了其核心影响因素.结果表明:①总体上,国家级经开区经济增长率在东中西三大区差异显著,呈现出高低高的U型格局;②个体上,国家 级经开区经济增长率在三大区内部存在不同分异特征,其中西部分异度最大、东部次之、中部最小;③探测因子决定力显示,主导三大地区国家级经开区经济增长率 的核心要素明显不同;在所选出的5大核心影响因素中,中西东三大区呈现出由开发区内在因子主导向城市和区域性外在因子主导的转变趋势;④国家级经开区经济 增长率及核心影响因素在三大区间的分异特征,一定程度上反映了开发区生命周期阶段性的演变规律.由此建议:近期内,中西部国家级经开区仍应聚焦于改进其自 身发展要素;而从长远看,城市性和区域性的外部因子对经开区的影响将变得日益重要,亦即是经开区的未来发展将越来越依赖于与其所在城市和区域的有效融合. . 建设国家级经济技术开发区(经开区)是中国扩大对外开放和促进区 域发展的重要政策.历经30年多发展,国家级经开区已遍布全国,其个体间的发展差异也由于不同的动力机制而日趋显著.认识和探讨国家级经开区经济增长率的 空间分异及其核心影响因素,对因地制宜制定发展策略、引导开发区高效发展具有重要意义.运用变异系数和地理探测器方法,分析2010年国家级经开区经济增 长率的空间分异,并探测了其核心影响因素.结果表明:①总体上,国家级经开区经济增长率在东中西三大区差异显著,呈现出高低高的U型格局;②个体上,国家 级经开区经济增长率在三大区内部存在不同分异特征,其中西部分异度最大、东部次之、中部最小;③探测因子决定力显示,主导三大地区国家级经开区经济增长率 的核心要素明显不同;在所选出的5大核心影响因素中,中西东三大区呈现出由开发区内在因子主导向城市和区域性外在因子主导的转变趋势;④国家级经开区经济 增长率及核心影响因素在三大区间的分异特征,一定程度上反映了开发区生命周期阶段性的演变规律.由此建议:近期内,中西部国家级经开区仍应聚焦于改进其自 身发展要素;而从长远看,城市性和区域性的外部因子对经开区的影响将变得日益重要,亦即是经开区的未来发展将越来越依赖于与其所在城市和区域的有效融合. |
| [57] | 综合运用样带、空间分析、地理探测器等方法分析1997--2010年江西省县域单元人均粮食占有量的时空格局演变及其形成机理。江西省县域人均粮食占有量空间集聚特征明显,呈较明显的圈层分布;全省大部分县域为余粮区,过半数的县域人均粮食有所提高,主要集中于赣中平原和赣北鄱阳湖周边地区。江西省县域人均粮食的空间格局主要受1997年人均粮食占有量与人均耕地面积的影响,仍对农业生产地理基础表现出较大的依赖,粮食政策、市场价格等对区域粮食生产亦有一定影响。样带趋势分析显示14年来全省县域人均粮食的东西向变化较南北向大;样带地理探测分析则有助于深入认识不同农业生产自然条件、不同经济发展水平等县域人均粮食驱动机制的差异。 . 综合运用样带、空间分析、地理探测器等方法分析1997--2010年江西省县域单元人均粮食占有量的时空格局演变及其形成机理。江西省县域人均粮食占有量空间集聚特征明显,呈较明显的圈层分布;全省大部分县域为余粮区,过半数的县域人均粮食有所提高,主要集中于赣中平原和赣北鄱阳湖周边地区。江西省县域人均粮食的空间格局主要受1997年人均粮食占有量与人均耕地面积的影响,仍对农业生产地理基础表现出较大的依赖,粮食政策、市场价格等对区域粮食生产亦有一定影响。样带趋势分析显示14年来全省县域人均粮食的东西向变化较南北向大;样带地理探测分析则有助于深入认识不同农业生产自然条件、不同经济发展水平等县域人均粮食驱动机制的差异。 |
| [58] | 以2014年中国2872个县级单元的住宅平均单价为基本数据,通过空间自相关和核密度函数分析中国住宅价格的差异格局、空间关联特征和分布形态,构建"住宅价格等级金字塔";根据"需求+供给+市场"的三维理论视角建立包括5大住宅价格差异影响因素在内的价格模型,采用地理探测器分析全国及其区域子市场的影响因素强度差异,并探索其影响机制。结果表明:①中国区域住宅价格呈现以行政等级性为主、空间集聚性为辅的双重差异格局,其空间关联与集聚性显著;②中国住宅价格呈现出房价越高,区域越少,所居住城镇人口越少的"金字塔式"等级分布特征。③租房户比例、流动人口规模、住房支付能力、住房市场活跃度、土地成本是中国住宅价格差异的5个核心影响因素,不同行政等级子市场的影响因素作用强度各异。 . 以2014年中国2872个县级单元的住宅平均单价为基本数据,通过空间自相关和核密度函数分析中国住宅价格的差异格局、空间关联特征和分布形态,构建"住宅价格等级金字塔";根据"需求+供给+市场"的三维理论视角建立包括5大住宅价格差异影响因素在内的价格模型,采用地理探测器分析全国及其区域子市场的影响因素强度差异,并探索其影响机制。结果表明:①中国区域住宅价格呈现以行政等级性为主、空间集聚性为辅的双重差异格局,其空间关联与集聚性显著;②中国住宅价格呈现出房价越高,区域越少,所居住城镇人口越少的"金字塔式"等级分布特征。③租房户比例、流动人口规模、住房支付能力、住房市场活跃度、土地成本是中国住宅价格差异的5个核心影响因素,不同行政等级子市场的影响因素作用强度各异。 |
| [59] | 城市化是全球范围内普遍存在的重要现象,尤其发展中国家和地区正经历着快速城市化的过程。快速城市化导致了城市地区的大规模扩张,从而加重了土地资源的压力,带来了一系列的环境和社会问题。定量分析城镇扩展的空间驱动力能更好地辅助城市规划与管理。本文提出了一种量化城镇扩展的指数———城镇扩展密度,并通过地理探测器方法分析了1990—2000年北京市城镇扩展的时空特征及形成机理。研究表明:北京市城镇扩展沿交通干线呈线性扩张,其城镇扩展受到社会经济和地理的共同影响和制约作用,城镇固定资产投资对城镇扩展影响力最大,区域条件次之。这些发现可以为城镇扩展模拟和预测提供更好的改进空间。 . 城市化是全球范围内普遍存在的重要现象,尤其发展中国家和地区正经历着快速城市化的过程。快速城市化导致了城市地区的大规模扩张,从而加重了土地资源的压力,带来了一系列的环境和社会问题。定量分析城镇扩展的空间驱动力能更好地辅助城市规划与管理。本文提出了一种量化城镇扩展的指数———城镇扩展密度,并通过地理探测器方法分析了1990—2000年北京市城镇扩展的时空特征及形成机理。研究表明:北京市城镇扩展沿交通干线呈线性扩张,其城镇扩展受到社会经济和地理的共同影响和制约作用,城镇固定资产投资对城镇扩展影响力最大,区域条件次之。这些发现可以为城镇扩展模拟和预测提供更好的改进空间。 |
| [60] | 本文运用空间自相关分析方法,分析了我国2002-2012年产业结构升级水平时空格局演化,并就对外直接投资与产业结构升级水平进行了研究。结果表明:近十年,我国不同区域的产业结构升级水平差异趋于均衡;我国产业结构升级水平核心区域逐渐显现,上海、江苏已经成为我国产业结构升级水平的核心区域;对外直接投资是我国产业结构升级水平的主要因素之一,两者存在高度的相关性。此外,我国产业结构升级水平还受多种因素的影响,不同时期不同要素对产业结构升级水平的影响力存在差异。 . 本文运用空间自相关分析方法,分析了我国2002-2012年产业结构升级水平时空格局演化,并就对外直接投资与产业结构升级水平进行了研究。结果表明:近十年,我国不同区域的产业结构升级水平差异趋于均衡;我国产业结构升级水平核心区域逐渐显现,上海、江苏已经成为我国产业结构升级水平的核心区域;对外直接投资是我国产业结构升级水平的主要因素之一,两者存在高度的相关性。此外,我国产业结构升级水平还受多种因素的影响,不同时期不同要素对产业结构升级水平的影响力存在差异。 |
| [61] | . 文章采用产业结构层次系数作为衡量我国产业结构升级水平指标,运用空间自相关分析方法,分析了我国2002-2012年产业结构升级水平时空格局演化,并就对外直接投资与产业结构升级水平进行了研究。结果表明:近10年,我国不同区域的产业结构升级水平差异趋于均衡;我国区域产业结构升级水平存在显著的空间正相关性;对外直接投资是我国产业结构升级水平的主要因素之一,两者存在高度的相关性。此外,我国产业结构升级水平还受能源、资本、劳动力、消费水平、技术进步、国际贸易、经济发展水平等多种因素的影响,不同时期不同要素对产业结构升级水平的影响力存在差异。 . 文章采用产业结构层次系数作为衡量我国产业结构升级水平指标,运用空间自相关分析方法,分析了我国2002-2012年产业结构升级水平时空格局演化,并就对外直接投资与产业结构升级水平进行了研究。结果表明:近10年,我国不同区域的产业结构升级水平差异趋于均衡;我国区域产业结构升级水平存在显著的空间正相关性;对外直接投资是我国产业结构升级水平的主要因素之一,两者存在高度的相关性。此外,我国产业结构升级水平还受能源、资本、劳动力、消费水平、技术进步、国际贸易、经济发展水平等多种因素的影响,不同时期不同要素对产业结构升级水平的影响力存在差异。 |
| [62] | 以中国电子地图数据和分县经济社会数据为基础,利用最邻近距离R指数模型分析中国村庄分布模式格局,结合地理探测器的研究方法对影响因素进行探测识别,同时解析乡村空间优化重组背景和模式。研究得出以下主要结论:①中国村庄空间分布呈现出聚集、随机、离散均匀分布的并存空间分布模式,村庄空间分布模式区域差异特征显著。东南半壁的村庄分布密度远大于西北半壁,不同地域类型区的村庄空间分布模式表现出各异的特征。平原地区的村庄空间分布密集,空间分布模式以随机、分散为主,村庄之间邻近距离较近。高寒山区、沙漠边缘地带,村庄空间分布密度极低,村庄之间邻近距离偏大,村庄空间分布相对聚集。丘陵、山地交汇过渡地带,村庄空间分布密度较大,空间分布模式偏向随机分布。②村庄分布受到传统因素和经济发展双重因子的影响,传统影响因素依然在发挥作用,但经济发展的影响愈加明显。不同区域地形、水资源条件对村庄分布影响显著。交通条件、产业非农化、经济发展、农业现代化发展对乡村生活、生产空间的空间形态和分布模式产生剧烈影响。③伴随乡村各种生产要素非农化流失,村庄空间亟待优化重组,优化以镇区为依托的中心村-基层村体系空间组织结构应为乡村物质空间优化重组有效选择。④在不同地域类型区域,村镇格局的空间优化重组形态可以采用放射均衡、放射非均衡、多核心均衡、走廊式布局模式及混合模式。 . 以中国电子地图数据和分县经济社会数据为基础,利用最邻近距离R指数模型分析中国村庄分布模式格局,结合地理探测器的研究方法对影响因素进行探测识别,同时解析乡村空间优化重组背景和模式。研究得出以下主要结论:①中国村庄空间分布呈现出聚集、随机、离散均匀分布的并存空间分布模式,村庄空间分布模式区域差异特征显著。东南半壁的村庄分布密度远大于西北半壁,不同地域类型区的村庄空间分布模式表现出各异的特征。平原地区的村庄空间分布密集,空间分布模式以随机、分散为主,村庄之间邻近距离较近。高寒山区、沙漠边缘地带,村庄空间分布密度极低,村庄之间邻近距离偏大,村庄空间分布相对聚集。丘陵、山地交汇过渡地带,村庄空间分布密度较大,空间分布模式偏向随机分布。②村庄分布受到传统因素和经济发展双重因子的影响,传统影响因素依然在发挥作用,但经济发展的影响愈加明显。不同区域地形、水资源条件对村庄分布影响显著。交通条件、产业非农化、经济发展、农业现代化发展对乡村生活、生产空间的空间形态和分布模式产生剧烈影响。③伴随乡村各种生产要素非农化流失,村庄空间亟待优化重组,优化以镇区为依托的中心村-基层村体系空间组织结构应为乡村物质空间优化重组有效选择。④在不同地域类型区域,村镇格局的空间优化重组形态可以采用放射均衡、放射非均衡、多核心均衡、走廊式布局模式及混合模式。 |
| [63] | |
| [64] | Tourism has emerged as a major driving force in the growth and expansion of rural settlements. After several studies revealed spatial differentiation of touristization among rural settlements, studies were conducted to explain this phenomenon. However, most of these studies explained spatial differentiation of rural touristization in a qualitative way. More robust and detailed quantitative results are needed to evaluate the relative roles of different factors. In this study, which takes Yesanpo tourism as a case study, the Geo-detector method was introduced to evaluate determining factors of rural touristization. Results show that “distance to core entry”, “tourist number and sojourn time”, and “distance to the nearest scenic area” have had a strong effect on the rural touristization in Yesanpo, whereas “distance to river”, “elevation”, “distance to main road”, and “slope” have had a weak influence. The latter did, however, contribute a lot to touristization when interacting with “distance to core entry”, “tourist number and sojourn time”, and “distance to the nearest scenic”, indicating the importance of these four factors. Higher rural touristization occurred in the zone near the core entry, with many tourists, long sojourn times, and proximity to the scenic area. |
| [65] | 城市休闲商务区(RecreationalBusinessDistrict,RBD)作为城市重要的游憩空间,为外来游客和城市居民提供休闲消费的场所,逐渐受到学界和业界重视。目前大多数研究还停留在概念层面,在分类、空间结构、分布规律、分异成因等方面上还缺乏一定的实证和定量研究。结合前人研究经验,重新定义RBD,并依据城市RBD的特征和属性将其分为大型购物中心、休闲商业街、城市休闲区三类。选取1990年、2000年、2014年三个时间截面对北京各类城市RBD点进行统计,采用基尼系数、空间插值、核密度分析、地理探测器等方法,结合ArcGIS软件,对北京城市RBD的时空分布特征和成因进行分析,得出以下结论:①时序上看,北京城市RBD的数量和规模不断增加,增速变快,不同类型的RBD出现不同幅度的空间扩张;②北京城市RBD的空间集聚程度不断加强,不同类型的RBD,存在一定的增幅和增速差异;③北京城市RBD的整体空间结构呈“单核聚集一双核发展一网状扩散”的发展模式;④城市RBD多选址在交通便利、临近旅游景区、居民和游客密度较高、地价相对较高的地区。⑤游客密度对各类型的城市RBD规模均有较大影响;对于不同类型的城市RBD,各因素对其规模的影响也有所不同。 . 城市休闲商务区(RecreationalBusinessDistrict,RBD)作为城市重要的游憩空间,为外来游客和城市居民提供休闲消费的场所,逐渐受到学界和业界重视。目前大多数研究还停留在概念层面,在分类、空间结构、分布规律、分异成因等方面上还缺乏一定的实证和定量研究。结合前人研究经验,重新定义RBD,并依据城市RBD的特征和属性将其分为大型购物中心、休闲商业街、城市休闲区三类。选取1990年、2000年、2014年三个时间截面对北京各类城市RBD点进行统计,采用基尼系数、空间插值、核密度分析、地理探测器等方法,结合ArcGIS软件,对北京城市RBD的时空分布特征和成因进行分析,得出以下结论:①时序上看,北京城市RBD的数量和规模不断增加,增速变快,不同类型的RBD出现不同幅度的空间扩张;②北京城市RBD的空间集聚程度不断加强,不同类型的RBD,存在一定的增幅和增速差异;③北京城市RBD的整体空间结构呈“单核聚集一双核发展一网状扩散”的发展模式;④城市RBD多选址在交通便利、临近旅游景区、居民和游客密度较高、地价相对较高的地区。⑤游客密度对各类型的城市RBD规模均有较大影响;对于不同类型的城市RBD,各因素对其规模的影响也有所不同。 |
| [66] | |
| [67] | 遗址—河流距离是史前聚落遗址人地关系研究的重要内容。本文以河南省卢氏县为例,引入地理探测器模型,采用基于PD,H值计算的连续性地理数据最优离散法,获取遗址—河流相关性定量数值,讨论和总结模型中等间距(EI)、百分位(QV)、自然断点(NB)、几何间隔(GI)4种分类方法,分别在裴李岗时期、仰韶前期、仰韶后期、龙山时期所表现的性能及适用情况;并在此基础上揭示聚落的结构、发展规律、分布和范围规律。研究结果表明:14个文化时期分别采用NB、QV、NB、GI及其分类数分别为8,8,8,6时,为离水距离因子的最优离散。该因子对遗址密度分布的决定力分别为39.5%、70.8%、73.0%和59.8%;2洪水切割作用导致河岸两旁的阶地逐渐崩塌,阶地的面积越来越小,古人类为了赢得更多的生存空间,将遗址沿河散开呈条带装分布。当阶地面积小到一定程度,聚落沿河流长度扩展的成本过高,便开始向远离河流部分扩张,因此离河距离因子呈先升后降;3从Q值提升强度看,NB/EI>GI>QV;从提升效率看,EI/GI>NB>QV;从决定力大小来看,GI>QV/NB>EI;4聚落结构由裴李岗时期的简单、稀疏和松散不断发展,分别在仰韶前、后期和龙山时期出现两极化、三段式,聚落发展影响因素由人口数量增长变为社会内部结构变化,聚落的分布和古人类活动范围距河流约正常人步行1~2.5 h的距离,且不断扩大。 . 遗址—河流距离是史前聚落遗址人地关系研究的重要内容。本文以河南省卢氏县为例,引入地理探测器模型,采用基于PD,H值计算的连续性地理数据最优离散法,获取遗址—河流相关性定量数值,讨论和总结模型中等间距(EI)、百分位(QV)、自然断点(NB)、几何间隔(GI)4种分类方法,分别在裴李岗时期、仰韶前期、仰韶后期、龙山时期所表现的性能及适用情况;并在此基础上揭示聚落的结构、发展规律、分布和范围规律。研究结果表明:14个文化时期分别采用NB、QV、NB、GI及其分类数分别为8,8,8,6时,为离水距离因子的最优离散。该因子对遗址密度分布的决定力分别为39.5%、70.8%、73.0%和59.8%;2洪水切割作用导致河岸两旁的阶地逐渐崩塌,阶地的面积越来越小,古人类为了赢得更多的生存空间,将遗址沿河散开呈条带装分布。当阶地面积小到一定程度,聚落沿河流长度扩展的成本过高,便开始向远离河流部分扩张,因此离河距离因子呈先升后降;3从Q值提升强度看,NB/EI>GI>QV;从提升效率看,EI/GI>NB>QV;从决定力大小来看,GI>QV/NB>EI;4聚落结构由裴李岗时期的简单、稀疏和松散不断发展,分别在仰韶前、后期和龙山时期出现两极化、三段式,聚落发展影响因素由人口数量增长变为社会内部结构变化,聚落的分布和古人类活动范围距河流约正常人步行1~2.5 h的距离,且不断扩大。 |
| [68] | . |
| [69] | Abstract A mean鈥揺xtreme (M-E) vector is defined to combine the changes of climate means and extremes. The direction of the vertical axis represents changes in means, whereas the direction of the horizontal axis represents changes in extremes. Therefore, the M-E vector can clearly reflect both the amplitude and direction of changes in climate means and extremes. Nine types of M-E vectors are defined. They are named as MuEu, MuEd, MuEz, MdEu, MdEd, MdEz, MzEu, MzEd, and MzEz. Here M and E stand for climate means and extremes, respectively, whereas u, d, and z indicate an upward, downward trend and no trend, respectively. Both temperature mean and extremely high temperature days are consistently increased (MuEu) in nearly whole China throughout four seasons. However, the MuEd-type vector dominates in some regions. The MuEd-type vector appears over the Huang Huai river basin in spring, summer and winter. For the M-E vector of temperature mean and extremely low temperature days, the MuEd-type spreads the entire China for all seasons. The M-E vector for precipitation mean and the extreme precipitation days possesses identical trends (MuEu or MdEd) despite of seasons. The MuEu-type dominates in northeastern China and west of 105掳E in spring, northwestern and central/southern China in summer, west of 100掳E and northeastern China in autumn, and nearly whole China in winter. Precipitation mean and extreme precipitation days are all decreased (MdEd) in the rest of China for all reasons. The trends relationship in means and extremes over China presented herein could provide a scientific foundation to predict change of extremes using change of mean as the predictor. |
| [70] | 利用地理探测器,结合Arc GIS技术及线性倾向率方法,对东北地区1960-2011年气温变化情况以及影响因素进行定量分析。研究结果表明,1960-2011年东北地区气温线性倾向率介于0.22~0.64℃/10 a之间,气温呈升高趋势,升温幅度由南向北逐渐增大;影响因子贡献量由大到小为植被类型、地貌类型、湿地率、GDP、土壤类型、人口密度、农田率、气候类型、海拔高度、森林率,自然因子影响气温变化的贡献量大于社会因子;因子之间具有交互作用,主要表现为协同作用和非线性协同作用,社会因子增强了自然因子的贡献量,共同导致气温变化。本研究为更加准确认识气温变化的影响因素及制定有效预防气候变化的相关政策提供科学依据。 . 利用地理探测器,结合Arc GIS技术及线性倾向率方法,对东北地区1960-2011年气温变化情况以及影响因素进行定量分析。研究结果表明,1960-2011年东北地区气温线性倾向率介于0.22~0.64℃/10 a之间,气温呈升高趋势,升温幅度由南向北逐渐增大;影响因子贡献量由大到小为植被类型、地貌类型、湿地率、GDP、土壤类型、人口密度、农田率、气候类型、海拔高度、森林率,自然因子影响气温变化的贡献量大于社会因子;因子之间具有交互作用,主要表现为协同作用和非线性协同作用,社会因子增强了自然因子的贡献量,共同导致气温变化。本研究为更加准确认识气温变化的影响因素及制定有效预防气候变化的相关政策提供科学依据。 |
| [71] | 基于遥感和空间分析技术,利用MODIS数据对2000—2014年贵州省煤炭资源开采对植被的影响进行监测分析。采用最大值合成、平均值和一元线性回归分析等方法研究贵州省煤矿区植被变化特征,并运用地理探测器分析高程、坡度、坡向、土壤、多年平均降水量、多年平均气温和煤炭年产量对矿区植被变化的影响。结果表明,贵州省煤矿区NDVI值均大于0.77,整体生长状况较好,但低于全省平均水平,其中大型煤矿植被指数均值明显低于中、小型煤矿;在全省NDVI值处于上升趋势的情况下,大多数矿区(79.22%)植被也处于改善趋势,依然有部分矿区(13.42%)植被呈现退化趋势;全省总体而言,煤炭产量对矿区植被变化的解释力在7个因子中处于第3位,在遵义、毕节和六盘水市,其解释力分别排第4、5和5位,对植被变化解释力最大的是自然环境因子中的降水、土壤和坡度。 . 基于遥感和空间分析技术,利用MODIS数据对2000—2014年贵州省煤炭资源开采对植被的影响进行监测分析。采用最大值合成、平均值和一元线性回归分析等方法研究贵州省煤矿区植被变化特征,并运用地理探测器分析高程、坡度、坡向、土壤、多年平均降水量、多年平均气温和煤炭年产量对矿区植被变化的影响。结果表明,贵州省煤矿区NDVI值均大于0.77,整体生长状况较好,但低于全省平均水平,其中大型煤矿植被指数均值明显低于中、小型煤矿;在全省NDVI值处于上升趋势的情况下,大多数矿区(79.22%)植被也处于改善趋势,依然有部分矿区(13.42%)植被呈现退化趋势;全省总体而言,煤炭产量对矿区植被变化的解释力在7个因子中处于第3位,在遵义、毕节和六盘水市,其解释力分别排第4、5和5位,对植被变化解释力最大的是自然环境因子中的降水、土壤和坡度。 |
| [72] | Abstract Grasshopper plagues have seriously disturbed grassland ecosystems in Inner Mongolia, China. The accurate prediction of grasshopper infestations and control of grasshopper plagues have become urgent needs. We sampled 234, 342, 335, and 369 plots in Xianghuangqi County of Xilingol League in 2010, 2011, 2012, and 2013, respectively, and measured the density of the most dominant grasshopper species, Oedaleus decorus asiaticus , and the latitude, longitude, and associated relatively stable habitat factors at each plot. We used Excel–GeogDetector software to explore the effects of individual habitat factors and the two-factor interactions on grasshopper density. We estimated the membership of each grasshopper density rank and determined the weights of each habitat category. These results were used to construct a model system evaluating grasshopper habitat suitability. The results showed that our evaluation system was reliable and the fuzzy evaluation scores of grasshopper habitat suitability were good indicators of potential occurrence of grasshoppers. The effects of the two-factor interactions on grasshopper density were greater than the effects of any individual factors. O. d. asiaticus was most likely to be found at elevations of 1300–1400 m, flat terrain or slopes of 4–6°, typical chestnut soil with 70–80% sand content in the top 5 cm of soil, and medium-coverage grassland. The species preferred temperate bunchgrass steppe dominated by Stipa krylovii and Cleistogenes squarrosa . These findings may be used to improve models to predict grasshopper occurrence and to develop management guidelines to control grasshopper plagues by changing habitats. |
| [73] | We developed a cellular automaton model for the spatiotemporal dynamics of grasshopper ( Oedaleus decorus asiaticus ) populations with a density of 3–1202ind02m 612 in a typical semiarid steppe. The model simulates grasshopper dynamics within each cell and dispersal between adjacent cells at each time step from the completion of hatching to ovipositing. After the model parameters were obtained or calibrated, the natural growth of grasses (the preferred food of O. d . asiaticus ), and their variation after being fed on by cattle and grasshoppers, were modeled to explore grasshopper–plant interactions. Dispersal rules were formulated by considering the abundance of grasshoppers and grasses and their interactions within both potential source and sink cells, habitat conditions of sink cells, and spatial isolation (or connectedness) between source and sink cells. A case study was conducted at a sample landscape in Xianghuangqi County, Inner Mongolia, China. The temporal variations of the modeled grass biomass and grasshopper density were consistent with actual variations. The modeled densities were within the measured ranges for most of the cells. The estimation accuracy was higher for the 4th and 5th instars than for adults, and was higher for cells with higher initial densities (not lower than 302ind02m 612 ). The modeled results showed that the main factors influencing grasshopper density differed for different instars. During the 2nd and 3rd instar, grasshopper density depended on the number of hatched nymphs and their mortality. During the 4th instar, habitat suitability determined the density threshold that caused grasshoppers to disperse and the potential sink or source cells. This resulted in different density variations between the cells with initial densities >6.002ind02m 612 and those with densities <6.002ind02m 612 . During and after the 5th instar, grasshopper density was very stable due to the slightly decreasing habitat suitability. The modeled results are expected to provide a scientific basis for predicting grasshopper dynamics and controlling grasshopper plagues in heterogeneous spaces. |
| [74] | 动物生境适宜度评价对于野生动物生境保护十分重要。基于物种活动点来建模的生态位模型是目前应用最广泛的动物生境评价方法,但该方法不能直接表达生境适宜度与环境因子间具有生态学意义的数量关系。本文以雅安地区为例,提出一种新的大熊猫(Ailuropoda melanoleuca)生境适宜度评价方法,选取海拔、坡度、坡向、地形指数、距水源距离、植被类型、主食竹及距公路距离8个环境因子,引入地理探测器,在分别基于MAXENT模型和层次分析法(The Analytic Hierarchy Process,AHP)所构建生境适宜度模型的基础上,通过4个地理探测器(风险探测器、因子探测器、生态探测器和交互作用探测器)探寻大熊猫生境与各环境因子间的关系以及环境因子对大熊猫生境的影响机理,并将其预测结果与单一MAXENT模型和AHP法进行对比。结果表明:(1)AHP、AHP-Geogdetector、MAXENT和MAXENT-Geogdetector模型总体评价精度分别为85.6%、86.5%、91.3%和94.2%,kappa系数分别为0.699、0.718、0.821和0.882,AUC值分别为0.902、0.928、0.949和0.966,模型所预测的适宜和较适宜区与实际分布区重叠比分别为63.66%、61.30%、76.70%和90.10%,说明AHP-Geogdetector和MAXENT-Geog-detector模型精度均比相应的单一模型有所提高,且MAXENT-Geogdetector模型精度最高;(2)基于地理探测器的大熊猫生境适宜度评价模型能以“生境适宜度和环境因子间具有生态学意义的数量关系”的形式直接体现环境因子对动物生境利用的生态学作用,具有较好的生态学可解释性。因此,用地理探测器进行大熊猫生境适宜度评价具有较好的可行性。 . 动物生境适宜度评价对于野生动物生境保护十分重要。基于物种活动点来建模的生态位模型是目前应用最广泛的动物生境评价方法,但该方法不能直接表达生境适宜度与环境因子间具有生态学意义的数量关系。本文以雅安地区为例,提出一种新的大熊猫(Ailuropoda melanoleuca)生境适宜度评价方法,选取海拔、坡度、坡向、地形指数、距水源距离、植被类型、主食竹及距公路距离8个环境因子,引入地理探测器,在分别基于MAXENT模型和层次分析法(The Analytic Hierarchy Process,AHP)所构建生境适宜度模型的基础上,通过4个地理探测器(风险探测器、因子探测器、生态探测器和交互作用探测器)探寻大熊猫生境与各环境因子间的关系以及环境因子对大熊猫生境的影响机理,并将其预测结果与单一MAXENT模型和AHP法进行对比。结果表明:(1)AHP、AHP-Geogdetector、MAXENT和MAXENT-Geogdetector模型总体评价精度分别为85.6%、86.5%、91.3%和94.2%,kappa系数分别为0.699、0.718、0.821和0.882,AUC值分别为0.902、0.928、0.949和0.966,模型所预测的适宜和较适宜区与实际分布区重叠比分别为63.66%、61.30%、76.70%和90.10%,说明AHP-Geogdetector和MAXENT-Geog-detector模型精度均比相应的单一模型有所提高,且MAXENT-Geogdetector模型精度最高;(2)基于地理探测器的大熊猫生境适宜度评价模型能以“生境适宜度和环境因子间具有生态学意义的数量关系”的形式直接体现环境因子对动物生境利用的生态学作用,具有较好的生态学可解释性。因此,用地理探测器进行大熊猫生境适宜度评价具有较好的可行性。 |
| [75] | 近年来,由于自然环境、经济社会等因素影响,中国血吸虫病疫情呈回升态势,表现为急性感染人数和血吸虫病患病人数增多,局部地区钉螺扩散明显,感染性钉螺分布范围逐渐扩大等。钉螺是血吸虫的唯一中间宿主,控制钉螺对血吸虫病防治具有重要意义。本文根据钉螺的生态学特征,综合高程、水文、土地利用、土壤、植被等因子,基于地理探测器模型分析了地理环境因子对2009年湖北省钉螺分布的影响。结果表明①在垸内型流行区,整个流行季(3-10月)、特别是7-9月期间的植被覆盖与钉螺分布范围有关,密螺地带的特征为土壤质地粉砂含量适中、黄红壤和淹育水稻土,第一季度有较高的植被覆盖度;②在垸外型流行区,湖泊滩地、高覆盖度草地是其主要分布环境,而第一季度较高的植被覆盖,尤其是荻、芦苇等植被类型是高密度地区的环境特征;③在山地丘陵,河流附近的林地和耕地,潴育或淹育水稻土是钉螺密集分布的环境。筛选出的地理环境指示因子可用于遥感技术监测钉螺孳生地,从而为采取有效的控螺措施提供科学依据。 . 近年来,由于自然环境、经济社会等因素影响,中国血吸虫病疫情呈回升态势,表现为急性感染人数和血吸虫病患病人数增多,局部地区钉螺扩散明显,感染性钉螺分布范围逐渐扩大等。钉螺是血吸虫的唯一中间宿主,控制钉螺对血吸虫病防治具有重要意义。本文根据钉螺的生态学特征,综合高程、水文、土地利用、土壤、植被等因子,基于地理探测器模型分析了地理环境因子对2009年湖北省钉螺分布的影响。结果表明①在垸内型流行区,整个流行季(3-10月)、特别是7-9月期间的植被覆盖与钉螺分布范围有关,密螺地带的特征为土壤质地粉砂含量适中、黄红壤和淹育水稻土,第一季度有较高的植被覆盖度;②在垸外型流行区,湖泊滩地、高覆盖度草地是其主要分布环境,而第一季度较高的植被覆盖,尤其是荻、芦苇等植被类型是高密度地区的环境特征;③在山地丘陵,河流附近的林地和耕地,潴育或淹育水稻土是钉螺密集分布的环境。筛选出的地理环境指示因子可用于遥感技术监测钉螺孳生地,从而为采取有效的控螺措施提供科学依据。 |
| [76] | Arid and semi-arid areas in North China are facing the challenge of a rising aeolian desertification risk (ADR) due to the intertwined effects of complex natural processes and intensified anthropogenic activities. An accurate quantitative assessment of the relationship between ADR and its determinants is beneficial for understanding the driving mechanisms of aeolian desertification and for controlling future desertification. Previous studies have failed to quantify the relative role of determinants driving ADR and have been limited in assessing their interactive impacts. In this study, a spatial variance analysis-based geographical detector methodology is used to quantify the effects of geological, physical, and human factors on the occurrence of ADR in an area characterized by mountains and hills in northern China. It is found that soil type, precipitation, and wind velocity are the major determinants of ADR, which implies that geological and physical elements (e.g., soil attribute) and climatic factors (e.g., precipitation and wind velocity) rather than human activities have played a greater role in the incidence of ADR. Particularly, the results show that the interaction of various determinants causes significant non-linearly enhanced impacts on the ADR. The findings of our study will assist local inhabitants and policy makers in developing measures for wind prevention and sand control to mitigate the effects of desertification in the region. |
| [77] | In environmentally sensitive areas, particularly the arid or semi-arid regions, different factors such as relief and human activity, can greatly influence the landscape on a local scale. Using satellite imageries and field investigations, we have studied the distribution of sand dunes in the Maowusu (Mu Us) Sandy Land in the southern Ordos Plateau, northern China. Key research questions are which factors are critically responsible for the spatial pattern evident in the landscape and what is the relative importance of such factors? We used a new approach, i.e., the Geographical Detector to improve our spatial analysis. Using the combined methods of the Geographical Detector, digital image processing, field investigation and spatial and temporal analysis of the Normalized Difference Vegetation Index (NDVI), we aimed to clarify the causal relations governing the different landform patterns within this Sandy Land and beyond. The primary factors include local relief, drainage, climatically controlled potential plant productivity, wind action and rock type as explanatory parameters x and the landscape properties as the output y . Our results show the quantified links between the spatial distribution of various landscapes and their controlling factors. This study revealed that the climatic potential productivity, local relief and drainage are the key factors in shaping the landscape spatial pattern. Owing to different regional climates and land use histories, the responses to changes of external forcing between the western and eastern parts of the Maowusu Sandy Land are out-of-step. We conclude that the desertification of the eastern part of Maowusu Sandy Land has been mainly caused by human activities while the western part is governed by natural factors. |
| [78] | 城市宜居性是与居民生活质量密切相关的科学议题,深入探讨宜居满意度影响机理对把握转型期北京市居民居住环境需求、促进宜居城市建设等具有重要的现实意义。以北京市为案例,基于2013年宜居城市大规模问卷调查数据,运用因子分析方法提取了北京市居民宜居满意度主要感知因素,并分别从居民宜居感知因素、个体与家庭属性因素两个视角,借助地理探测器方法揭示了北京市居民宜居满意度特征与影响机理。研究发现:1北京市居民宜居满意度主要由污染噪声因子、生活设施因子、人文环境因子、出行便捷因子、自然环境因子、安全环境因子和休闲活动因子等7个维度构成。2宜居满意度受到宜居感知因素和个体与家庭属性共同影响,但宜居感知因素的解释力明显要强,其中污染噪声因子、自然环境因子和出行便捷因子等因素是关键因子。3宜居满意度与宜居感知因素具有相对一致性,且存在个体与家庭属性差异。通常宜居感知因素得分低居民,其宜居满意度也相对较低;另外,远郊区、租赁房、有迁居经历、男性、30~39岁、高中学历、家庭月收入5000元以下和外地户口等社会群体的宜居满意度明显要低。 . 城市宜居性是与居民生活质量密切相关的科学议题,深入探讨宜居满意度影响机理对把握转型期北京市居民居住环境需求、促进宜居城市建设等具有重要的现实意义。以北京市为案例,基于2013年宜居城市大规模问卷调查数据,运用因子分析方法提取了北京市居民宜居满意度主要感知因素,并分别从居民宜居感知因素、个体与家庭属性因素两个视角,借助地理探测器方法揭示了北京市居民宜居满意度特征与影响机理。研究发现:1北京市居民宜居满意度主要由污染噪声因子、生活设施因子、人文环境因子、出行便捷因子、自然环境因子、安全环境因子和休闲活动因子等7个维度构成。2宜居满意度受到宜居感知因素和个体与家庭属性共同影响,但宜居感知因素的解释力明显要强,其中污染噪声因子、自然环境因子和出行便捷因子等因素是关键因子。3宜居满意度与宜居感知因素具有相对一致性,且存在个体与家庭属性差异。通常宜居感知因素得分低居民,其宜居满意度也相对较低;另外,远郊区、租赁房、有迁居经历、男性、30~39岁、高中学历、家庭月收入5000元以下和外地户口等社会群体的宜居满意度明显要低。 |
| [79] | Abstract The identification of contamination level and ecological risks, associated with heavy metal pollution of sediments in small hydropower cascade was done on the base of index analyses approach. The concentration of As, Cd, Cu, Hg, Pb, Zn, total organic carbon and percentage of fines were determined in sediments of two habitats in cascade sequence – river and dam. Correlation and multivariate analyses suggest that As, Cu, Pb and Zn are associated with similar anthropogenic source. Cadmium and mercury originate from different source and have specific moving. Based on the contamination and background indices the sediments in Middle Iskar cascade are moderate contaminated at least and are subject of intensive hydrological and technological mixing. The potential ecological risk index (PERI) classifies the sediments in dam site with the higher risk level. Suitable indicators for express assessment of metal pollution in “river” sediments are contamination/enrichment indices which are more sensitive for local concentration increase of less toxic metals. In “dam” sites the process of sedimentation affects strongly the degree of metals accumulation and differences in toxicity are clearly presented – PER/PERI in combination with content of fine sediment fractions and TOC have a potential for rapid identification of sediment-associated risks. |
| [80] | Studying the influencing factors of carbon dioxide emissions is not only practically but also theoretically crucial for establishing regional carbon-reduction policies, developing low-carbon economy and solving the climate problems. Therefore, we used a geographical detector model which is consists of four parts, i.e. , risk detector, factor detector, ecological detector and interaction detector to analyze the effect of these social economic factors, i.e. , GDP, industrial structure, urbanization rate, economic growth rate, population and road density on the increase of energy consumption carbon dioxide emissions in industrial sector in Inner Mongolia northeast of China. Thus, combining with the result of four detectors, we found that GDP and population more influence than economic growth rate, industrial structure, urbanization rate and road density. The interactive effect of any two influencing factors enhances the increase of the carbon dioxide emissions. The findings of this research have significant policy implications for regions like Inner Mongolia. |
| [81] | 为分析京津冀及其周边区域2013年典型污染事件中PM2.5的时空分布特征及污染风险因素,根据国家城市环境空气质量实时发布数据和京津冀地区地理国情信息监测成果,采用空间数据挖掘方法对PM2.5污染的热点区域进行了划分;并采用地理探测器定量分析了PM2.5污染风险因子及其影响程度.结果表明:在选取的京津冀6个城市中,在PM2.5污染事件统计上存在保定—廊坊—北京—天津—承德—张家口的污染顺序.PM2.5污染在空间上呈河南省(山东省)—河北省—北京市(天津市)一线的带状分布特征,在单次污染事件中,城市间的PM2.5污染存在空间运移关系.空间热点探测表明,京津冀及其周边区域主要分为5个热点聚集区,其中3个高值区分布在北京市、天津市、河北省和山东省的中部,面积分别为5.31×10⁴、10.26×10⁴、5.04×10⁴km2.在8个污染风险因子中,污染企业总数(影响力为0.97,下同)、降水量(0.93)、地形坡度(0.89)对PM2.5污染的影响显著高于其他风险因子;其他风险因子影响力排序依次为人口数量(0.60)、降水量大于0.1 mm的降水日数(0.57)、地表覆盖类型(0.52)、年均相对湿度(0.51)、年均风速(0.33),但风险因子间相比没有显著性差异.研究显示,京津冀地区PM2.5污染的主要因素是污染物排放,其次,气象要素中的年降水量和自然地理环境中的地形坡度也是影响PM2.5污染特征的重要风险因子. . 为分析京津冀及其周边区域2013年典型污染事件中PM2.5的时空分布特征及污染风险因素,根据国家城市环境空气质量实时发布数据和京津冀地区地理国情信息监测成果,采用空间数据挖掘方法对PM2.5污染的热点区域进行了划分;并采用地理探测器定量分析了PM2.5污染风险因子及其影响程度.结果表明:在选取的京津冀6个城市中,在PM2.5污染事件统计上存在保定—廊坊—北京—天津—承德—张家口的污染顺序.PM2.5污染在空间上呈河南省(山东省)—河北省—北京市(天津市)一线的带状分布特征,在单次污染事件中,城市间的PM2.5污染存在空间运移关系.空间热点探测表明,京津冀及其周边区域主要分为5个热点聚集区,其中3个高值区分布在北京市、天津市、河北省和山东省的中部,面积分别为5.31×10⁴、10.26×10⁴、5.04×10⁴km2.在8个污染风险因子中,污染企业总数(影响力为0.97,下同)、降水量(0.93)、地形坡度(0.89)对PM2.5污染的影响显著高于其他风险因子;其他风险因子影响力排序依次为人口数量(0.60)、降水量大于0.1 mm的降水日数(0.57)、地表覆盖类型(0.52)、年均相对湿度(0.51)、年均风速(0.33),但风险因子间相比没有显著性差异.研究显示,京津冀地区PM2.5污染的主要因素是污染物排放,其次,气象要素中的年降水量和自然地理环境中的地形坡度也是影响PM2.5污染特征的重要风险因子. |
| [82] | 运用Whittaker滤波重构MODISNDVI时序数列,利用地理探测器对比滤波前后影像信噪比,采用动态阈值法获取2000-2012年陕西省植被的3个关键物候参数(返青期、枯黄期和生长周期),在此基础上分析了该区植被物候参数空间分布特征。结果表明:(1)Whittaker滤波能够平滑原始NDVI曲线,有效减少原始影像的噪声,提高影像辨识度,并且参数设置简单;(2)陕西省植被物候地区分异明显,不同气候区划类植被物候表现出中温带半干旱区-暖温带半干旱区-暖温带半湿润区-北亚热带湿润区的递变规律:返青期逐步提前,枯黄期逐步推迟;(3)植被物候受高程和纬度影响,并且纬度影响更显著。海拔每升高200m,返青期推迟1.3d,枯黄期提前0.6d;纬度每升高0.5°,返青期推迟3.6d,枯黄期提前1.2d。 . 运用Whittaker滤波重构MODISNDVI时序数列,利用地理探测器对比滤波前后影像信噪比,采用动态阈值法获取2000-2012年陕西省植被的3个关键物候参数(返青期、枯黄期和生长周期),在此基础上分析了该区植被物候参数空间分布特征。结果表明:(1)Whittaker滤波能够平滑原始NDVI曲线,有效减少原始影像的噪声,提高影像辨识度,并且参数设置简单;(2)陕西省植被物候地区分异明显,不同气候区划类植被物候表现出中温带半干旱区-暖温带半干旱区-暖温带半湿润区-北亚热带湿润区的递变规律:返青期逐步提前,枯黄期逐步推迟;(3)植被物候受高程和纬度影响,并且纬度影响更显著。海拔每升高200m,返青期推迟1.3d,枯黄期提前0.6d;纬度每升高0.5°,返青期推迟3.6d,枯黄期提前1.2d。 |
| [83] | 本文以2005年以来中国科学院遥感与数字地球研究所开放式空间数据共享网站(OSDS)平台的注册用户为研究对象,利用最近邻层次空间聚类方法和地理探测器模型,对各省注册用户量的空间分布特征和差异影响因素进行了分析。分析结果表明,整体上用户空间分布很不均衡,主要集中在东部发达地区和几个在测绘和地理信息科学领域卓有建树的地区,信息、科研和教育是主要影响因素,经济、网络和测绘的单因素影响力较低,而与主要影响因素结合的交互影响得到了提升。因此,多因素共同制约着用户群的空间分布格局和区域不均衡性。应用地理探测器能从宏观上把握遥感****群体的空间分布特征及其影响因素,其分析结果能够指导数据提供者更有针对性地为用户提供服务,也可为遥感产业调整和空间布局优化提供依据。 . 本文以2005年以来中国科学院遥感与数字地球研究所开放式空间数据共享网站(OSDS)平台的注册用户为研究对象,利用最近邻层次空间聚类方法和地理探测器模型,对各省注册用户量的空间分布特征和差异影响因素进行了分析。分析结果表明,整体上用户空间分布很不均衡,主要集中在东部发达地区和几个在测绘和地理信息科学领域卓有建树的地区,信息、科研和教育是主要影响因素,经济、网络和测绘的单因素影响力较低,而与主要影响因素结合的交互影响得到了提升。因此,多因素共同制约着用户群的空间分布格局和区域不均衡性。应用地理探测器能从宏观上把握遥感****群体的空间分布特征及其影响因素,其分析结果能够指导数据提供者更有针对性地为用户提供服务,也可为遥感产业调整和空间布局优化提供依据。 |
