 , 刘路路
, 刘路路Spatial patterns of drought/flood over eastern China in the periods of anomalous solar activity during the past millennium
GEQuansheng, LIULulu通讯作者:
收稿日期:2016-01-25
修回日期:2016-02-20
网络出版日期:2016-05-25
版权声明:2016《地理学报》编辑部本文是开放获取期刊文献,在以下情况下可以自由使用:学术研究、学术交流、科研教学等,但不允许用于商业目的.
基金资助:
作者简介:
-->
展开
摘要
关键词:
Abstract
Keywords:
-->0
PDF (2013KB)元数据多维度评价相关文章收藏文章
本文引用格式导出EndNoteRisBibtex收藏本文-->
1 引言
太阳活动是全球气候变化的主要驱动力之一,也是影响年代至百年尺度降水与旱涝变化的重要因子[1-5]。揭示太阳活动异常时的降水与旱涝变化特征,对于辨识其间的可能联系机制,预测未来降水与旱涝变化具有重要意义。关于太阳活动与降水变化的关系问题,早在20世纪初期就已有研究[6]。在全球尺度上,最近通过对实测降水与短波、长波强迫因子序列的比较研究表明:20世纪全球大气水分含量变化存在1个与太阳活动接近的11年周期[7];且陆地降水变率与自然短波强迫驱动的变率接近,但与长波强迫变化(同人类活动导致的温室效应增强密切相关)关系不大[8]。对11个太阳黑子峰值年的合成分析表明:其海温分布与La Ni?a模态相似,因而使得热带太平洋地区降水偏少,其南北两侧的降水偏多;然而在同纬度上,海洋与陆地的降水变化型存在很大差异[9]。还有研究显示:太阳活动异常会导致北半球环状模(North Annular Mode)的显著变化,进而影响北半球的降水格局[10]。在太阳活动与全球各地的降水变化方面,特别是关于各地降水准周期变化与太阳活动的对应特征,同样也有大量研究。如在美国,虽然许多地区的降水变化滞后于太阳辐射变化[11],但太阳活动的周期变化对过去千年美国中西部干旱的准20年周期有显著调制作用[12],且大平原北部干旱时期对应于太阳活动极小期[13]。在欧洲,太阳活动极小期,降水多呈现中南欧增多、北欧减少的格局[14]。在非洲,过去1100年赤道东非的年代际至百年尺度降水与太阳辐射变化基本呈反相关,其中4次大旱均出现在太阳辐射高值期,而相对湿润期则出现在太阳活动极小期,尤以蒙德尔极小期降水最多[15]。在印度,过去120年中季风降水明显偏多的时段与太阳辐射高值期对应,其可能原因是太阳辐射高值期易造成沃克环流和哈德来环流增强[16]。
中国****在20世纪早期,就注意到太阳活动对中国气候异常的影响问题[17-18]。此后,许多****分别对中国各地的降水、旱涝变化与太阳活动变化的对应关系进行了研究[19]。如通过对器测时期的降水、旱涝变化与太阳活动变化对比分析发现:黄河流域和关中平原的旱涝与太阳黑子变化呈负相关[20-21];淮河地区在太阳黑子峰值年易发生旱灾,谷值年易发生涝灾[22];总体上,在太阳黑子峰值年,中国南方、东北夏季少雨,黄河中上游流域、黄淮地区以及长江中上游多雨;而太阳黑子谷值年,则是华南及黄河以北多雨,长江流域及以北到黄河中上游少雨[23]。徐群等[24]对1954-1981年间逐月太阳黑子数和北半球500 hpa副热带高压的对应分析还发现:在太阳活动强时,西太平洋副高增强、面积增大、脊点西伸,脊线与北界偏北;反之则西太平洋副高减弱、面积缩小、脊点东退,脊线与北界偏南;这一现象大致与上述的太阳黑子峰(谷)值年中国降水异常的总体特征大体对应。
然而,这些研究因受器测资料长度的限制,主要着眼于太阳活动11年周期与中国降水变化的对应特征研究。虽然也有一些****利用更长时段的降水代用资料或重建序列对降水与太阳活动的对比特征进行了研究[25-27],如发现:在太阳活动较弱时(如Maunder极小期),长江中下游地区易发生干旱事件,反之则易发生洪涝事件[25];太阳活动强,对应黄河中下游地区的干旱期,反之对应偏涝期[26];太阳活动偏强,青藏高原东北部的德令哈地区降水量偏多,反之偏少[27]。但这些研究多限于长时期太阳活动异常与局地降水变化序列的对比分析,而对其与中国旱涝格局的研究至今未见。为此,本文拟根据中国东部旱涝等级资料,结合国际上新近重建的太阳活动变化序列,对过去千年太阳活动异常与中国东部旱涝格局的对应特征进行探讨。特别是最近几年,随着过去千年气候变化重建结果的不断丰富,中国在多年代至百年尺度的冷暖阶段变化与旱涝格局的对应关系研究上取得了显著进展[28-29],这为开展上述问题研究提供了重要资料基础和思路借鉴。
2 资料与方法
2.1 太阳活动变化资料及过去千年太阳活动异常期辨识
太阳活动变化资料(图1)为国际古气候数据库(http://www.ncdc.noaa.gov/data-access/paleoclimatology-data/datasets/climate-forcing)收录的4条过去千年太阳活动变化重建结果及Vieira等的最新重建结果[30]。已有研究表明:在过去千年中,太阳活动经历了5个极小期和2个极大期(图1),分别是:奥尔特极小(Oort Minimum, Om),约1010~1050年;中世纪极大(Medieval Maximum, MedM),约1100~1250年;沃尔夫极小(Wolf Minimum, Wm),约1280~1350年;斯普雷尔极小(Sp?rer Minimum, Sm),约1460~1550年;蒙德尔极小(Maunder Minimum, Mm),1645~1715年;道顿极小(Dalton Minimum, Dm),1795~1823年;现代极大(Modern Maximum, ModM),1920年以后。这7个太阳活动异常期与图1各序列所显示过去千年太阳辐射变化特征基本吻合。除此之外,各序列还显示,在这些极小与极大期之间,还存在数个持续时间较短的太阳辐射相对高值期[31-32]。为确定这些相对高值期,本文采用滑动平均方法分析上述5条太阳活动变化序列,计算每条序列44年(相当于4个太阳周)的滑动平均值,求得这些太阳辐射相对高值期的最高值年,以其最高值年前后各22年作为各个相对高值的起讫时间。考虑到由于这些重建序列的定年方法存在差异,导致各序列所揭示的相对高值期的起讫年份也不一致,因此,将各序列覆盖的最晚和最早年份确定为各个相对高值期出现的起讫年份,分别记为G1、G2、G3和G4(表1)。如4条显示G1的最大值年分别为1371年、1365年、1365年、1369年,其前22年的最晚年份为1349年,其后22年最早年份为1387年,则以1349-1387年作为G1的起讫时段。然而因据此确定的时段可能与其他太阳极值期存在时间交叉,故还需将交叉时段舍去。如根据上述方法确定的G1起始时段1349-1350年与Wm交叉,故最终以1351-1387作为G1的起讫时间。同理可得G2、G3和G4的起讫时间分别为1593-1612年、1756-1787年和1845-1873年。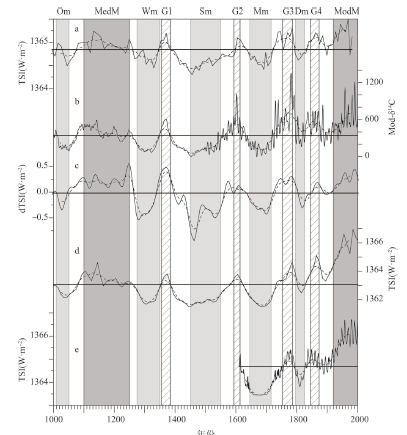 显示原图|下载原图ZIP|生成PPT
图1过去千年太阳辐射变化及太阳活动极小期(浅灰柱)、极大期(灰柱)和太阳辐射高值期(斜线柱)(a. Delaygue等(2010)重建的1000-1982年太阳总辐照度变化;b. 根据δ14C重建的1000-2001年太阳调制函数变化(Muscheler等, 2007);c. Steinhilber等(2009)重建的太阳总辐照度距平变化;d. Vieira等(2011)重建的太阳总辐照度变化;e. Lean(2000)重建的1610-2000年太阳总辐照度变化)
-->Fig. 1The variation of solar irradiance, and the periods of Solar Minimum (light gray column), Solar Maximum (gray column) and high solar irradiance (diagonal column) during the past millennium(a. Total solar irradiance in 1000-1982 reconstructed by Delaygue et al. (2010); b. Solar modulation function based on 14C in the past millennium (Muscheler et al., 2007); c. Anomaly of total solar irradiance reconstructed by Steinhilber et al. (2009); d. Total solar irradiance reconstructed by Vieira et al. (2011); e. Total solar irradiance in 1610-2000 reconstructed by Lean (2000))
-->
Tab. 1
表1
表1过去千年太阳活动变化重建结果揭示的太阳辐射高值期(除中世纪和现代极大外)起讫年份
Tab. 1The duration of high solar irradiance period (excluding Medieval Maximum and Modern Maximum) revealed by solar activity reconstruction for the past millennium
| 序列 | 高值期1(G1) | 高值期2(G2) | 高值期3(G3) | 高值期4(G4) | |||||||
|---|---|---|---|---|---|---|---|---|---|---|---|
| 最大值年 | 起讫年份 | 最大值年 | 起讫年份 | 最大值年 | 起讫年份 | 最大值年 | 起讫年份 | ||||
| Delaygue | 1371 | 1349-1393 | 1615 | 1593-1637 | 1770 | 1748-1792 | 1862 | 1840-1884 | |||
| Muscheler | 1365 | 1343-1387 | 1594 | 1572-1616 | 1771 | 1749-1793 | 1853 | 1831-1875 | |||
| Steinhilber | 1365 | 1343-1387 | 1590 | 1568-1612 | 1765 | 1743-1787 | 1867 | 1845-1889 | |||
| Vieria | 1369 | 1347-1391 | 1602 | 1580-1624 | 1778 | 1756-1800 | 1862 | 1840-1884 | |||
| Lean | 1771 | 1749-1793 | 1851 | 1829-1873 | |||||||
| 共有时段 | 1349-1387 | 1593-1612 | 1756-1787 | 1845-1873 | |||||||
新窗口打开
2.2 旱涝等级资料与旱涝格局重建
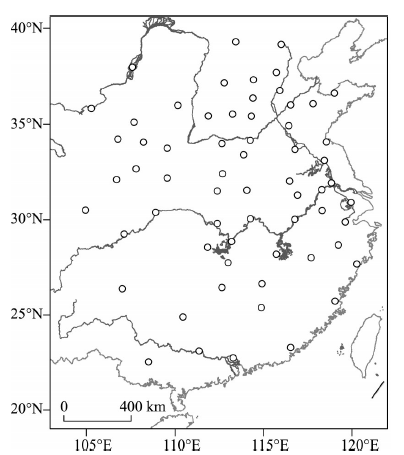
本文以中国东部过去2000年旱涝等级数据集作为重建太阳活动异常期旱涝格局的基础资料。该数据集涵盖63个站点(图2),时间分辨率为年,且已被用于多年代至百年尺度的冷暖阶段变化与旱涝格局的对应关系研究中[28-29];其中各站旱涝等级根据历史文献记载的各地每年旱涝灾害强度、持续时间及影响大小确定,1级为重旱;2级,旱;3级,正常;4级,涝;5级,大涝。该数据集较过去500年旱涝等级数据集覆盖时段更长,且覆盖中国季风气候的大部分地区,也较先前其他历史时期旱涝等级数据集覆盖区域更广[33-34];这为研究千年时段的中国东部旱涝格局提供了可能。但因受原始记载遗漏、失传与“记异不记常”、“厚今薄古”及地区间社会经济文化发展不平衡、战乱等多个因素影响,该数据集1470年之前的旱涝等级数据存在不同程度的缺值。因而,为重建各个太阳活动异常期的旱涝格局,本文借鉴重建冷、暖时段旱涝格局的方法[28],即以各站各级旱涝发生几率的比率差(简称“DDF”)为指标,计算每个太阳活动异常期各站旱涝状况偏离过去千年平均状况的程度。具体算法如下:设某年某站除正常或无记录年份外的旱涝等级式中:
式中:s为时段的起始年;t为时段长度。同理,在过去千年(长度记为R)各站实有旱涝(除正常年外)记录年份中,发生k级旱涝的几率为:
那么,比率
式中:DDFj反映了每个时段各站所有级别旱涝发生几率偏离过去千年平均状况的总体程度。当DDFj = 0时,表明该站该时段的旱涝程度与过去千年一致;DDFj > 0,表明该站该时段偏涝;反之DDFj < 0,则表明该站该时段偏旱。DDFj的绝对值越大,表示偏离程度越严重。
同时,对1470年以前的时段,还根据每年实有旱涝等级(除正常年份外)记录站数占全部站数的百分率(简称“数据实有率”),选取其中数据实有率高于每个异常期数据实有率平均值的年份作为代表性样本,计算各个太阳活动异常期的DDF。由于每个时段的DDF反映了该时段各站所有级别旱涝发生几率偏离过去千年平均状况的程度;因此,这一方法能有效消除资料缺失对旱涝状况偏离程度计算结果的影响,从而保证了不同时段之间的可比性[29]。
 显示原图|下载原图ZIP|生成PPT
图2旱涝等级数据集的站点分布
-->Fig. 2Location of sites with drought/flood grade data used in this study
-->
3 结果分析与讨论
3.1 各个异常期的旱涝格局
从5个太阳活动极小期、2个太阳活动极大期和4个太阳辐射高值期中国东部旱涝格局的分布可看出(图3),5个极小期的旱涝格局分别是:奥尔特极小期(1010-1050年,图3a),大致呈自南向北的“涝—旱—涝”分布:华北至长江流域偏旱,其南北两侧的江南地区和黄土高原北部偏涝,秦岭地区偏涝。沃尔夫极小期(1280-1350年,图3b),中国东部旱涝大致呈自东南向西北的带状分布:西北东部、长江中下游至华南地区偏旱,东南沿海、云贵高原至华北地区偏涝。斯普雷尔极小期(1460-1550年,图3c),中国东部总体偏旱,局部(甘肃、京冀、黄淮、长江三角洲和华南地区)偏涝。蒙德尔极小期(1645-1715年,图3d),西北、江南及东南沿海偏旱,其他地区偏涝。道顿极小期(1795-1823年,图3e),115°E以西呈自南向北的“涝—旱—涝”分布:长江流域偏旱,其南北两侧的西北东部和华南地区偏涝;115°E以东总体偏涝。从总体上看,5个极小期的旱涝格局虽不尽相同,但长江中下游有4个时段(图3a~3d)整体偏旱,1个时段(图3e)大部偏旱,即出现偏旱的几率更高;华北地区3个时段(图3b、3d、3e)整体偏涝。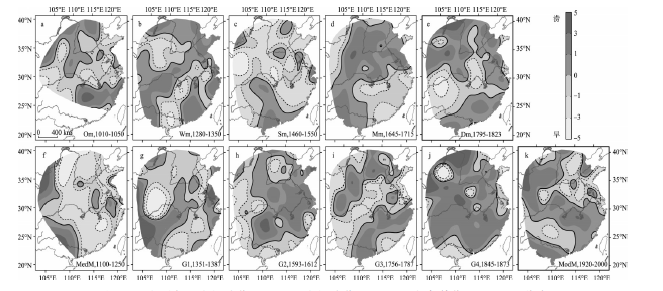 显示原图|下载原图ZIP|生成PPT
图3过去千年5个极小期(a~e)、2个极大期(f, k)和4个高值期(g~j)DDF分布
-->Fig. 3Spatial patterns of DDF in 5 Solar Minimum periods (a-e) and 2 Solar Maximum (f, k) as well as 4 high solar irradiance periods (g-j) during the past millennium
-->
2个极大期和4个高值期的旱涝格局分别是:中世纪极大期(1100-1250年,图3f),总体偏旱,仅西北东部、西南和江淮流域部分地区偏涝。高值期G1(1351-1387年,图3g),115°E以西大致呈自南向北的“旱—涝—旱”分布:四川盆地、西北东部以及华南沿海偏旱,中间的云贵高原偏涝;115°E以东至120°E则偏旱,120°E附近偏涝。高值期G2(1593-1612年,图3h),110°E以西偏旱;以东呈自南向北的“旱—涝—旱”分布:华北北部和华南地区偏旱,中间的江南地区至华北南部偏涝。高值期G3(1756-1787年,图3i),大致呈自东南向西北的带状分布:东南沿海、云贵高原至华北平原、西北东部偏旱,中间的江南地区东部、四川盆地至黄土高原偏涝。高值期G4(1845-1873年,图3j),中国东部普遍偏涝,仅华东沿海、宁夏、广西和汉水流域偏旱。现代极大期(1920-2000年,图3k),大致呈自西南向东北的带状分布,华北、西南地区偏旱,西北东部至东南地区、华南沿海偏涝。从总体上看,2个极大期和4个高值期的旱涝格局也不尽相同,中世纪极大期整体偏旱,高值期G4整体偏涝,其余4个时段则旱涝相间出现。其中长江中下游有4个时段(图3g、3h、3j、3k)偏涝,华北地区有3个时段(图3f、3g、3k)整体偏旱,另有1个时段江南偏涝、江北偏旱(图3i)。
从各个异常期的旱涝格局对比看,沃尔夫极小期与现代极大期之间的旱涝格局除江南东部外,整体旱涝格局大致相反,两者的空间相关系数为-0.256,达到了0.05的显著性水平。蒙德尔极小期与高值期G1的旱涝格局也大致相反,两者的空间相关系数为-0.306,亦达0.05的显著性水平。
3.2 异常期集合平均的旱涝格局
由于旱涝格局变化除受太阳活动异常影响外,还受到太阳活动异常之外的其他因素影响;因而会造成太阳活动各异常期的中国东部旱涝格局不尽相同。而集合平均方法可滤去部分其他信号的影响,从而保留更多的太阳活动异常对中国东部旱涝格局的影响信号[35]。为此,图4给出了过去千年5个太阳活动极小期、2个太阳活动极大期和4个太阳辐射高值期(简称“极大/高值期”)的旱涝等级集合平均状况。从中可以看出:太阳活动极小期(图4a),中国东部季风及其尾闾区总体偏干,旱涝格局呈自南向北的“涝—旱—涝”分布:华北平原及汾河、渭河流域偏涝,西北东部、长江流域及其以南广大地区偏旱。而在极大/高值期(图4b),则总体偏湿,且呈长江流域及西北东部多偏涝、华南和华北大部偏旱格局。两者的空间相关系数为-0.545,达到了0.01的显著性水平。这说明:太阳活动极小期与极大/高值期间的中国东部旱涝格局大致相反。此外,5个极小期和6个极大/高值期集合平均的旱涝格局分别与蒙德尔极小期(图3d)和现代极大期(图3k)的旱涝格局最为相似,其相关系数分别为0.591和0.724,均达到0.01的显著性水平。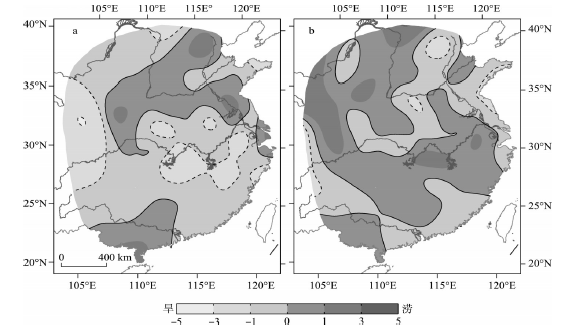 显示原图|下载原图ZIP|生成PPT
图4过去千年太阳活动极小期(a)和极大/高值期(b)的DDF集合平均分布
-->Fig. 4Spatial patterns of DDF ensemble mean for 5 Solar Minimum periods (a) and 6 Solar Maximum or high solar irradiance periods (b) during the past millennium
-->
3.3 可能机制与预警意义讨论
尽管目前对太阳活动异常影响中国旱涝格局变化的机制研究很少,但已有的一些气候模拟诊断研究表明:太阳活动的强弱变化可能通过热带和副热带太平洋地区海气耦合反馈机制影响全球降水。具体表现为:太阳活动强时(如峰值年),热带和亚热带太平洋晴空区域吸收的太阳辐射增加,增加的太阳辐射使地表、特别是海洋蒸发加强,由此产生的更多水汽通过夏季风环流被输送到季风区,从而造成季风及其边缘区的降水总体增多[36-38]。但同时,太阳活动强又会造成北半球500 hPa位势高度出现正异常,尤以20°N以南的热带地区和45°N~65°N之间的区域最为显著,且中国上空也为正异常;此时在对流层中低层850 hPa上,欧亚大陆北部为反气旋式环流,热带印度洋也为一明显的反气旋式环流,且中国东部30°N~40°N间的区域出现异常偏北风,从而导致雨区多集中在30°N及其两侧区域;同时中国东部30°N~40°N间的区域位势高度异常场的垂直分布呈现类似正压的稳定结构,使该区域的垂直对流减弱;二者相互配合使得中国东部形成了长江流域偏涝、华北大部偏旱格局。而在太阳活动弱时(如谷值年),上述作用过程则相反,从而形成了在极小期时中国东部季风及其尾闾区总体偏干,且易出现华北偏涝、长江流域及其以南广大地区偏旱的格局[39]。对比表明:本文研究结果同前人所得到的太阳活动异常时中国一些地区降水变化研究结果具有一致性。如前人研究发现:过去1000年在太阳活动较弱时,长江中下游易发生干旱[25],陇西地区[40]、福建北部山地[41]均对应降水偏少;相反,黄河中下游则易偏涝[26];这与本文得到的太阳活动极小期时中国东部旱涝呈自南向北的“涝—旱—涝”分布格局基本一致。
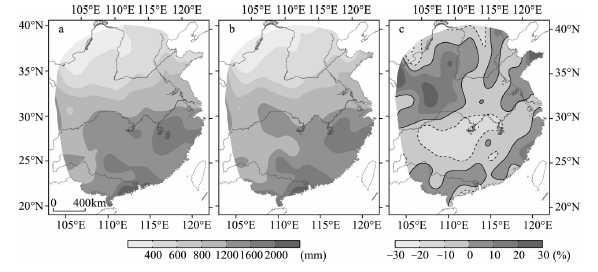
此外,根据俄罗斯科学院普尔科沃天文台对太阳总辐照度的观测记录分析发现[42]:自21世纪初起,未来几十年太阳黑子数和TSI将逐渐减小,太阳活动可能由强转弱;而这可能会导致未来数十年长江流域转向偏旱,华北地区转向偏涝。值得注意的是,根据国家气候中心对中国气候基本要素及长江中下游梅雨等的监测(http://cmdp.ncc-cma.net/Monitoring/cn_moni_china.php?product=cn_moni_china_basic):2000-2013年的14年间,有11年长江中下游地区梅雨量偏少,其中7年偏少5成以上;自2006年川渝大旱以来,位于长江上游的西南地区又于2009-2013年连续多年发生严重干旱(主要出现在春季至初夏),其中自2009年8月-2010年6月初的持续干旱波及西南5省的大多数区域,为有完整气象观测以来的最极端干旱[43]。同时,2009-2014年的6年间,中国东部季风区降水有3年(分别是2009、2011、2013年)出现了“南(长江流域)旱北(华北)涝”格局。对比2005-2014年间年降水量平均值与其前10年平均值的差异(图5),可以明显看出:与其前10年相比,2005-2014年间中国东部降水已呈现出明显的“南旱北涝”特征:长江以北地区偏涝,以南地区偏旱,但华南亦偏涝。
 显示原图|下载原图ZIP|生成PPT
图52005-2014年年降水量平均值(b)与其前10年平均值(a)的距平百分率(c)
-->Fig. 5Precipitation anomaly percentage (c) between annual mean during 2005-2014 (b) and annual mean of previous 10 years (a)
-->
4 结论
过去千年太阳活动异常与中国东部旱涝格局的对应特征研究认识可归纳为:(1)过去千年,11个太阳活动异常期对应的中国东部旱涝格局各不相同,其中在5个太阳活动极小期,长江中下游有4个时段整体偏旱;华北地区有3个时段整体偏涝。而在2个太阳活动极大期和4个太阳辐射高值期中,长江中下游有4个时段偏涝,华北地区有3个时段整体偏旱,另有1个时段江南偏涝、江北偏旱;其中中世纪极大期中国东部整体偏旱,而1845-1873年的太阳辐射高值期,中国东部则整体偏涝。
(2)集合平均结果表明:太阳活动极小期的中国东部旱涝格局与极大期(包括太阳辐射高值期)的旱涝格局大致相反。其中太阳活动极小期,中国东部降水呈自南向北的“涝—旱—涝”分布,华北平原及汾河、渭河流域偏涝,西北东部、长江流域及其以南广大地区偏旱;反之,则长江流域及西北东部多偏涝,华南和华北大部多偏旱。当太阳活动由强转弱时,可能会导致长江流域转向偏旱,华北地区转向偏涝。
然而,中国东部旱涝变化,除受太阳活动异常的影响外,还同时受气候系统的其他内外强迫因子共同影响,如有研究表明:当太平洋年代际振荡(PDO)处于负位相时,中国东部降水易呈“涝—旱—涝”格局;反之,则长江流域偏涝、华北地区偏旱[44-45]。这说明:太阳活动异常与中国东部旱涝之间的对应关系可能极为复杂,因而本文的上述认识仍可能存在不确定性;特别是本文对二者之间联系机制和预警意义的分析仅是基于现有一些研究结果的讨论和推测。所以,将重建结果、观测事实和气候模拟相结合,进一步揭示太阳活动异常与中国东部旱涝格局的多尺度对应关系,深入探讨太阳活动变化对中国旱涝格局的影响机制,是下一步需要研究的重点问题。
The authors have declared that no competing interests exist.
参考文献 原文顺序
文献年度倒序
文中引用次数倒序
被引期刊影响因子
| [1] | |
| [2] | Abstract Is the Sun the controller of climate changes, only the instigator of changes that are mostly forced by the system feedbacks, or simply a convenient scapegoat for climate variations lacking any other obvious cause? This question is addressed for suggested solar forcing mechanisms operating on time scales from billions of years to decades. Each mechanism fails to generate the expected climate response in important respects, although some relations are found. The magnitude of the system feedbacks or variability appears as large or larger than that of the solar forcing, making the Sun's true role ambiguous. As the Sun provides an explicit external forcing, a better understanding of its cause and effect in climate change could help us evaluate the importance of other climate forcings (such as past and future greenhouse gas changes). |
| [3] | |
| [4] | ABSTRACT How—indeed whether—the Sun's variable energy outputs influence Earth's climate has engaged scientific curiosity for more than a century. Early evidence accrued from correlations of assorted solar and climate indices, and from recognition that cycles near 11, 88 and 205 years are common in both the Sun and climate.1, 2 But until recently, an influence of solar variability on climate, whether through cycles or trends, was usually dismissed because climate simulations with (primarily) simple energy balance models indicated that responses to the decadal solar cycle would be so small as to be undetectable in observations.3 However, in the past decade modeling studies have found both resonant responses and positive feedbacks in the ocean-atmosphere system that may amplify the response to solar irradiance variations.4, 5 Today, solar cycles and trends are recognized as important components of natural climate variability on decadal to centennial time scales. Understanding solar-terrestrial linkages is requisite for the comprehensive understanding of Earth's evolving environment. The attribution of present-day climate change, interpretation of changes prior to the industrial epoch, and forecast of future decadal climate change necessitate quantitative understanding of how, when, where, and why natural variability, including by the Sun, may exceed, obscure or mitigate anthropogenic changes. Copyright 2010 John Wiley & Sons, Ltd.For further resources related to this article, please visit the WIREs website. |
| [5] | 主要参阅了近十年来的有关文献,回顾和总结了太阳活动对近百年气 候变化影响的研究进展.首先,回顾了太阳活动对全球和区域尺度的温度、季风和降水影响的最新观测证据和模拟结果;其次,从北极涛动(AO)、北大西洋涛动 ( NAO)、ENSO、准两年振荡(QBO)等方面总结了太阳活动对各气候模态的可能影响;然后归纳了太阳活动影响气候变化的三种可能机制(太阳总辐射机 制、太阳短波辐射变化机制和能量粒子机制)的研究进展.最后提出了该领域一些重要而未解决的科学问题,对未来的研究提出了一些展望,并简要阐述了太阳一气 候研究这一交叉学科的重要意义. . 主要参阅了近十年来的有关文献,回顾和总结了太阳活动对近百年气 候变化影响的研究进展.首先,回顾了太阳活动对全球和区域尺度的温度、季风和降水影响的最新观测证据和模拟结果;其次,从北极涛动(AO)、北大西洋涛动 ( NAO)、ENSO、准两年振荡(QBO)等方面总结了太阳活动对各气候模态的可能影响;然后归纳了太阳活动影响气候变化的三种可能机制(太阳总辐射机 制、太阳短波辐射变化机制和能量粒子机制)的研究进展.最后提出了该领域一些重要而未解决的科学问题,对未来的研究提出了一些展望,并简要阐述了太阳一气 候研究这一交叉学科的重要意义. |
| [6] | . |
| [7] | [1] A 20-year regional climate simulated by the Weather Research and Forecasting model has been analyzed to study the influence of the atmospheric rivers and land surface conditions on heavy precipitation and flooding in the western U.S. The simulation realistically captured the mean and extreme precipitation, and the precipitation/temperature anomalies of all the atmospheric river events between 1980–1999. Contrasting the 1986 President Day and 1997 New Year Day events, differences in atmospheric stability have an influence on the spatial distribution of precipitation. Although both cases yielded similar precipitation, the 1997 case produced more runoff. Antecedent soil moisture, rainfall versus snowfall, and existing snowpack all seem to play a role, leading to a higher runoff to precipitation ratio for the 1997 case. This study underscores the importance of the atmospheric rivers and land surface conditions for predicting heavy precipitation and floods in the current and future climate of the western U.S. |
| [8] | Observed globally-averaged land precipitation changes over the 20th century are compared with simulations of the HadCM3 climate model using an ``optimal fingerprinting'' method. We find that observed changes in precipitation are too large to be consistent with model-generated internal variability and are consistent with (attributable to) the combination of natural and anthropogenic forcings applied to the model. By comparing precipitation observations to shortwave and longwave forcing timeseries, we find that most of the forced variation in precipitation appears to be driven by natural shortwave forcings. We are unable to detect a response to anthropogenic longwave forcings in isolation. Finally, we seek to explain these results in terms of perturbations to the energy budget of the troposphere. |
| [9] | One of the mysteries regarding Earth's climate system response to variations in solar output is how the relatively small fluctuations of the 11-year solar cycle can produce the magnitude of the observed climate signals in the tropical Pacific associated with such solar variability. Two mechanisms, the top-down stratospheric response of ozone to fluctuations of shortwave solar forcing and the bottom-up coupled ocean-atmosphere surface response, are included in versions of three global climate models, with either mechanism acting alone or both acting together. We show that the two mechanisms act together to enhance the climatological off-equatorial tropical precipitation maxima in the Pacific, lower the eastern equatorial Pacific sea surface temperatures during peaks in the 11-year solar cycle, and reduce low-latitude clouds to amplify the solar forcing at the surface. |
| [10] | <h2 class="secHeading" id="section_abstract">Abstract</h2><p id="">We discuss effects of solar variability on the Earth’s large-scale climate patterns. These patterns are naturally excited as deviations (anomalies) from the mean state of the Earth’s atmosphere-ocean system. We consider in detail an example of such a pattern, the North Annular Mode (NAM), a climate anomaly with two states corresponding to higher pressure at high latitudes with a band of lower pressure at lower latitudes and the other way round. We discuss a mechanism by which solar variability can influence this pattern and formulate an updated general conjecture of how external influences on Earth’s dynamics can affect climate patterns.</p> |
| [11] | Correlation coefficients between annual differences in empirically modelled solar-irradiance variations and annual State-divisional precipitation in the USA for the period 1950-1988 were computed with lag times of 0 to 7 years. The most significant correlations occur in the Pacific North-west, with a lag time of 4 years, which is approximately equal to the travel time of water within the Pacific gyre from the western tropical Pacific Ocean to the Gulf of Alaska. Precipitation in the Desert South-west correlates significantly with solar irradiance lagged 3 and 5 years, which suggests a link with ocean-water temperature anomalies transported by the Equatorial Counter Current as well as the North Pacific gyre. With the correlations obtained, droughts coincide with periods of negative irradiance differences (dry high-pressure development), and wet periods coincide with periods of positive differences (moist low-pressure development). |
| [12] | |
| [13] | |
| [14] | Large changes in solar ultraviolet radiation can indirectly affect climate by inducing atmospheric changes. Specifically, it has been suggested that centennial-scale climate variability during the Holocene epoch was controlled by the Sun. However, the amplitude of solar forcing is small when compared with the climatic effects and, without reliable data sets, it is unclear which feedback mechanisms could have amplified the forcing. Here we analyse annually laminated sediments of Lake Meerfelder Maar, Germany, to derive variations in wind strength and the rate of Be accumulation, a proxy for solar activity, from 3,300 to 2,000 years before present. We find a sharp increase in windiness and cosmogenic Be deposition 2,759 +/- 39 varve years before present and a reduction in both entities 199 +/- 9 annual layers later. We infer that the atmospheric circulation reacted abruptly and in phase with the solar minimum. A shift in atmospheric circulation in response to changes in solar activity is broadly consistent with atmospheric circulation patterns in long-term climate model simulations, and in reanalysis data that assimilate observations from recent solar minima into a climate model. We conclude that changes in atmospheric circulation amplified the solar signal and caused abrupt climate change about 2,800 years ago, coincident with a grand solar minimum. |
| [15] | |
| [16] | The wavelet cross spectra of the yearly sunspot index and homogeneous-zone Indian monsoon rainfall time series are examined over the 120 a period 1871-1990 using Morlet continuous wavelets. The cross spectra of sunspot numbers with synthetic noise ensembles, including those matching the spectrum and probability distribution function of the rainfall time series, are used as reference to assess the significance of the cross spectrum between sunspot numbers and rainfall; their differences are studied using standard statistical tests. It is found particularly revealing to consider the two test periods 1878-1913 and 1933-1964, each comprising three complete solar cycles, which between them exhibit maximum contrast in solar activity since the beginning of accurate rainfall data collection in India [1871]. It is shown that the cumulative distribution of the 9-13 a band averaged cross power between sunspots and rainfall, derived from yearly values over either test period, differs from that between sunspots and spectrally matched noise in the same period at confidence levels of 99.5% or higher by the test. Further, the cross power of the sunspot index with rainfall, averaged over either test period, exceeds that with synthetic noise at z test confidence levels exceeding 99.99% over scale bands covering the 11.6 a sunspot cycle. The results further show variations across the different homogeneous rainfall zones of India, northeast India exhibiting a dramatically different phase relationship compared to the western regions of the country. The strong connections demonstrated here between Indian rainfall and solar activity are found to be organized approximately along quasi-longitudinal bands tilting eastward at their northern end. This suggests that higher solar activity causes intensification of the Walker and Hadley circulations; the mechanisms that may be responsible and the evidence from models are briefly discussed. |
| [17] | . |
| [18] | . |
| [19] | 本文根据1873—1934年 1月及7月海平面月平均气压图研究了东亚大气活动中心(1月西伯利亚高压,阿留申低压及赤道低压,7月太平洋高压与印度低压)位置的多年变化。计算了1月 活动中心的几何中心经纬度及7月活动中心边界经纬度的10年滑动平均值,并将其与我国气候振动比较。主要结果如下: (1)东亚大气活动中心位置的多年变化较复杂,它们的10年滑动平均曲线差异甚大,它们之间相关系数则不大。 (2)东亚大气活动中心位置多年变化的35年周期最明显。 (3)东亚大气活动中心位置多年变化与我国的气候振动有密切关系。我国不少站的气温及降水量10年滑动平均曲线与相应活动中心位置的曲线类似、或同相或反 相。活动中心位置与气温及降水量的相关系数大而且地理分布很有规律。 . 本文根据1873—1934年 1月及7月海平面月平均气压图研究了东亚大气活动中心(1月西伯利亚高压,阿留申低压及赤道低压,7月太平洋高压与印度低压)位置的多年变化。计算了1月 活动中心的几何中心经纬度及7月活动中心边界经纬度的10年滑动平均值,并将其与我国气候振动比较。主要结果如下: (1)东亚大气活动中心位置的多年变化较复杂,它们的10年滑动平均曲线差异甚大,它们之间相关系数则不大。 (2)东亚大气活动中心位置多年变化的35年周期最明显。 (3)东亚大气活动中心位置多年变化与我国的气候振动有密切关系。我国不少站的气温及降水量10年滑动平均曲线与相应活动中心位置的曲线类似、或同相或反 相。活动中心位置与气温及降水量的相关系数大而且地理分布很有规律。 |
| [20] | 太阳活动对黄河流域降水有一定影响。引用morlet小波分析技术,对黄河流域近50年来的降水与太阳黑子的小波系数变化进行分析,表明在1951~1997年期间,黄河流域年降水与太阳黑子在9年时间尺度上呈一定的负相关关系,且降水有1~2年的滞后现象。 . 太阳活动对黄河流域降水有一定影响。引用morlet小波分析技术,对黄河流域近50年来的降水与太阳黑子的小波系数变化进行分析,表明在1951~1997年期间,黄河流域年降水与太阳黑子在9年时间尺度上呈一定的负相关关系,且降水有1~2年的滞后现象。 |
| [21] | 利用关中平原1960-2010年逐月降水资料,通过Z指数确定了该地区的旱涝等级及发生年份,采用频率分析法分析太阳黑子极值年附近的旱涝特征,运用Morlet小波分析技术,对关中平原近51年来降水Z指数与太阳黑子的小波系数变化进行分析。结果表明:(1)关中平原近51年的旱涝发生频率基本相等,在90年代之后旱灾发生频率明显高于涝灾发生频率。(2)太阳黑子数与关中平原旱涝在整个60年代呈现反相关关系;自70年代开始至今,两者基本呈现正相关关系,且旱涝变化较太阳黑子数目的活动存在2年左右的"滞后期"。(3)关中平原在太阳黑子m年附近出现灾害的概率明显高于太阳黑子M年,且太阳黑子m年附近发生重、大旱灾的频率要高于重、大涝灾的频率。(4)太阳黑子与旱涝指数在9-12年周期处存在对应关系,说明太阳黑子变化对关中平原的旱涝有一定影响。 . 利用关中平原1960-2010年逐月降水资料,通过Z指数确定了该地区的旱涝等级及发生年份,采用频率分析法分析太阳黑子极值年附近的旱涝特征,运用Morlet小波分析技术,对关中平原近51年来降水Z指数与太阳黑子的小波系数变化进行分析。结果表明:(1)关中平原近51年的旱涝发生频率基本相等,在90年代之后旱灾发生频率明显高于涝灾发生频率。(2)太阳黑子数与关中平原旱涝在整个60年代呈现反相关关系;自70年代开始至今,两者基本呈现正相关关系,且旱涝变化较太阳黑子数目的活动存在2年左右的"滞后期"。(3)关中平原在太阳黑子m年附近出现灾害的概率明显高于太阳黑子M年,且太阳黑子m年附近发生重、大旱灾的频率要高于重、大涝灾的频率。(4)太阳黑子与旱涝指数在9-12年周期处存在对应关系,说明太阳黑子变化对关中平原的旱涝有一定影响。 |
| [22] | 根据淮河流域 1961~2010年的月降水资料,用Z指数法分析了淮河流域旱涝灾害规律,并采用频率分析法分析了太阳黑子极值年附近的旱涝特征、Morlet小波分析 淮河流域的旱涝指数和太阳黑子数时间序列之间的周期性和相关性。结果表明,Z指数能较好地反映淮河流域旱涝灾害的实际情况,且洪涝化程度随淮河流域旱涝事 件频率增加而加大;淮河流域旱涝灾害与太阳活动有一定的对应关系,淮河水系地区分别在太阳黑子m、M年附近易发生涝灾、旱灾,旱涝指数约存在4、10、 16年的主要周期;沂沭泗水系地区在太阳黑子M年附近易出现旱灾,旱涝指数约存在3、12、30年的主要周期,但局部时间段上有较明显的相关性,随时间段 的不同,相关变化也不同。 . 根据淮河流域 1961~2010年的月降水资料,用Z指数法分析了淮河流域旱涝灾害规律,并采用频率分析法分析了太阳黑子极值年附近的旱涝特征、Morlet小波分析 淮河流域的旱涝指数和太阳黑子数时间序列之间的周期性和相关性。结果表明,Z指数能较好地反映淮河流域旱涝灾害的实际情况,且洪涝化程度随淮河流域旱涝事 件频率增加而加大;淮河流域旱涝灾害与太阳活动有一定的对应关系,淮河水系地区分别在太阳黑子m、M年附近易发生涝灾、旱灾,旱涝指数约存在4、10、 16年的主要周期;沂沭泗水系地区在太阳黑子M年附近易出现旱灾,旱涝指数约存在3、12、30年的主要周期,但局部时间段上有较明显的相关性,随时间段 的不同,相关变化也不同。 |
| [23] | 利用1951~2000年太阳10.7 cm射电流量、全国160站观测到的降水和气温距平资料,分析了太阳活动异常对中国夏季、冬季降水和气温的影响.结果表明:太阳活动强的年份,夏季南方、 东北少雨,黄河中上游流域、黄淮地区以及长江中上游则多雨;冬季全国均多雨.北方(尤其是东北和新疆)冬季气温偏高,夏季气温偏低.太阳活动弱的年份,夏 季华南及黄河以北多雨,而长江流域及以北到黄河中上游夏季则少雨;冬季全国均少雨,北方冬季气温偏低.进一步讨论了中国东北地区夏季降水与太阳活动的密切 关系. . 利用1951~2000年太阳10.7 cm射电流量、全国160站观测到的降水和气温距平资料,分析了太阳活动异常对中国夏季、冬季降水和气温的影响.结果表明:太阳活动强的年份,夏季南方、 东北少雨,黄河中上游流域、黄淮地区以及长江中上游则多雨;冬季全国均多雨.北方(尤其是东北和新疆)冬季气温偏高,夏季气温偏低.太阳活动弱的年份,夏 季华南及黄河以北多雨,而长江流域及以北到黄河中上游夏季则少雨;冬季全国均少雨,北方冬季气温偏低.进一步讨论了中国东北地区夏季降水与太阳活动的密切 关系. |
| [24] | 近28年(1954—1981)逐月太阳黑子数和北半球500hPa各海洋副高面积指数存在着十分显著的后延l—3年的高相关.后者的功率谱分析显示出存在着明显的11和22年振动,且和太阳活动相应的周期很好地耦合.西太平洋副高面积(强度)指数最显著的周期为11年,其次才是受赤道东太平洋海温影响的3.67年振动. . 近28年(1954—1981)逐月太阳黑子数和北半球500hPa各海洋副高面积指数存在着十分显著的后延l—3年的高相关.后者的功率谱分析显示出存在着明显的11和22年振动,且和太阳活动相应的周期很好地耦合.西太平洋副高面积(强度)指数最显著的周期为11年,其次才是受赤道东太平洋海温影响的3.67年振动. |
| [25] | 文章利用旱涝灾害历史记载与现代器测降水资料重建长江中下游旱涝灾害等级序列,并通过相关分析与波谱分析、交叉谱分析等分别探讨了长江中下游旱涝灾害发生与东太平洋海水表面温度(SST)以及太阳活动(太阳黑子数)的关系。结果表明,长江中下游涝灾多发生于气候过渡期,即涝灾在气候由一种气候状态向另一种气候状态转变时期多发。谱分析与交叉谱分析结果表明,长江中下游旱涝灾害等级序列在10~11年周期上与太阳黑子数存在相关,但两者有近1年的滞后性。长江中下游旱涝灾害与SST的相关关系分析表明,SST正距平年份,往往对应着长江中下游的涝灾;而SST负距平年份往往对应着长江中下游旱灾。因而可以认为,SST与太阳活动变化(太阳黑子数量变化)在不同周期频度上对长江中下游旱涝灾害具有明显影响。 . 文章利用旱涝灾害历史记载与现代器测降水资料重建长江中下游旱涝灾害等级序列,并通过相关分析与波谱分析、交叉谱分析等分别探讨了长江中下游旱涝灾害发生与东太平洋海水表面温度(SST)以及太阳活动(太阳黑子数)的关系。结果表明,长江中下游涝灾多发生于气候过渡期,即涝灾在气候由一种气候状态向另一种气候状态转变时期多发。谱分析与交叉谱分析结果表明,长江中下游旱涝灾害等级序列在10~11年周期上与太阳黑子数存在相关,但两者有近1年的滞后性。长江中下游旱涝灾害与SST的相关关系分析表明,SST正距平年份,往往对应着长江中下游的涝灾;而SST负距平年份往往对应着长江中下游旱灾。因而可以认为,SST与太阳活动变化(太阳黑子数量变化)在不同周期频度上对长江中下游旱涝灾害具有明显影响。 |
| [26] | <a name="Abs1"></a>Based on the long-term precipitation series with annual time resolution in the middle and lower reaches of the Yellow River and its four sub-regions during 1736–2000 reconstructed from the rainfall and snowfall archives of the Qing Dynasty, the precipitation cycles are analyzed by wavelet analysis and the possible climate forcings, which drive the precipitation changes, are explored. The results show that: the precipitation in the middle and lower reaches of the Yellow River has inter-annual and inter-decadal oscillations like 2–4a, quasi-22a and 70–80a. The 2–4a cycle is linked with El Ni?o events, and the precipitation is lower than normal year in the occurrence of the El Ni?o year or the next year; for the quasi-22a and the 70–80a cycles, Wolf Sun Spot Numbers and Pacific Decadal Oscillation (PDO) coincide with the two cycle signals. However, on a 70–80a time scale, the coincidence between solar activity and precipitation is identified before 1830, and strong (weak) solar activity is generally correlated to the dry (wet) periods; after 1830, the solar activity changes to 80–100a quasi-century long oscillation, and the adjusting action to the precipitation is be-coming weaker and weaker; the coincidence between PDO and precipitation is shown in the whole time series. Moreover, in recent 100 years, PDO is becoming a pace-maker of the precipitation on the 70–80a time scale. |
| [27] | <p>使用多种数学统计方法分析了德令哈地区降水量变化与太阳活动之间的关系,发现近400年来降水量的长期变化与太阳黑子周期长度(SCL)和太阳黑子周期上升支长度之间存在着较好的反相关关系,当SCL偏短、太阳黑子周期上升支长度偏短时,太阳活动偏强,德令哈地区降水量偏多,反之偏少。功率谱和小波分析发现降水量序列中存在着与太阳活动的多种周期相一致的周期,对降水量与太阳活动在不同时间尺度上周期变化之间的关系进行了详细分析。交叉小波分析发现太阳活动主要在百年左右尺度的周期变化上影响德令哈地区降水量的长期变化,太阳活动周期变化的信号越强,对降水量变化的影响越大。文章最后对太阳活动影响德令哈地区降水量变化的可能机制进行了探讨。</p> . <p>使用多种数学统计方法分析了德令哈地区降水量变化与太阳活动之间的关系,发现近400年来降水量的长期变化与太阳黑子周期长度(SCL)和太阳黑子周期上升支长度之间存在着较好的反相关关系,当SCL偏短、太阳黑子周期上升支长度偏短时,太阳活动偏强,德令哈地区降水量偏多,反之偏少。功率谱和小波分析发现降水量序列中存在着与太阳活动的多种周期相一致的周期,对降水量与太阳活动在不同时间尺度上周期变化之间的关系进行了详细分析。交叉小波分析发现太阳活动主要在百年左右尺度的周期变化上影响德令哈地区降水量的长期变化,太阳活动周期变化的信号越强,对降水量变化的影响越大。文章最后对太阳活动影响德令哈地区降水量变化的可能机制进行了探讨。</p> |
| [28] | 根据历史文献记载重建的过去 2000年中国东部63个点(地区)旱涝等级数据及集成28条代用资料重建的中国温度变化最新序列,采用各级旱涝发生几率的比率差指标,研究了百年尺度寒 冷时段(440~540年、780~920年、1390~1460年、1600~1700年、1800~1900年)和温暖时段(650~750年、 1000~1100年、1190~1290年、1900~2000年)的中国东部旱涝格局.结果发现,每个寒冷、温暖时段的旱涝格局虽各不相同,但在多数 温暖时段,长江以北地区总体偏旱、以南地区涝.分析表明:寒冷时段的旱涝格局呈自东向西带状分布,115°E以东涝、以西则旱涝相间;温暖时段则呈自南向 北的带状分布,25°N以南地区旱、25°~30°N之间涝、30°N以北地区旱,但黄土高原地区涝.冷、暖时段旱涝格局对比显示,气候由寒冷转为温暖可 能会导致华北地区干旱与湘、赣流域雨涝几率同时增加. . 根据历史文献记载重建的过去 2000年中国东部63个点(地区)旱涝等级数据及集成28条代用资料重建的中国温度变化最新序列,采用各级旱涝发生几率的比率差指标,研究了百年尺度寒 冷时段(440~540年、780~920年、1390~1460年、1600~1700年、1800~1900年)和温暖时段(650~750年、 1000~1100年、1190~1290年、1900~2000年)的中国东部旱涝格局.结果发现,每个寒冷、温暖时段的旱涝格局虽各不相同,但在多数 温暖时段,长江以北地区总体偏旱、以南地区涝.分析表明:寒冷时段的旱涝格局呈自东向西带状分布,115°E以东涝、以西则旱涝相间;温暖时段则呈自南向 北的带状分布,25°N以南地区旱、25°~30°N之间涝、30°N以北地区旱,但黄土高原地区涝.冷、暖时段旱涝格局对比显示,气候由寒冷转为温暖可 能会导致华北地区干旱与湘、赣流域雨涝几率同时增加. |
| [29] | The spatial patterns of precipitation anomalies during five 30-yr warm periods of 691-720, 1231-1260, 1741-1770, 1921-1950, and 1981-2000 were investigated using a dryness/wetness grading dataset covering 48 stations from Chinese historical documents and 22 precipitation proxy series from natural archives. It was found that the North China Plain (approximately 35 -40 N, east of 105 E) was dry in four warm periods within the centennial warm epochs of 600-750, the Medieval Warm Period (about 900-1300) and after 1900. A wet condition prevailed over most of China during 1741-1770, a 30-yr warm peak that occurred during the Little Ice Age (about 1650-1850). The spatial pattern of the precipitation anomaly in 1981-2000 over East China (25 -40 N, east of 105 E) is roughly consistent with that in 1231-1260, but a difference in the precipitation anomaly appeared over the Tibetan Plateau. The spatial patterns of the precipitation anomalies over China varied between all five 30-yr warm periods, which implies that the matching pattern between temperature and precipitation change is multiform, and the precipitation anomaly could be positive or negative when a decadal warm climate occurs in different climate epochs. This result may provide a primary reference for the mechanism detection and climate simulation of the precipitation anomaly of the future warm climate. |
| [30] | Context. Long-term records of solar radiative output are vital for understanding solar variability and past climate change. Measurements of solar irradiance are available for only the last three decades, which calls for reconstructions of this quantity over longer time scales using suitable models. Aims: We present a physically consistent reconstruction of the total solar irradiance for the Holocene. Methods: We extend the SATIRE (Spectral And Total Irradiance REconstruction) models to estimate the evolution of the total (and partly spectral) solar irradiance over the Holocene. The basic assumption is that the variations of the solar irradiance are due to the evolution of the dark and bright magnetic features on the solar surface. The evolution of the decadally averaged magnetic flux is computed from decadal values of cosmogenic isotope concentrations recorded in natural archives employing a series of physics-based models connecting the processes from the modulation of the cosmic ray flux in the heliosphere to their record in natural archives. We then compute the total solar irradiance (TSI) as a linear combination of the jth and jth + 1 decadal values of the open magnetic flux. In order to evaluate the uncertainties due to the evolution of the Earth's magnetic dipole moment, we employ four reconstructions of the open flux which are based on conceptually different paleomagnetic models. Results: Reconstructions of the TSI over the Holocene, each valid for a different paleomagnetic time series, are presented. Our analysis suggests that major sources of uncertainty in the TSI in this model are the heritage of the uncertainty of the TSI since 1610 reconstructed from sunspot data and the uncertainty of the evolution of the Earth's magnetic dipole moment. The analysis of the distribution functions of the reconstructed irradiance for the last 3000 years, which is the period that the reconstructions overlap, indicates that the estimates based on the virtual axial dipole moment are significantly lower at earlier times than the reconstructions based on the virtual dipole moment. We also present a combined reconstruction, which represents our best estimate of total solar irradiance for any given time during the Holocene. Conclusions: We present the first physics-based reconstruction of the total solar irradiance over the Holocene, which will be of interest for studies of climate change over the last 11 500 years. The reconstruction indicates that the decadally averaged total solar irradiance ranges over approximately 1.5 W/mfrom grand maxima to grand minima.Source Paper |
| [31] | <a name="Abs1"></a>A reconstruction of sunspot numbers for the last 1000 years was obtained using a sum of sine waves derived from spectral analysis of the time series of sunspot number <i>R</i><sub>z</sub> for the period 1700–1999. The time series was decomposed in frequency levels using the wavelet transform, and an iterative regression model (ARIST) was used to identify the amplitude and phase of the main periodicities. The 1000-year reconstructed sunspot number reproduces well the great maximums and minimums in solar activity, identified in cosmonuclides variation records, and, specifically, the epochs of the Oort, Wolf, Spörer, Maunder, and Dalton Minimums as well the Medieval and Modern Maximums. The average sunspot number activity in each anomalous period was used in linear equations to obtain estimates of the solar radio flux <i>F</i><sub>10.7</sub>, solar wind velocity, and the southward component of the interplanetary magnetic field. |
| [32] | ABSTRACT The end of the current solar minimum is at least 2 years late, and indicators of solar and geomagnetic activity are approaching or are at their historical lows. We examine current indicators to determine how unprecedented this solar cycle might be, comment on possible earlier analogs to the current situation, and discuss attempts to predict future sunspot maxima on the basis of geomagnetic and solar magnetic data. Accompanying the change in the solar magnetic field has been a significant, albeit small, change in the total solar irradiance. Thus, the coming solar cycle(s) may provide an opportunity to separate the climatic effects of solar and anthropogenic sources. |
| [33] | |
| [34] | <p>本文利用我国的历史气候记载,为东部6区域重建了最近1033年的时间分辨率为1年的区域于湿气候序列,讨论其可靠性,并分析其变化的准周期性和跃变特征。跃变分析采用移动t检验方法,分析各区域干湿气候的世纪尺度和10~20年尺度的跃变现象,辨识跃变信号的参考年代,指出北方各区域的跃变趋势相同,但有时与长江下游地区相反,以及跃变信号在寒冷气候背景下较多出现等特点。</p> . <p>本文利用我国的历史气候记载,为东部6区域重建了最近1033年的时间分辨率为1年的区域于湿气候序列,讨论其可靠性,并分析其变化的准周期性和跃变特征。跃变分析采用移动t检验方法,分析各区域干湿气候的世纪尺度和10~20年尺度的跃变现象,辨识跃变信号的参考年代,指出北方各区域的跃变趋势相同,但有时与长江下游地区相反,以及跃变信号在寒冷气候背景下较多出现等特点。</p> |
| [35] | 全球气候变化是一个复杂的科学 问题,它涉及到气候系统或地球系统的变化,不但需要考虑它们所包含的这些系统内各部分本身的变化,以及它们之间复杂的相互作用,而且还需考虑物理与地球生 物化学等许多过程.文章主要讨论全球气候变化中的物理问题,主要有三个方面:(1)辐射传输和全球辐射平衡:不论是由于自然的原因或人类活动(如太阳活动 与火山爆发以及温室气体排放增加导致的温室效应加强)一旦破坏全球的辐射平衡,则会引起气候变化,这是气候变化的主要原因与驱动力;(2)大气波动和气候 变化的内部变率:除上述外强迫的作用外,气候变化还可由气候系统内部的变率引起,这包括大气内部变率和耦合气候变率.它们主要是通过产生各种大气的波动而 实现的.其中最重要的是罗斯贝(Rossby)波.它们的传播和不稳定发展是造成气候变化的另一个原因;(3)气候系统的混沌性质和可预报性:数值预报模 式的预报结果对初始场很敏感,即初始场的微小误差可导致完全不同的预报结果,同时模式中物理过程描述的真实程度也影响预报的结果.大气的这种混沌性质限制 了天气的可预报性在2周以内.但气候预测由于明显受外强迫的作用,可使大气的混沌时效延长到月、季、年、几十年甚至上百年.为了减少由初始场误差和模式不 完善而造成的预报误差,目前气候预报是采用多初值和多模式的集合预报方法,因而气候预测实际上是一种概率预报. . 全球气候变化是一个复杂的科学 问题,它涉及到气候系统或地球系统的变化,不但需要考虑它们所包含的这些系统内各部分本身的变化,以及它们之间复杂的相互作用,而且还需考虑物理与地球生 物化学等许多过程.文章主要讨论全球气候变化中的物理问题,主要有三个方面:(1)辐射传输和全球辐射平衡:不论是由于自然的原因或人类活动(如太阳活动 与火山爆发以及温室气体排放增加导致的温室效应加强)一旦破坏全球的辐射平衡,则会引起气候变化,这是气候变化的主要原因与驱动力;(2)大气波动和气候 变化的内部变率:除上述外强迫的作用外,气候变化还可由气候系统内部的变率引起,这包括大气内部变率和耦合气候变率.它们主要是通过产生各种大气的波动而 实现的.其中最重要的是罗斯贝(Rossby)波.它们的传播和不稳定发展是造成气候变化的另一个原因;(3)气候系统的混沌性质和可预报性:数值预报模 式的预报结果对初始场很敏感,即初始场的微小误差可导致完全不同的预报结果,同时模式中物理过程描述的真实程度也影响预报的结果.大气的这种混沌性质限制 了天气的可预报性在2周以内.但气候预测由于明显受外强迫的作用,可使大气的混沌时效延长到月、季、年、几十年甚至上百年.为了减少由初始场误差和模式不 完善而造成的预报误差,目前气候预报是采用多初值和多模式的集合预报方法,因而气候预测实际上是一种概率预报. |
| [36] | Observations since the middle of the 19th century show that the decadal solar oscillation at its peaks strengthens the major convergence zones in the tropical Pacific (Intertropical Convergence Zone, ITCZ, and South Pacific Convergence Zone, SPCZ) during northern winter. Through an amplifying set of coupled feedbacks, a set of processes is described that link solar forcing and its response in the tropical Pacific with reductions in precipitation in the northwest United States. The process begins with an increase in solar forcing which results in a strengthening of the major convergence zones in the tropical Pacific. This then increases the precipitation in those regions and increases the southeast trade winds. Stronger trades increase the upwelling of colder water in the eastern equatorial Pacific and extend the cold tongue westward, thus reducing precipitation in the western Pacific. This redistribution of diabatic heating and associated convective heating anomalies thus produces anomalies in the tropical Hadley (north-south) and Walker (east-west) circulations. The former weakens as subsidence in equatorial latitudes is enhanced; the latter strengthens and extends westward. Additionally, the resulting anomalous Rossby wave response in the atmosphere, and consequent positive sea level pressure anomalies in the eastern region of the Aleutian low in the North Pacific that extends to western North America, is associated with reductions of precipitation in the northwest United States. The response of the climate system to solar forcing is manifested as a strengthening of the climatological precipitation maxima in the tropics. |
| [37] | |
| [38] | As a result of global warming, precipitation is likely to increase in high latitudes and the tropics and to decrease in already dry subtropical regions(1). The absolute magnitude and regional details of such changes, however, remain intensely debated(2,3). As is well known from El Nino studies, sea-surface-temperature gradients across the tropical Pacific Ocean can strongly influence global rainfall(4,5). Palaeoproxy evidence indicates that the difference between the warm west Pacific and the colder east Pacific increased in past periods when the Earth warmed as a result of increased solar radiation(6-9). In contrast, in most model projections of future greenhouse warming this gradient weakens(2,10,11). It has not been clear how to reconcile these two findings. Here we show in climate model simulations that the tropical Pacific sea-surface-temperature gradient increases when the warming is due to increased solar radiation and decreases when it is due to increased greenhouse-gas forcing. For the same global surface temperature increase the latter pattern produces less rainfall, notably over tropical land, which explains why in the model the late twentieth century is warmer than in the Medieval Warm Period (around AD 1000-1250) but precipitation is less. This difference is consistent with the global tropospheric energy budget(12), which requires a balance between the latent heat released in precipitation and radiative cooling. The tropospheric cooling is less for increased greenhouse gases, which add radiative absorbers to the troposphere, than for increased solar heating, which is concentrated at the Earth's surface. Thus warming due to increased greenhouse gases produces a climate signature different from that of warming due to solar radiation changes. |
| [39] | 太阳活动与气候变化的关系急需深入进行探索性研究,本文的分析研 究表明,中国东部夏季降水与太阳活动有明显的关系.强(弱)太阳活动年,华北平原和东北南部地区少(多)雨,西北地区却多(少)雨,而江淮地区的夏季降水 量也偏多(少);太阳活动与夏季的梅雨量存在着既显著又复杂的相关关系,而且它们间的相关关系还随时间有年代际变化.强(弱)太阳活动有利于在中国上空造 成500 hPa位势高度出现正(负)异常,并与夏季降水异常的形势较为相配,可认为是太阳活动影响中国东部降水的重要途经.尽管目前尚未形成完整的理论,但基于已 有的观测和分析研究,作为一个讨论内容,我们提出了一些关于太阳活动影响天气气候变化的初步看法. . 太阳活动与气候变化的关系急需深入进行探索性研究,本文的分析研 究表明,中国东部夏季降水与太阳活动有明显的关系.强(弱)太阳活动年,华北平原和东北南部地区少(多)雨,西北地区却多(少)雨,而江淮地区的夏季降水 量也偏多(少);太阳活动与夏季的梅雨量存在着既显著又复杂的相关关系,而且它们间的相关关系还随时间有年代际变化.强(弱)太阳活动有利于在中国上空造 成500 hPa位势高度出现正(负)异常,并与夏季降水异常的形势较为相配,可认为是太阳活动影响中国东部降水的重要途经.尽管目前尚未形成完整的理论,但基于已 有的观测和分析研究,作为一个讨论内容,我们提出了一些关于太阳活动影响天气气候变化的初步看法. |
| [40] | The precipitation variations of Longxi area, northeast margin of the Tibetan Plateau since AD 960 are reconstructed from Chinese historical documentary records. These records show that since AD 960, the precipitation of Longxi decreased and reached the lowest level at the end of the 17th and the 18th centuries. After this period, the precipitation gradually increased. The three short wet periods of Longxi in the last millennium were: from the end of the 10th century to the early years of the 11th century, from the end of the 12th century to the early years of the 13th century and during the first half of the 20th century. The precipitation variations coincide well with variations of the Northern Hemisphere temperature and the atmospheric C concentration, as well as the averaged Be concentration and the reconstructed solar modulation record which show that solar activity may be an important driving force of the precipitation variations of Longxi on multi-decadal to centennial scales during the last millennium. Solar activity controls the motion of the north edge of the Asian summer monsoon by affecting the Asia summer monsoon intensity, the East Asian winter monsoon intensity and the locations of westerlies, thus further dominating precipitation variations of Longxi. Synchronous variations of Longxi precipitation and Northern Hemisphere temperature may also be ascribed to the same control of solar activity. |
| [41] | <p>基于对福建屏南仙山泥炭沉积物中物理化学性质十分稳定的α-纤维素的提取及其碳同位素分析,重建了研究区距今1 400 a 以来的气候演化历史。研究结果显示:仙山泥炭钻孔中α-纤维素δ<sup>13</sup>C 值的变化范围为-26.6‰~-11.3‰,其大幅度的波动特征主要与区域降水控制的盆地沉积环境变化有关,当降水偏多时盆地积水形成类似湖泊的水下沉积环境,沉积物中有机质主要来源于δ<sup>13</sup>C值偏重的沉水植物;反之则以δ<sup>13</sup>C值偏轻的沼泽植物为主。依据AMS14<sup>14</sup>C测年的结果,距今1 400 a 以来研究区经历了气候偏湿(AD 600~910 年)-偏干(AD910~1640 年)-偏湿(AD 1640 年至今)3 个变化阶段。在数十年至百年时间尺度上,纤维素δ<sup>13</sup>C记录中出现的降水减少时期与太阳活动极小期(中世纪极小期、欧特极小期、沃夫极小期、史波勒极小期、蒙德极小期和道尔顿极小期)一一对应,两者呈现正相关关系,揭示太阳活动的减弱是控制研究区降水减少的主要因素,为预测区域降水变化趋势提供了依据。</p> . <p>基于对福建屏南仙山泥炭沉积物中物理化学性质十分稳定的α-纤维素的提取及其碳同位素分析,重建了研究区距今1 400 a 以来的气候演化历史。研究结果显示:仙山泥炭钻孔中α-纤维素δ<sup>13</sup>C 值的变化范围为-26.6‰~-11.3‰,其大幅度的波动特征主要与区域降水控制的盆地沉积环境变化有关,当降水偏多时盆地积水形成类似湖泊的水下沉积环境,沉积物中有机质主要来源于δ<sup>13</sup>C值偏重的沉水植物;反之则以δ<sup>13</sup>C值偏轻的沼泽植物为主。依据AMS14<sup>14</sup>C测年的结果,距今1 400 a 以来研究区经历了气候偏湿(AD 600~910 年)-偏干(AD910~1640 年)-偏湿(AD 1640 年至今)3 个变化阶段。在数十年至百年时间尺度上,纤维素δ<sup>13</sup>C记录中出现的降水减少时期与太阳活动极小期(中世纪极小期、欧特极小期、沃夫极小期、史波勒极小期、蒙德极小期和道尔顿极小期)一一对应,两者呈现正相关关系,揭示太阳活动的减弱是控制研究区降水减少的主要因素,为预测区域降水变化趋势提供了依据。</p> |
| [42] | Temporal changes in the power of the longwave radiation of the system Earth-atmosphere emitted to space always lag behind changes in the power of absorbed solar radiation due to slow change of its enthalpy. That is why the debit and credit parts of the average annual energy budget of the terrestrial globe with its air and water envelope are practically always in an unbalanced state. Average annual balance of the thermal budget of the system Earth-atmosphere during long time period will reliably determine the course and value of both an energy excess accumulated by the Earth or the energy deficit in the thermal budget which, with account for data of the TSI forecast, can define and predict well in advance the direction and amplitude of the forthcoming climate changes. From early 90s we observe bicentennial decrease in both the TSI and the portion of its energy absorbed by the Earth. The Earth as a planet will henceforward have negative balance in the energy budget which will result in the temperature drop in approximately 2014. Due to increase of albedo and decrease of the greenhouse gases atmospheric concentration the absorbed portion of solar energy and the influence of the greenhouse effect will additionally decline. The influence of the consecutive chain of feedback effects which can lead to additional drop of temperature will surpass the influence of the TSI decrease. The onset of the deep bicentennial minimum of TSI is expected in 2042卤11, that of the 19th Little Ice Age in the past 7500 years 鈥 in 2055卤11. |
| [43] | |
| [44] | . 利用近50年华北地区26个站逐月降水观测资料和全球大气海洋分析资料,分析了华北降水的年代际变化特征及其和全球海气系统年代际变化的关系.对华北降水距平指数变化分析表明,近50年来华北降水具有减少的总体趋势,叠加在该趋势之上的是年代际变化,其中1965年和1980年发生了两次跃变,使得20世纪80年代干旱尤为严重.在对华北地区降水年代际变化特征分析的基础上,揭示了与华北降水年代际异常相伴随的大气环流和上层海洋热力异常型.结果表明,华北降水年代际异常与太平洋上层海洋热力状况异常有显著关系,主要表现为太平洋年代际振荡(PDO)与华北降水异常的相关.在年代际时间尺度上,华北干旱与上层海洋热力及大气环流异常的配置关系如下:当华北地区干旱时,则热带中东太平洋海温偏高,北太平洋中部海温偏低,即太平洋上主要表现为PDO暖位相,全球大部分地区(包括华北地区)气温偏高,青藏高原地区气温偏低,日本北部及东西伯利亚气压异常偏低,华北及其以南大片地区气压偏高,华北地区由异常西北风控制,不利于水汽向华北地区输送. . 利用近50年华北地区26个站逐月降水观测资料和全球大气海洋分析资料,分析了华北降水的年代际变化特征及其和全球海气系统年代际变化的关系.对华北降水距平指数变化分析表明,近50年来华北降水具有减少的总体趋势,叠加在该趋势之上的是年代际变化,其中1965年和1980年发生了两次跃变,使得20世纪80年代干旱尤为严重.在对华北地区降水年代际变化特征分析的基础上,揭示了与华北降水年代际异常相伴随的大气环流和上层海洋热力异常型.结果表明,华北降水年代际异常与太平洋上层海洋热力状况异常有显著关系,主要表现为太平洋年代际振荡(PDO)与华北降水异常的相关.在年代际时间尺度上,华北干旱与上层海洋热力及大气环流异常的配置关系如下:当华北地区干旱时,则热带中东太平洋海温偏高,北太平洋中部海温偏低,即太平洋上主要表现为PDO暖位相,全球大部分地区(包括华北地区)气温偏高,青藏高原地区气温偏低,日本北部及东西伯利亚气压异常偏低,华北及其以南大片地区气压偏高,华北地区由异常西北风控制,不利于水汽向华北地区输送. |
| [45] | 采用中国160站降水资料、NOAA ERSST海温资料以及ERA-40大气再分析资料, 分析了中国东部夏季降水型的年代际变化特征及其与北太平洋海温的可能联系。结果表明: 中国东部夏季降水型在近50年中经历了两次年代际变化, 第1次发生在20世纪70年代中后期, 北太平洋中纬度地区冬季海温由正距平向负距平转变, 太平洋年代际振荡(PDO, Pacific decadal oscillation) 由负位相向正位相转变, 通过影响东亚夏季风环流, 使东亚夏季风减弱, 中国东部夏季降水从北到南呈现出“+-+” 转变为“-+-”的三极分布形态, 这次年代际变化体现了同一模态正负位相的转变; 第2次发生在20世纪80年代末90年代初, 北太平洋海温转变为日本以南西北太平洋的正距平分布, 同时菲律宾群岛附近海温偏暖, 西太平洋副热带高压偏南偏西, 使得中国东部夏季降水由北至南转变成“-+”的偶极分布形态, 这次年代际变化体现了一种模态向另一种模态的转变。 . 采用中国160站降水资料、NOAA ERSST海温资料以及ERA-40大气再分析资料, 分析了中国东部夏季降水型的年代际变化特征及其与北太平洋海温的可能联系。结果表明: 中国东部夏季降水型在近50年中经历了两次年代际变化, 第1次发生在20世纪70年代中后期, 北太平洋中纬度地区冬季海温由正距平向负距平转变, 太平洋年代际振荡(PDO, Pacific decadal oscillation) 由负位相向正位相转变, 通过影响东亚夏季风环流, 使东亚夏季风减弱, 中国东部夏季降水从北到南呈现出“+-+” 转变为“-+-”的三极分布形态, 这次年代际变化体现了同一模态正负位相的转变; 第2次发生在20世纪80年代末90年代初, 北太平洋海温转变为日本以南西北太平洋的正距平分布, 同时菲律宾群岛附近海温偏暖, 西太平洋副热带高压偏南偏西, 使得中国东部夏季降水由北至南转变成“-+”的偶极分布形态, 这次年代际变化体现了一种模态向另一种模态的转变。 |
