 , 付光辉
, 付光辉Spatial and temporal variation and trend evolution of county-based agricultural greenhouse gas emissions in Jiangsu Province
CHENHui, FUGuanghui通讯作者:
收稿日期:2017-10-12
修回日期:2018-03-11
网络出版日期:2018-05-10
版权声明:2018《资源科学》编辑部《资源科学》编辑部
基金资助:
作者简介:
-->
展开
摘要
关键词:
Abstract
Keywords:
-->0
PDF (9698KB)元数据多维度评价相关文章收藏文章
本文引用格式导出EndNoteRisBibtex收藏本文-->
1 引言
农业生产过程所产生的温室气体在整个生产活动的温室气体排放总量中占很大比例[1],对气候变暖影响不可忽视[2],测算农业温室气体排放量,分析其时空差异和趋势演进,对指导区域农业节能减排具有重要作用。当前中国农业的快速发展加大了温室气体排放,据测算中国农业温室气体排放以平均每年5%的速度持续增长[3],农业温室气体排放一直是研究的热点。目前农业温室气体排放领域的研究主要侧重于农业温室气体排放核算、温室气体排放跨区域对比[4]、驱动因素[5]以及公平性、减排交易[6]等方面,研究重点仍集中在测算体系的建立和驱动因素的确定上。如尚杰等多位****测算了中国农业温室气体排放量[1],并分析了其影响因素[7,8,9];张明洁等、李苒等、康涛等测算了海南、安徽等区域的农业温室气体排放量[10,11,12];而马翠萍等、戴小文等测算了农业隐含温室气体排放 [13,14]。李博等、庞丽等、文清等对农业温室气体排放驱动因素进行了研究,认为在省域层面呈现较为明显的空间非均衡性[15,16,17]。随着研究的深入,从时间、空间角度分析农业温室气体排放阶段特征和区域差异逐步引起了关注[2,18-20]。如尧波等从县域层面分析了2000—2010年江西省农业温室气体排放的时空动态及其影响因素[21]。目前温室气体排放公平性分析也越来越受到关注,主要研究方法有基尼系数、生态经济贡献模型、3E评价模型等[22,23,24]。综上所述,当前农业温室气体排放研究仍较为宏观,主要从全国角度分析温室气体排放在时间尺度上的发展状况,或从省域角度分析某一时间节点的状况,而对于作为最基本行政单元、直接承担农业节能减排任务的县域水平的研究还较少,无法从微观县域层面定量化刻画排放区域差异性,从而存在一定的局限性。
本文参照前人的农业温室气体排放测算体系,从微观的县域角度,分析2001—2014年江苏省62个县域单元农业温室气体排放量、排放强度的空间格局变动、时空差异演变,对各县域间相互关系进行量化分析,全面揭示排放的时空性、差异性,为江苏省及各县市制定农业节能减排政策、实现低碳农业提供科学依据,也为从微观县域层面在时间和空间2个维度上深化温室气体排放研究提供新思路。
2 研究区概况与数据来源
江苏省土地面积10.72万km2,地势平坦,气候温和,雨量适中,四季分明。江苏既是经济大省又是农业大省,2016年常住人口7998.6万,实现GDP 76 086.2亿元,粮食播种面积543.3万hm2,高标准农田比重达56%,粮食总产量3466万t,农业科技进步贡献率67% [25]。为保证数据的连续性,本文以江苏省2014年行政区划为基准,除南京市仍按照现行区划分(南京市下辖全部为“区”,无县市)外,将其余每个设区市的市辖区作为一个县域单元,这样共划分62个县域单元作为研究单元,时间序列为2001—2014年。
本文的人口、GDP数据来源于2002—2015年《江苏统计年鉴》[26],其余数据均来源于2002—2015年《江苏省农村统计年鉴》[27]。
3 研究方法
3.1 排放量及强度测算方法
本文参考相关研究成果,测算各县域单元农业温室气体排放量(表1),并引入排放强度这一指标,衡量排放量与农业经济水平的关系。农业温室气体排放强度(CI)的计算公式为:式中G为农业温室气体排放量(万t);A为当年农业总产值(万元)。
Table 1
表1
表1江苏省主要农业温室气体排放量测算体系
Table 1Estimation system of main agricultural greenhouse gases in Jiangsu Province
| 温室气体 | 主要途径 | 计算公式 | 说明 | 参考文献 |
|---|---|---|---|---|
| CO2 | 化肥生产、农业机械和用电 | CO2为农业CO2排放总量;F为化肥使用量;Area为农作物种植面积;Machine为农业机械总动力;Electric为农业生产用电总量;k1、k2、k3、k4为碳转换系数,其中k1=857.54,k2=16.47,k3=0.18,k4=0.18 | [11,28] | |
| CH4 | 稻田CH4排放 | CH4-水稻为稻田CH4排放量;EF水稻为224.6 kg/hm2;Area水稻为水稻年播种面积 | [11] | |
| 蓄养动物CH4排放 | CH4-动物为蓄养动物CH4排放量;Ti为饲养量; | [1] | ||
| N2O | 农田土壤N2O | N2O-土壤为农田土壤N2O排放量;P为年降水量;N为施氮量;Area化肥为化肥使用面积 | [11] | |
| 蓄养动物粪便管理N2O排放 | N2O-动物为蓄养动物N2O排放量;Ti为饲养量;γi为粪便发酵的N2O排放系数 | [1] | ||
| 剩余农产品N2O排放 | N2O-剩余农产品为剩余农产品N2O排放量;N剩余农产品为剩余农产品总含氮量 | [11] | ||
| 排放总量 | Gi为第i个县域单元农业温室气体排放量 | [11] |
新窗口打开
3.2 标准差和变异系数
通常使用标准差(S)和变异系数(V)从相对和绝对意义上测度区域间的差异[21],其数值越大,表明差距越大。式中Gi为第i个县域单元的排放量(或排放强度);n为县域单元个数;
3.3 农业发展承载贡献差异分析
采用田云等[22]构建的基尼系数、农业温室气体排放承载系数(ESC)和农业经济贡献系数(ECC)来对比各县域单元农业温室气体排放对农业发展的承载力和经济贡献程度,其公式如下:式中CAi、CA分别为第i个县域单元和全省农业温室气体吸收量;Ai和A分别为第i个县域单元和全省农业总产值;Gi和G为第i个县域单元和全省排放量。其中,CAi/CA、Ai/A为第i个县域单元农业温室气体吸收量贡献率、农业总产值贡献率;Gi/G为第i个县域单元农业温室气体排放量贡献率。若ESC>1,表明该县域单元农业温室气体吸收所占全省比重大于其温室气体排放,具有较高的农业温室气体生态容量,能为其他县域单元带来正外部性效应;反之,则说明该县域单元具有较低的温室气体生态容量,其引发的农业温室气体排放需其他县域单元分担,从而影响其他区域的利益。若ECC>1,表明该县域单元农业经济贡献率大于农业温室气体排放贡献率,农业经济贡献较高;反之,则说明该县域单元农业经济贡献率小于农业温室气体排放贡献率,农业经济贡献总体较低,由此导致的高排放影响了其他县域单元的利益。
其中,农业温室气体吸收量采用田云等和韩召迎等[22,29]提出的方法和参数计算,其公式为:
式中CAi为第i个县域单元农作物温室气体吸收量;CAj为第j种农作物的温室气体吸收量;k为农作物种类数;cj为农作物通过光合作用合成单位有机质所需吸收的温室气体;Yj为农作物的经济产量;r为农作物经济产品的含水量;HIj为农作物经济系数。
4 结果与分析
4.1 年际变化分析
江苏省农业温室气体排放总量大幅增加,由2001年9477.69万t增加到2014年11 500.08万t,年均增加1.64%(图1a),大致可分为4个阶段:①大幅下降期(2001—2003年),温室气体排放量由9477.69万t下降至8151.52万t,环比降幅达13.99%;②大幅增长期(2003—2005年),年均增加10.52%,受2003年异常减少的影响,该阶段出现最大增幅,达18.98%;③小幅下降期(2005—2007年),年均降幅5.37%;④快速上涨期(2007—2014年),排放量迅速增加,年均增加4.37%。由于历年农业总产值的持续增长,排放强度年际变化表现为明显下降趋势(图1b),年均降幅达4.26%,表明其经济效率逐步提高。 显示原图|下载原图ZIP|生成PPT
图1江苏省农业温室气体排放量及排放强度变化情况
-->Figure 1Changes of agricultural greenhouse gas emissions and emission intensity in Jiangsu Province
-->
4.2 时空差异分析
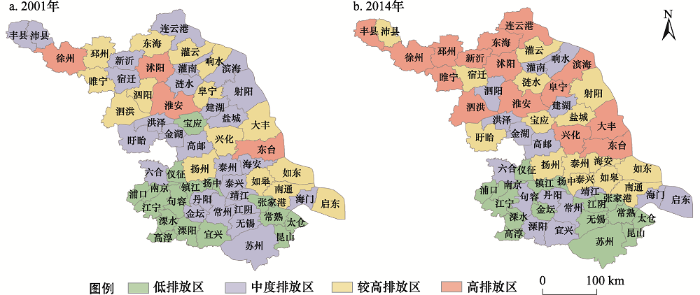
4.2.1 县域空间格局变动为加强可比性,按照2014年排放量、排放强度均值的0.5倍以下、0.5~1.0倍、1.0~1.5倍、1.5倍以上4个区间将各县域单元划分高、较高、中度、低4种排放区和Ⅰ、Ⅱ、Ⅲ和Ⅳ4级排放强度类型区[21](图2、图3)。
 显示原图|下载原图ZIP|生成PPT
图22001年、2014年农业温室气体排放量分布注:图中“南京”等地级市,指该市市辖区,下同;该图基于江苏省标准地图服务网站下载的审图号为苏S(2013)115号的标准地图制作,底图无修改。
-->Figure 2Distribution chart of agricultural greenhouse gas emissions in 2001, 2014
-->
 显示原图|下载原图ZIP|生成PPT
图32001年、2014年农业温室气体排放强度分布注:该图基于江苏省标准地图服务网站下载的审图号为苏S(2013)115号的标准地图制作,底图无修改。
-->Figure 3Distribution of agricultural greenhouse gas emission intensity in 2001, 2014
-->
从排放量来看,高排放区数量明显增加,2014年比2001年增加了12个,中度排放区逐步演变为较高、高排放区(图2)。而且空间集聚特征明显,高排放区集中于苏北地区和沿海地区中部,且高值区域逐渐向此处集聚,这与该区域农业经济快速发展有关,该区域农业基础相对薄弱,又是承载全省粮食自给和安全的重要区域,其农业投入增速较大,但发展仍相对粗放,是排放量增加的重要因素。如由较高排放区转变为高排放区的睢宁县,2014年比2001年农业总产值增长了4.6倍,排放量增加了1.9倍,其单位播种面积使用的农业机械总动力也同步增加了2.1倍,是经济较发达的昆山市1.3倍,可见其农业发展仍相对粗放。
排放强度更便于横向比较(图3)[30]。从数量上看,2001年排放强度Ⅰ级4个、Ⅱ级7个、Ⅲ级3个、Ⅳ级48个,2014年依次为16个、17个、13个、16个。2001年排放强度相对集中于Ⅳ级,之后逐步向均衡化发展,到2014年分布已经相对离散。2001年排放强度高值遍布全省,而2014年则相对集中于苏北地区中部、苏中部分区域,与高排放区分布大致相同。
4.2.2 县域差异演变
2001—2014年各县域单元间排放量标准差由610上升到903,年均增长3.69%;变异系数则从3.99上升到4.87,年均增长1.70%。可分3个阶段(图4a):①2001—2003年,为第一波动期,标准差在2003年达到最低值,为536;②2004—2007年,为第二波动期,两者均在2005年达到峰值;③2008年之后是后续增长期,标准差和变异系数增速年均分别为4.96%、1.82%,均高于研究时段均值,表明县域间相对、绝对差距进一步扩大。
 显示原图|下载原图ZIP|生成PPT
图4排放量和排放强度标准差与变异系数变化情况
-->Figure 4Standard deviation and variation coefficient of emission and emission intensity
-->
排放强度的相对、绝对差异变动存在一定差别,标准差明显缩小,而变异系数呈波动变化态势(图4b)。其中,标准差由16.40缩小到6.39,仅为原来的38.96%;变异系数则从4.14变动为4.24,变化较小。2006年之后,标准差逐渐变小,变异系数仍上下波动,但幅度不大,表明各县域间的相对差距越来越小,而绝对差距总体上趋于稳定。
4.3 农业发展承载贡献差异分析
4.3.1 区域差异比较采用3.4章节所述公式,计算各县域单元农业温室气体排放承载系数ESC与农业经济贡献系数ECC(表2)。
Table 2
表2
表22001年、2014年各县域单元ESC与ECC
Table 2ESC and ECC of each county in 2001, 2014
| 序号 | 地区 | 2001年 | 2014年 | 序号 | 地区 | 2001年 | 2014年 | ||||||
|---|---|---|---|---|---|---|---|---|---|---|---|---|---|
| ESC | ECC | ESC | ECC | ESC | ECC | ESC | ECC | ||||||
| 1 | 南京市辖区 | 0.85 | 1.01 | 1.02 | 1.19 | 32 | 灌云县 | 1.06 | 0.39 | 0.97 | 0.50 | ||
| 2 | 浦口区 | 1.71 | 0.47 | 1.04 | 1.67 | 33 | 灌南县 | 1.03 | 0.36 | 1.07 | 0.51 | ||
| 3 | 江宁区 | 0.60 | 0.87 | 1.23 | 1.54 | 34 | 淮安市辖区 | 0.88 | 1.13 | 1.10 | 1.27 | ||
| 4 | 六合区 | 1.12 | 0.56 | 1.05 | 0.84 | 35 | 涟水县 | 0.60 | 0.81 | 1.07 | 0.44 | ||
| 5 | 溧水区 | 1.28 | 0.56 | 1.23 | 1.02 | 36 | 洪泽县 | 1.13 | 0.27 | 1.19 | 0.63 | ||
| 6 | 高淳区 | 1.26 | 0.68 | 1.29 | 1.58 | 37 | 盱眙县 | 0.69 | 0.56 | 1.02 | 0.39 | ||
| 7 | 无锡市辖区 | 1.18 | 1.90 | 1.18 | 9.60 | 38 | 金湖县 | 1.30 | 0.28 | 1.27 | 0.50 | ||
| 8 | 江阴市 | 1.10 | 0.66 | 1.03 | 1.57 | 39 | 盐城市辖区 | 0.88 | 5.90 | 1.09 | 4.60 | ||
| 9 | 宜兴市 | 0.60 | 1.16 | 1.21 | 0.86 | 40 | 响水县 | 0.92 | 0.27 | 0.87 | 0.42 | ||
| 10 | 徐州市辖区 | 0.96 | 2.43 | 0.80 | 2.07 | 41 | 滨海县 | 1.00 | 0.48 | 0.83 | 0.35 | ||
| 11 | 丰县 | 0.82 | 0.42 | 0.62 | 0.39 | 42 | 阜宁县 | 1.12 | 0.35 | 0.95 | 0.39 | ||
| 12 | 沛县 | 0.99 | 0.54 | 0.88 | 0.68 | 43 | 射阳县 | 1.12 | 1.01 | 1.15 | 0.70 | ||
| 13 | 睢宁县 | 0.92 | 0.36 | 0.75 | 0.39 | 44 | 建湖县 | 1.29 | 0.56 | 1.16 | 0.55 | ||
| 14 | 新沂市 | 0.87 | 0.56 | 0.75 | 0.47 | 45 | 东台市 | 0.78 | 0.47 | 0.83 | 0.47 | ||
| 15 | 邳州市 | 1.05 | 0.55 | 0.82 | 0.61 | 46 | 大丰市 | 1.11 | 0.65 | 0.99 | 0.56 | ||
| 16 | 常州市辖区 | 1.04 | 2.15 | 1.03 | 3.33 | 47 | 扬州市辖区 | 1.30 | 1.62 | 1.26 | 2.14 | ||
| 17 | 溧阳市 | 0.95 | 0.69 | 1.27 | 0.74 | 48 | 宝应县 | 0.80 | 1.08 | 1.29 | 0.64 | ||
| 18 | 金坛市 | 1.27 | 0.48 | 1.11 | 0.99 | 49 | 仪征市 | 1.07 | 0.43 | 1.19 | 0.57 | ||
| 19 | 苏州市辖区 | 1.04 | 3.06 | 0.98 | 6.17 | 50 | 高邮市 | 1.33 | 0.64 | 1.32 | 0.70 | ||
| 20 | 常熟市 | 0.81 | 1.15 | 1.19 | 0.95 | 51 | 镇江市辖区 | 1.06 | 2.69 | 1.07 | 3.00 | ||
| 21 | 张家港市 | 1.18 | 0.65 | 1.20 | 1.00 | 52 | 丹阳市 | 1.13 | 0.55 | 1.25 | 0.76 | ||
| 22 | 昆山市 | 1.12 | 0.96 | 1.19 | 1.95 | 53 | 扬中市 | 1.14 | 0.83 | 1.15 | 0.95 | ||
| 23 | 太仓市 | 1.16 | 1.11 | 1.04 | 1.17 | 54 | 句容市 | 1.24 | 0.50 | 1.26 | 0.81 | ||
| 24 | 南通市辖区 | 1.14 | 3.60 | 1.10 | 3.51 | 55 | 泰州市辖区 | 1.10 | 2.06 | 1.13 | 1.80 | ||
| 25 | 海安县 | 1.00 | 0.53 | 0.93 | 0.56 | 56 | 兴化市 | 1.41 | 0.61 | 1.28 | 0.56 | ||
| 26 | 如东县 | 1.01 | 0.54 | 1.06 | 0.55 | 57 | 靖江市 | 1.01 | 0.40 | 1.08 | 0.44 | ||
| 27 | 启东市 | 0.69 | 0.66 | 0.86 | 0.83 | 58 | 泰兴市 | 0.88 | 0.42 | 1.04 | 0.44 | ||
| 28 | 如皋市 | 0.86 | 0.35 | 0.93 | 0.47 | 59 | 宿迁市辖区 | 0.94 | 2.54 | 0.97 | 1.88 | ||
| 29 | 海门市 | 0.71 | 0.54 | 0.82 | 0.73 | 60 | 沭阳县 | 1.02 | 0.44 | 1.02 | 0.44 | ||
| 30 | 连云港市辖区 | 0.87 | 2.96 | 0.95 | 1.87 | 61 | 泗阳县 | 0.83 | 0.41 | 0.95 | 0.53 | ||
| 31 | 东海县 | 0.92 | 0.38 | 0.96 | 0.39 | 62 | 泗洪县 | 0.89 | 0.37 | 0.92 | 0.38 | ||
新窗口打开
通过表2可以看出,2014年高邮市ESC居于全省第1位,其吸收量贡献率是其排放贡献率的1.32倍,生态容量较高。而丰县是ESC最低地区,仅为0.62,排在倒数2~10位大都为苏北地区北部的县域单元,生态容量较低,影响了其他地区利益。
2014年无锡市辖区ECC最高,达9.60,表明其经济贡献率是其排放贡献率的9.60倍,农业产出贡献较高;苏州市辖区、盐城市辖区分列2、3位,两地经济贡献系数值较高,分别为6.17、4.60,但与无锡市辖区相比差距较为明显;排在4~12位的地区,除昆山市外,均为地级市市辖区。滨海县是ECC最低县域单元,仅为0.35,排在倒数2~10位的地区以苏北地区中部区域为主,农业产出贡献较低。
4.3.2 排放基尼系数分析
通过测算主要指标基尼系数(图5),可以看出:2001—2014年排放量、排放强度、ESC基尼系数均值分别为0.3141、0.3018、0.0986,处于合理范围,但ECC基尼系数均值为0.4414,处于“差距较大”状态,各年均超过警戒线“0.4”,并有不断扩大的趋势。2014年ECC>1的21个县域单元排放量占全省的26.30%,但贡献了60.86%农业总产值;而ECC<1的41个县域单元仅贡献的产值仅占39.14%,却产生了73.70%的温室气体排放量。
 显示原图|下载原图ZIP|生成PPT
图52001—2014年主要指标基尼系数
-->Figure 5Gini coefficient of main indicators from 2001 to 2014
-->
总体而言,排放量、排放强度以及ESC均处于“相对合理”等级及以下;但ECC超过了“0.4”的分配差距警戒线,苏北等经济相对落后区域排放所占比重是其产值贡献率的多倍,这种情况仍有上涨的趋势,应引起特别注意。
4.3.3 农业发展承载贡献矩阵聚类分析
参照田云等的研究[22],按照ESC、ECC>1或<1的组合,采用矩阵聚类分析将62个县域单元划分为四类(图6)。
 显示原图|下载原图ZIP|生成PPT
图62001年和2014年农业发展承载贡献分类示意注:该图基于江苏省标准地图服务网站下载的审图号为苏S(2013)115号的标准地图制作,底图无修改。
-->Figure 6Chart of bearing and contribution of agricultural development categories in 2001, 2014
-->
(1)“高承载力-高经济贡献”型(以下简称“高-高”型)。这类区域的特征是生态容量大,且经济贡献高。2001年南通市辖区等9个县域单元属于“高-高”型地区,主要分布于苏南、苏中的城市市辖区,其经济条件受城市中心的影响较大。2014年增加至17个县域单元,仍以城市市辖区为主,从区域分布上看,主要是包括两大区域:一是南京大部以及苏南区域东部,以种植水稻、油菜为主;二是苏北中部城市市辖区,是为都市服务的农业区,蔬菜种植量较大。该类区域有自身的区位优势和经济条件,也有相对优越的自然环境,应进一步保持这一态势,大力发展现代化的生态农业、休闲农业、农业综合体等。
(2)“高承载力-低经济贡献”型(以下简称“高-低”型)。这类区域生态容量大,但受经济条件制约,农业生产粗放。2001年“高-低”型区域主要分布在里下河地区、沿江地区和苏北地区南部区域,涉及27个县域单元,2014年减少为23个县域单元,主要分布在里下河地区、苏南地区中部以及苏北地区中部区域。该类区域自然条件较好,种植稻麦和经济作物均适宜,但其农业经济发展相对较慢。因此在维持目前温室气体排放的基础上,保持良好的农业生态环境,应加大土地整治力度,调整农业结构,因地制宜向绿色农业方向发展,即向以“绿色环境”、“绿色技术”、“绿色产品”、“特色放心农产品”为主体的生态农业转变是提升该类区域经济效益的发展方向。
(3)“低承载力-高经济贡献”型(以下简称“低-高”型)。这类区域经济发达,农业集约化程度高,生态容量小。2001年“低-高”型主要是苏北地区城市辖区以及零星分布的宜兴市、常熟市、宝应县、南京市辖区等区域;2014年仅包括徐州、宿迁、连云港以及苏州4个市辖区,距离城市较近,受都市农业影响较大,以种植蔬菜和瓜果等供给城市的农产品为主。该类区域不应再维持这种高排放态势,鉴于其经济基础较好,应优化农业产业结构,大力发展蔬菜等设施生产,适当向林业、渔业等低碳排放行业倾斜[22],减少化肥、农药、农膜等各种农用化学品的投入,结合消费结构升级,树立绿色农产品理念,大力发展低碳农业、循环农业。
(4)“低承载力-低经济贡献”型(以下简称“低-低”型)。这类区域生态容量低,且经济欠发达。2001年“低-低”型在全省零星分布,主要集中于苏北地区中部区域;2014年则主要分布于苏北地区北部、沿海地区中部18个县域单元,这些地区畜牧业相对发达,与苏南相比,土地生产能力略差,引发了大量温室气体排放,由此导致ESC偏低。该类区域是典型的高耗低效类型区,其经济条件相对落后,应加大该区域测土配方施肥技术、土地整治等措施力度,增加资金扶持和各类财政补贴,着力提高其农用物资利用效率[22]。
5 结论与建议
5.1 结论
本文构建了农业温室气体排放县域层面区域差异分析模型,通过计算基尼系数、ESC和ECC及其矩阵聚类分析,分析了江苏省62个县域单元农业温室气体排放时空差异和公平性。主要研究结论如下:(1)根据时间序列分析,2001—2014年排放量大幅增加,但其年际变化呈波动态势,2007年以后涨幅较大,年均增长4.37%,而排放强度则表现为明显下降趋势,年均降幅4.26%。
(2)从空间格局变动来看,排放量空间集聚特征明显,集中于苏北地区,并且高值区域有向该区集聚的趋势,同时高排放区增加了12个之多。排放强度则由2001年高值区域遍布全省,逐步向均衡化发展,到2014年已呈相对离散分布,高值区域相对集中于苏北地区中部、苏中部分区域。
(3)从公平性指标来看,ECC基尼系数,超过了“0.4”的警戒线,而呈上涨趋势,表现出较大的不公平性,应引起特别注意。
(4)排放公平性表现出明显区域差异:①“高-高”型主要分布于南京大部、苏南区域东部以及苏北中部城市市辖区;②“高-低”型,主要分布在里下河地区、苏南地区中部以及苏北地区中部。③“低-高”型,包括徐宿连苏4个市辖区;④“低-低”型,主要分布于苏北地区北部和沿海地区中部。
5.2 建议
本文研究为制定差异化的农业节能减排政策,特别是确定各行政区域温室气体排放限额目标任务奠定了基础。研究结果表明,江苏省县域农业温室气体排放大幅增加,且存在较大的时空差异,这就要求地方政府特别是省级政府在制定农业节能减排政策,分配节能减排限额目标任务时应充分考虑这种差异性,即差异化的制定农业节能减排目标任务,避免政策“一刀切”[22]。具体包括两个方面:(1)制定差异化的排放目标任务和激励措施。根据国家制定的“地方政府对本行政区域节能减排负总责”的要求,省级政府可以根据四类不同类型区制定分配准则,例如“高承载力-高经济贡献”类型区应确定更高的节能减排任务;“高承载力-低经济贡献”类型区在确定较高的节能减排任务的同时,辅以财政奖励,肯定其贡献,以免影响其减排积极性 [22];“低承载力-高经济贡献”类型区应承担适中的减排任务;“低承载力-低经济贡献”类型区可以适当减少减排任务,同时加大资金扶持和政策倾斜。
(2)制定差异化的现代农业发展思路。各类地区应结合自身特征制定不同的农业发展方向,例如“高-高”类型区应大力发展现代化的生态农业、休闲农业,结合自身经济实力强的优势,适当发展农业综合体,运用先进低碳技术,实现农业低碳化;“高-低”类型区应以“绿色”农产品为核心,发展生态农业,提升该类区域农业经济效益;“低-高”类型区以优化农业产业结构为主,改善农作物种植方式、品种,适当向林业、渔业等低碳排放转变;“低-低”类型区应积极争取增加农业资金投入,开展测土配方、土地整治等措施,提升农业综合实力,逐步发展低碳农业。当然,该研究还需要进一步深入,如不同地区自然条件、耕作制度、产业结构以及其他产业部门对农业温室气体排放的影响,仍需进一步深化,其影响程度尚需运用数学方法量化分析。
The authors have declared that no competing interests exist.
参考文献 原文顺序
文献年度倒序
文中引用次数倒序
被引期刊影响因子
| [27] | |
| [28] | [J]. |
| [29] | [J]. [J]. |
| [30] | [J]. [J]. |
| [1] | [J]. [J]. |
| [2] | [J]. [J]. |
| [3] | [J]. [J]. |
| [4] | [J]. |
| [5] | [J]. [J]. |
| [6] | [J]. [J]. |
| [7] | [J]. [J]. |
| [8] | [J]. [J]. |
| [9] | [J]. [J]. |
| [10] | [J]. [J]. |
| [11] | [J]. [J]. |
| [12] | [J]. [J]. |
| [13] | [J]. [J]. |
| [14] | [J]. [J]. |
| [15] | [J]. [J]. |
| [16] | [J]. [J]. |
| [17] | [J]. [J]. |
| [18] | [J]. [J]. |
| [19] | [J]. [J]. |
| [20] | [J]. [J]. |
| [21] | [J]. [J]. |
| [22] | [J]. [J]. |
| [23] | [J]. [J]. |
| [24] | [J]. [J]. |
| [25] | [EB/OL]. ( [EB/OL]. ( |
| [26] | |
| [27] |
