Spatial-temporal variation and factors affecting precipitation in the hilly area of Taihang Mountain
TIANTian通讯作者:
收稿日期:2015-06-18
修回日期:2016-04-27
网络出版日期:2016-06-20
版权声明:2016《资源科学》编辑部《资源科学》编辑部
基金资助:
作者简介:
-->
展开
摘要
关键词:
Abstract
Keywords:
-->0
PDF (6027KB)元数据多维度评价相关文章收藏文章
本文引用格式导出EndNoteRisBibtex收藏本文-->
1 引言
太行山丘陵区位于太行山脉的东北部,华北平原西侧,面积约3万km2,海拔在80~500m之间,是华北平原地下水的重要补给运移区。受气候和地形影响,太行山丘陵区降水量较丰富,区内水系支流发达,形成多级树枝状的河流地貌,植被类型丰富多样。然而近年来,随着暴雨事件频繁发生,太行山丘陵区生态环境脆弱性日渐显露,水土流失现象频繁发生。根据全国水土保持规划纲要(2015-2030年),太行山被列为国家级水土流失重点治理区,包括河北省易县在内的48个区县都在水土流失治理区域之内。当地政府近年来实施了退耕还林还草工程,使得该区水土流失得到了一定控制,生态环境得到明显改善。由于太行山丘陵区地形复杂起伏多变,监测控制点数量十分有限,因此在确定丘陵区降水量时多采用数学模型、线性回归等方法,例如张北赢等、侯瑞钦等采用数值模拟的方法探索太行山低山丘陵区降水量与地形特征的关系,证明坡向与海拔高度是影响研究区降水量空间分布的主要因素[1,2]。郭迎春应用降水与海拔高度的关系,建立数学模型推算出无资料地区一日最大可能降水量,为山区、丘陵区水资源管理提供了依据[3]。王菱根据降水量与坡向、海拔之间的关系推导出太行山东坡丘陵区降水量的指数方程[4]。其后,随着降水量观测设备的日益先进,对降水量的观测逐步实现了高精度和自动化,以坐落于太行山丘陵区的崇陵流域实验基地为例,其在2004年基地成立后,已积累了2005-2014年等10余年的高精度次降水数据,侯士彬、胡珊珊、金明、袁瑞强、闵雷雷等根据流域内6个降水自动观测点降水数据分别分析了2004-2008年降水量的变化特征[5-9]。胡珊珊、钱金平等根据崇陵流域油松林内穿透降水观测装置计算了2007-2008年油松林覆被下降水穿透率[6,10]。袁瑞强根据胡珊珊穿透降水的研究成果,结合流域内各观测点降水量数据,采用面积加权法计算了崇陵流域2004-2009年的年降水量,为崇陵流域的水量平衡计算以及水资源管理奠定了理论基础[8]。21世纪以来,环境同位素技术越来越多地投入到流域水循环过程的研究当中,侯士彬等、贾国栋等先后对区内降水的氢氧同位素特征进行分析研究,同位素分析结果显示东南季风是引起降水同位素含量出现明显年内差异的主要因素[11,12]。Song等、王鹏等通过对比分析降水与土壤水、地下水的同位素组成,证明了夏季降水是区内地下水的主要来源,降水的分析研究对研究区乃至华北平原都具有重要意义[13,14]。以上文献对太行山丘陵地貌区降水特征及影响因素展开了大量研究,但目前缺乏深入探讨针对不同下垫面条件下降水量的影响因素分析工作。
本文以太行山丘陵区典型小流域崇陵流域为例,利用崇陵流域2005-2014年高精度的翻斗式自记雨量计提供的降水事件的自动观测数据,结合线性回归、Mann-Kendall趋势性检验等方法,对研究区内降水量数据进行系统分析,进而探讨崇陵流域降水量的分布规律,为科学估算区内降水资源、科学指导太行山丘陵区水资源管理与生态环境建设提供理论依据。
2 数据来源及研究方法
2.1 研究区概况
崇陵流域位于河北省保定市易县境内(115°21′E,39°23′N),地处太行山脉北段。流域面积6km2,全长4.4 km。研究区地势西北高东南低,由绵延起伏的丘陵和沟壑构成,具有典型的丘陵地貌特征,海拔高度在85~300m之间。该区气候类型为温带大陆性季风气候,冬冷夏热,年均气温11.6℃,年均降水量641.2mm。土地利用类型以林地和草地为主(图1),主要植被类型为油松、侧柏、刺槐和灌草,其中油松、侧柏和刺槐的植被覆盖度约78.0%~83.5%,灌草植被覆盖度约为71.0%[5]。 显示原图|下载原图ZIP|生成PPT
图1崇陵流域植被分布及观测点位置分布
-->Figure 1Distribution of vegetation and observation point in Chongling Catchment
-->
2.2 数据来源及处理
降水数据采用中国科学院地理科学与资源研究所陆地水循环及地表过程重点实验室崇陵流域实验基地2005-2014年4-10月的6个降水观测点的降水量资料。各观测点海拔高度在75.4~115.2m之间,坡向朝南(157.5~202.5°)。采用翻斗式自计雨量计(SL3型标准雨量桶+HOBO计数器)观测,精度为0.1mm。研究中剔除了由于仪器故障产生的缺测、错测数据,缺失数据采用临近观测点数据进行插补,采用数据累加法得到各降水点不同时间尺度下降水量的序列值。
2.3 研究方法
本文采用一元线性回归、Mann-Kendall趋势性检验等方法对收集到的2005-2014年4-10月总降水量以及月、日、小时降水量数据序列进行趋势分析。其中,一元线性回归是一种最简单、最容易看出序列变化趋势的分析方法,它利用指标时间序列与时间序数建立一元回归方程,求出各统计系数并能够获得指标随时间变化的倾向性;Mann-Kendall趋势性检验是一种基于秩的非参数检验方法,在样本容量以及样本独立性得到保障的前提下,该方法能够真实、简便地反映样本序列的趋势变化状况[16,17],近年来在水文序列研究中得到了广泛的应用。该方法设一平稳独立序列为其中,
当n≥10时,统计量S近似服从正态分布,不考虑序列中等值数据点情况,其均值
标准化的检验统计量
该方法采用的是双侧检验;
3 结果及分析
3.1 降水量时间分布特征分析
2005-2014年4-10月崇陵流域降水量时间序列见图2所示,在观测期的10年,崇陵流域4-10月总降水量平均值为542.01 mm,标准差为140.12 mm,变异系数Cv值为0.26,说明4-10月总降水量变化幅度较大,线性回归检验结果表明崇陵流域近10年4-10月降水量整体变化斜率为4.50mm/a,但该趋势未通过95%的显著性水平检验(P=0.789)。Mann-Kendall趋势性检验结果与线性回归法结果基本一致(Ze=0.72),说明崇陵流域在观测期内4-10月总降水量变化幅度较大,但整体未反映出明显的增大或减小趋势。 显示原图|下载原图ZIP|生成PPT
图22005-2014年4-10月崇陵流域月平均降水情况
-->Figure 2Precipitation amount from April to October in Chongling Catchment from 2005 to 2014
-->
在月尺度上,2005-2014年4-10月降水量如图3所示,从图中可以看出崇陵流域降水量年内分配极不均匀,6-9月降水相对集中且年际差异较大。采用线性回归和M-K趋势性检验法对近10年来4-10月的变化趋势加以分析,线性拟合结果如表1所示,可看出虽然近10年来降水集中的6月、7月、9月呈现上升的趋势,4月、5月、8月、10月呈现出下降趋势,但上述变化中除5月以外均未通过95%的显著性水平检验,说明在月尺度上,崇陵流域的降水量整体未显示出明显的变化趋势。
在降水日尺度方面,崇陵流域气象场观测点2005-2014年内共记录有688个降水日,降水日数逐年呈减小趋势(-1.22 d/a)。按照国家气象局对降水量级的划分标准,崇陵流域日降水量可划分为小雨(0.1~9.9mm)、中雨(10.0~24.9mm)、大雨(25.0~49.9mm)、暴雨(50.0~99.9mm)、大暴雨(100.0~249.9mm)以及特大暴雨(≥250.0mm)6个等级,统计分析结果显示,小雨出现的日数最多,占总降水日数的79.6%,其次分别为中雨12.5%、大雨5.9%、暴雨1.6%以及大暴雨0.4%,无特大暴雨记录。其中大雨及大雨以上级别降水日数整体呈现出逐年增加的趋势(0.19 d/a,p=0.589)。分别统计了不同量级降水对崇陵流域年降水量的贡献率,统计结果见表2所示,可以看出小雨对崇陵流域的降水资源量贡献最大,多年平均贡献率为54.7%,其次为中雨19.6%,大雨、暴雨和大暴雨贡献率分别为15.8%、7.4%和2.5%。上述数据表明,崇陵流域的降水主要以小雨为主。当日降水量小于5mm时,降水主要以蒸发的形式返回大气,属于无效降水[20]。由此可见,崇陵流域降水资源的可利用量十分有限。
Table 1
表1
表12005-2014年崇陵流域月降水趋势检验结果
Table 1Trend test results of monthly precipitation amount in Chongling Catchment from 2005 to 2014
| 月份 | 平均贡献率 /% | 线性拟合公式 | R2 | P | Ze |
|---|---|---|---|---|---|
| 4 | 3 | 0.015 | 0.740 | -0.72 | |
| 5 | 8 | 0.683 | 0.003 | -2.50 | |
| 6 | 16 | 0.204 | 0.190 | 1.07 | |
| 7 | 29 | 0.037 | 0.593 | 0.53 | |
| 8 | 22 | 0.188 | 0.211 | -0.89 | |
| 9 | 15 | 0.242 | 0.149 | 0.89 | |
| 10 | 3 | 0.016 | 0.730 | 0.54 |
新窗口打开
Table 2
表2
表22005-2014年崇陵流域不同量级降水量贡献率
Table 2Contribution rate of different magnitudes of precipitation amount in Chongling Catchment from the year from 2005 to 2014 (%)
| 年份 | 小雨 | 中雨 | 大雨 | 暴雨 | 大暴雨 |
|---|---|---|---|---|---|
| 2005 | 55.15 | 11.48 | 15.51 | 17.86 | 0 |
| 2006 | 59.21 | 26.83 | 13.97 | 0 | 0 |
| 2007 | 54.39 | 14.28 | 20.26 | 11.07 | 0 |
| 2008 | 55.13 | 30.08 | 14.79 | 0 | 0 |
| 2009 | 58.52 | 16.45 | 10.45 | 0 | 14.58 |
| 2010 | 60.99 | 20.20 | 12.13 | 6.68 | 0 |
| 2011 | 55.48 | 14.10 | 16.12 | 14.29 | 0 |
| 2012 | 54.83 | 7.39 | 16.13 | 11.45 | 10.20 |
| 2013 | 52.92 | 14.16 | 20.01 | 12.91 | 0 |
| 2014 | 40.07 | 40.96 | 18.97 | 0 | 0 |
| 平均 | 54.67 | 19.59 | 15.83 | 7.43 | 2.48 |
新窗口打开
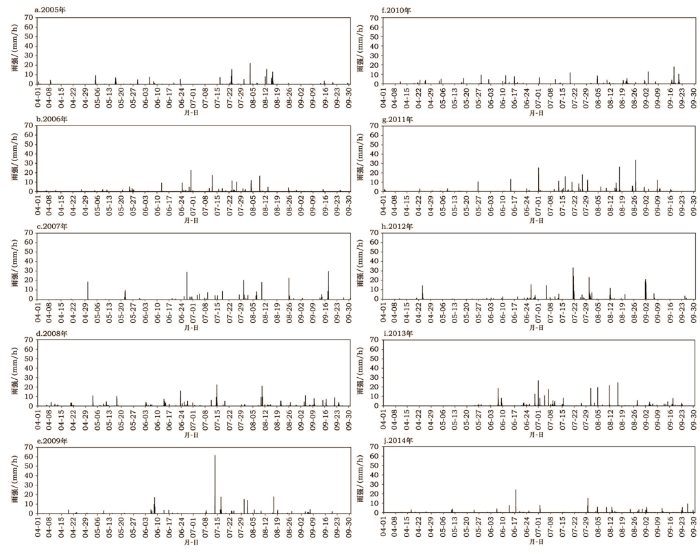
为查明近年来降水强度的特征,将自动观测的降水数据折算为小时雨强以观察其变化趋势,2005-2014年小时雨强时间分布情况如图4所示。M-K趋势性分析结果显示近10年来崇陵流域小时雨强呈显著的下降趋势(Ze=-3.85)。
 显示原图|下载原图ZIP|生成PPT
图32005-2014年崇陵流域月平均降水情况
-->Figure 3Monthly average precipitation amount in Chongling Catchment from 2005 to 2014
-->
 显示原图|下载原图ZIP|生成PPT
图42005-2014年崇陵流域小时雨强
-->Figure 4Hourly precipitation amount in Chongling Catchment from the year of 2005 to 2014
-->
3.2 降水量空间分布特征分析
空间分布方面,采用单因素ANOVA分析方法对降水数据在不同时间尺度上进行差异分析。结果显示,在小时、日和月时间尺度下,流域内各观测点降水量无显著差异(P>0.05),而在年尺度下存在显著性差异(P=0.042),位于流域上游的杨树沟、岳各庄和万亩林观测点年降水量显著小于下游幼林沟、气象场和荒坡观测点年降水量,上下游年降水量差异约为12.14%(图5)。为探索崇陵流域降水量在不同降水年型下的空间差异大小,根据崇陵流域历史年降水量数据采用pearson-III型曲线绘制崇陵流域经验频率曲线(图6),根据曲线拟合结果结合中国《水文基本属于和符号标准》对丰、平、枯水年的划分标准(丰水年P≤37.5%、平水年37.5<P≤62.5%、枯水年P>62.5%),崇陵流域年降水量在2005-2014年期间共出现丰水年1年(2008年)、平水年6年(2005年、2007年、2010年、2011年、2012年、2013年)以及枯水年3年(2006年、2009年、2014年)。上述年型中,年降水量在流域内各观测点的空间分布差异存在一定的规律,在丰水年内,年降水量的空间分布差异最为突出,流域上游的杨树沟、岳各庄和万亩林观测点年降水量低于下游的幼林沟、气象场和荒坡观测点20.73%,而在平水年二者平均相差9.18%,枯水年则相差0.57%(图5)。采用变差系数Cv值进一步表征空间分布差异的结果显示丰、平、枯水年在研究期内年降水量变差系数平均值分别为0.115、0.062和0.039。上述数据说明流域下游降水量大于上游,这种空间差异随年降水量的增加越发显著。
 显示原图|下载原图ZIP|生成PPT
图5崇陵流域降水观测点多年平均、丰水年、平水年、枯水年降水量空间分布
-->Figure 5Precipitation amount under annual average,wet year,normal year and dry year in Chongling Catchment
-->
 显示原图|下载原图ZIP|生成PPT
图62005-2014年崇陵流域降水量皮尔逊III型曲线
-->Figure 6Pearson type III curve of annual precipitation amount in Chongling Catchment from 2005 to 2014
-->
3.3 降水量影响因素分析
从崇陵流域研究期内降水量数据分析结果中可见,研究区降水量在时间和空间分布上均存在明显的不均匀性。影响降水量时空分布的主要因素包括地理位置、大气环流、天气系统、下垫面条件以及人类活动等,其中下垫面条件包括地形(海拔、坡向)、森林植被和水体等。在崇陵流域,由于研究区面积相对较小,经纬度跨度不足0.05°,因此各观测点之间不存在明显的纬度、海陆效应差异,因此地理位置、大气环流、天气系统等因素不是造成崇陵流域降水量空间分布差异的主要因素;同时,由于研究区位于我国AAAA级风景区内,人类活动影响较小。因此本节重点就下垫面条件(地形和森林植被因素)对崇陵流域的降水量分布影响进行讨论。采用控制变量法分别讨论地形和森林植被对降水量空间分布的影响。
3.3.1 地形因素对降水量空间分布的影响
考虑到研究区内各降水观测点的坡向基本一致,因此坡向差异亦不是引起崇陵流域降水量空间分布出现差异的因素。本节重点讨论地形因素中的海拔高度对降水量空间分布的影响。以流域内坡向(南:157.5~202.5°)、植被覆盖类型(侧柏)一致,海拔高度相差近40m的幼林沟和荒坡观测点降水量进行比较分析(图7),结果发现二者的年、月、日降水量均不存在显著差异(P>0.05),两个观测点在三个不同时间尺度下分别相差4.7%、8.3%和19.5%,说明在40m的高度差范围内,海拔因素不会显著影响降水量的空间分布。
 显示原图|下载原图ZIP|生成PPT
图72005-2014年崇陵流域幼林沟、荒坡降水观测点降水量分布
-->Figure 7Precipitation amount in Youlingou and Huangpo from 2005 to 2014
-->
3.3.2 森林植被对降水量空间分布的影响
以流域内坡向一致(南:157.5~202.5°)、海拔高度相差不足5m的杨树沟和荒坡观测点比较降水量的差异(图8)。数据显示在年和月时间尺度下,灌草覆被的杨树沟与侧柏覆被的荒坡点降水量存在显著的空间分布差异(P=0.033、0.054),而日尺度上差异不明显(P>0.05),两个观测点在三个时间尺度下分别相差10.2%、19.89%和19.1%。说明森林植被覆盖能够显著影响崇陵流域降水的空间分布。究其原因,主要是因为植被覆盖度相对较高的森林区的蒸腾作用会使林区温度降低,这种湿冷的空气流向其它地表温度相对较高的地区,这些气流在气温升高后向上空运移,其中的一部分会再次流向森林上空而遇冷下沉,从而形成局部环流体系,进而增加了林区发生降水的频率;同时,森林对气团或小规模的气块具有阻碍作用,增加了气团流动的过程中的摩擦力和气团内部的涡动,进而促进降水在森林区域发生。
同时,森林覆被下的荒坡降水观测点记录的日降水数据变差系数(Cv=4.097,N=215)明显小于杨树沟观测点的变差系数(Cv=4.508,N=215),说明荒坡观测点降水量变化幅度要比杨树沟小,森林对降水量的时间分布上起到一定的调节作用。综上所述,崇陵流域及其周边地区的植被覆盖会改变局部小气候、显著影响雨量观测结果,从而造成崇陵流域降水量的空间分布差异。
 显示原图|下载原图ZIP|生成PPT
图82005-2014年崇陵流域杨树沟、荒坡降水观测点降水量分布
-->Figure 8Precipitation amount in Yangshugou and Huangpo from 2005 to 2014
-->
4 结论
本文采用线性回归模型、M-K趋势性检验方法对崇陵流域2005-2014年4-10月降水的时空分布特征以及造成降水量时空分布差异的主要因素进行了研究,得出以下结论:(1)时间分布方面,崇陵流域研究期内4-10月总降水量波动明显,10年内增加幅度为4.50mm/a。年内分布存在极强的不均匀性,6-9月降水量占全年降水量的70%以上,5月降水量呈显著减小趋势。研究期降水量级主要以小雨为主,小雨雨量占崇陵流域降水资源量的50%以上,由于日降水量小于5mm即为无效降水,因此崇陵流域降水资源十分有限。近10年来降水日数逐年呈减小的趋势,但大雨以上量级降水出现频率则逐年上升(0.19d/a),灾害性降水隐患依旧存在。
(2)空间分布方面,研究区内6个降水观测点在年尺度上存在显著差异,流域上游降水量小于流域下游,该差异在年尺度通过了95%显著性水平检验。通过对丰、平、枯等不同年型下流域内年降水量的统计分析,结果表明降水量的空间差异随年降水量的增加而增加(各观测点在研究期内丰水年年降水量变差系数Cv值的均值为0.115,而平水年和枯水年分别为0.062和0.039)。
(3)植被覆盖的不均匀性是造成崇陵流域降水量空间分布存在差异的主要原因之一。研究区内的油松、侧柏和刺槐等森林植被使区内降水量显著增加。我国实行的退耕还林还草工程对改变局部小气候、增加区域降水量起到了明显作用。
The authors have declared that no competing interests exist.
参考文献 原文顺序
文献年度倒序
文中引用次数倒序
被引期刊影响因子
| [1] | [J]. [J]. |
| [2] | [ [ |
| [3] | [J]. [J]. |
| [4] | [J]. [J]. |
| [5] | . |
| [6] | . |
| [7] | . |
| [8] | . |
| [9] | . |
| [10] | [J]. [J]. |
| [11] | [J]. [J]. |
| [12] | [J]. [J]. |
| [13] | [J]. |
| [14] | [J]. [J]. |
| [15] | . |
| [16] | [J]. |
| [17] | [J]. |
| [18] | [J]. |
| [19] | [J]. [J]. |
| [20] | [J]. [J]. |
| [21] | |
| [22] | [J]. [J]. |
