HTML
--> --> -->Numerous techniques have been used to obtain the PWV, such as radiosonde, GPS, ground-based sun photometers, ground-based microwave radiometers, and satellite observations (Bevis et al., 1992; Czajkowski et al., 2002; Li et al., 2003; Gao and Kaufman, 2003; Alshawaf et al., 2015). Because of their unique temporal and spatial resolution, satellite observations can be used to determine global or regional PWV distributions (Kaufman and Gao, 1992; Gao and Kaufman, 2003; Liu et al., 2017). They have become the most widely used technique in water vapor monitoring (Aumann et al., 2003). Sensors can be divided into four categories based on the propagated signals: visible (VIS), near-infrared (NIR), infrared (IR), and microwave measurements (Wang et al., 2014). The Moderate Resolution Imaging Spectroradiometer (MODIS) onboard Terra and Aqua, the Medium Resolution Imaging Spectrometer (MERIS) onboard Envisat, and MERSI/MERSI-II onboard the Fengyun-3 (FY-3) meteorological satellite series, are the three major sensors providing NIR-based PWV products to the community. Many studies have been carried out to validate and improve the accuracy of the PWV products of MODIS and MERSI (Prasad and Singh, 2009; Liu et al., 2013; Diedrich et al., 2015; Wong et al., 2015; Liu et al., 2015b). However, few researchers focused on the efficiency of MERSI’s PWV products. In this study, we therefore introduce the current status of FY-3D/MERSI-II’s PWV products in detail, including updates of the MERSI-II instrument regarding the NIR PWV retrieval, water vapor retrieval algorithm using MERSI-II NIR channels, and product samples as well as product accuracy.
An overview of the FY-3D/MERSI-II instrument is provided in section 2, and the changes in the NIR channel settings as well as calibration methods used for the PWV retrieval of MERSI and MERSI-II are discussed. The PWV retrieval technique and validation methods based on ground-based GPS measurements are introduced in section 3. The status of the PWV products of MERSI-II as well as the validated results are illustrated in section 4. Moreover, several issues related to the accuracy of MERSI-II’s PWV products are discussed in section 4. Finally, conclusions are drawn in section 5.
2.1. Instrument overview
The FY-3 series of satellites are the second-generation of Chinese polar-orbiting, sun-synchronous meteorological satellites. FY-3D is the fourth and latest satellite, which was successfully launched on 15 November 2017. The equator crossing time is 13:40 local time in the rising intersection node and the average altitude of the orbit is 830.73 km (Yang et al., 2019; Zhang et al., 2019). In contrast to the previous FY-3A/B/C satellites, the FY-3D satellite was designed to be equipped with an advanced version of MERSI (MERSI-II). The previous version of MERSI onboard the FY-3A/B/C satellites included 20 bands: 19 reflective solar bands (RSBs) over the spectral range of 0.4–2.1 μm, and one thermal emissive band (TEB) over the range of 10–12.5 μm (Sun et al., 2012a). The updated MERSI-II sensor contains 25 bands—that is, 20 RSBs and 5 TEBs—covering the VIS (at 0.41 μm) to longwave IR (at 12.2 μm; Xu et al., 2018) spectrum. The first four RSBs (blue, green, red, NIR), and two TEB split windows, have a spatial resolution of 250 m at nadir, and the other bands have a spatial resolution of 1 km at nadir (Xu et al., 2018).2
2.2. Channel setting changes
PWV is one of the major atmospheric products of MERSI-II. Two PWV products are provided by MERSI-II, which are derived from the NIR and IR channels, respectively. The NIR PWV products are derived via comparison between the reflected solar radiance in the absorption channels with those in nearby non-absorption channels in the range of 0.8–1.3 μm. The spectral positions and widths of these channels are listed in Table 1 and illustrated in Fig. 1. The previous MERSI and MODIS channel specifications of the NIR PWV products are also provided in Table 1 and Fig. 1.| MODIS | MERSI | MERSI-II | ||||||
| Position (nm) | Width (nm) | Position (nm) | Width (nm) | Position (nm) | Width (nm) | |||
| Window channel | 858 | 35 | 865 | 20 | 865 | 20 | ||
| 1240 | 20 | 1030 | 20 | 1030 | 20 | |||
| Absorption channel | 905 | 30 | 905 | 20 | 905 | 20 | ||
| 936 | 10 | 940 | 20 | 936 | 20 | |||
| 940 | 50 | 980 | 20 | 940 | 50 | |||
Table1. Positions and widths of five NIR channels used for the water vapor monitoring of MERSI, MERSI-II and MODIS.
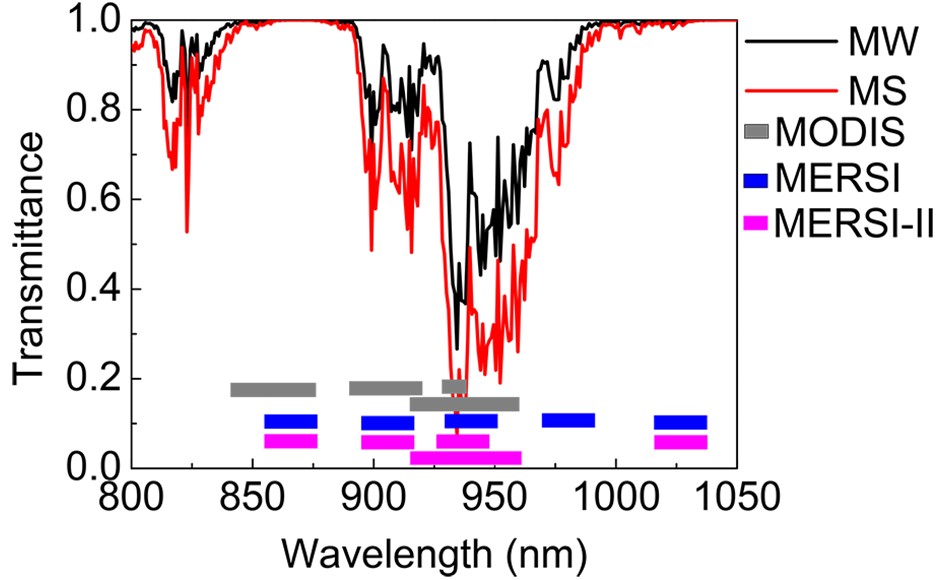 Figure1. Positions and widths of the five NIR channels used in MERSI (thick blue horizontal bars), MERSI-II (thick magenta horizontal bars), and MODIS (thick grey horizontal bars), and the two-way atmospheric water vapor transmittance spectra simulated for the midlatitude summer (MS) and midlatitude winter (MW) models in MODTRAN4.3 with a solar zenith angle of 45° and a nadir-looking geometry.
Three absorption channels and two non-absorption channels in the 0.8–1.3 μm range are included in the design of all three instruments to monitor atmospheric water vapor. The same non-absorption channels were selected for MERSI and MERSI-II, which are centered at 865 and 1030 nm and have an identical spectral width of 20 nm. However, different absorption channels were selected for the two MERSI instruments. Two strong water vapor absorption channels, both centered at 940 nm but with different widths (20 and 50 nm), were selected for MERSI-II, while only one strong water vapor absorption channel centered at 940 nm with a spectral width of 20 nm was used in MERSI. One weak absorption channel centered at 905 nm was used for MERSI-II, while two weak absorption channels at 905 and 980 nm were utilized in MERSI. The setup of the water vapor absorption channels of MERSI-II is similar to that of MODIS.
The simulated transmittances of these selected channels are plotted in Fig. 2 for different instruments as a function of the total water vapor. A detailed simulation setup is presented in section 3. The transmittance of the absorption channels decreases with increasing atmospheric water vapor concentration. The transmittance of the strong absorption channel at 940 nm with a narrow spectral width (20 nm) decreases the fastest among the three absorption channels, when the water vapor content is small. This means that this channel is most sensitive to changes in the atmospheric water vapor concentration under dry conditions (PWV < 2 cm). By contrast, the transmittance of the weak absorption channel at 905 nm decreases the fastest among the three absorption channels, when the water vapor content is large. This means that this channel is most sensitive to changes in the atmospheric water vapor concentration under humid conditions (PWV > 4 cm). The same is true for the weak absorption channel at 980 nm, which is used in MERSI. To avoid redundant information, only one weak absorption channel centered at 905 nm was kept in MERSI-II and the 980 channel was replaced with a wide (spectral width of 50 nm) and strong absorption channel at 940 nm. The transmittance of this absorption channel varies between that of the weak absorption channel (905 nm) and that of the narrow strong absorption channel (940 nm, with 20 nm spectral width), which provides additional information for the water vapor retrieval under medium water vapor conditions. Hence, compared with the previous MERSI, MERSI-II provides richer information for the water vapor retrieval under different conditions (dry, intermediate, and humid).
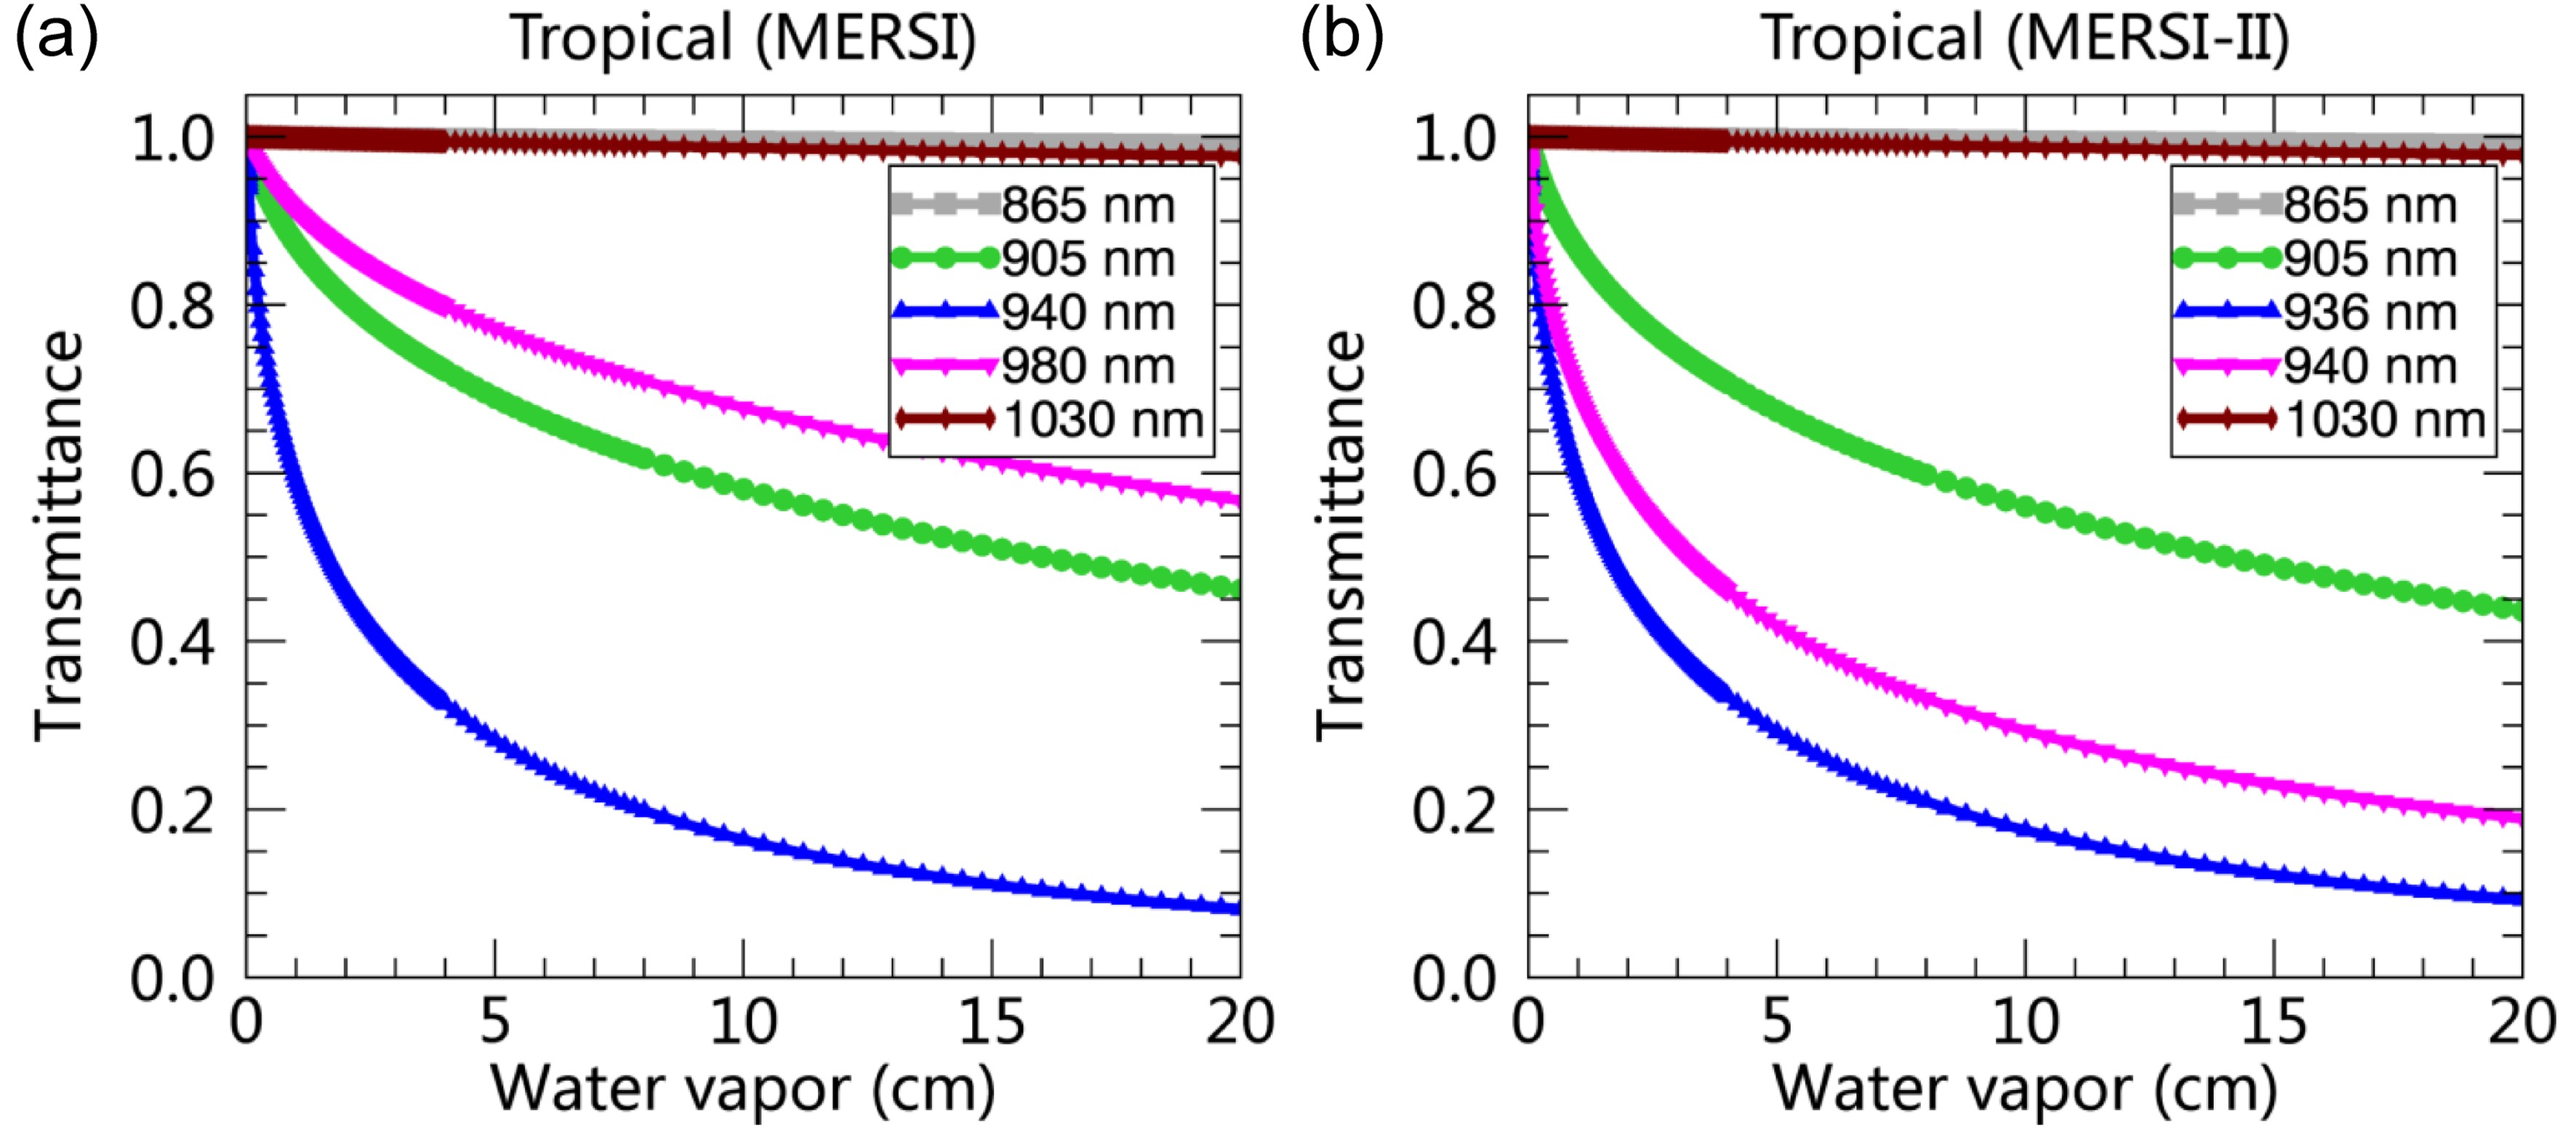 Figure2. Examples of the transmittances simulated for the selected water vapor remote sensing channels in the 800–1100 nm range as a function of the total water vapor content in the sun–surface–sensor path: (a) FY3A/MERSI; (b) FY3D/MERSI-II.
2
2.3. Calibration method updates
Because the water vapor concentration is derived from spectral radiance measurements of satellite sensors, the accuracy of the sensor calibration affects the accuracy of the retrieved water vapor content. A set of calibration coefficients for the RSBs was determined with a pre-launch calibration test under ambient laboratory conditions and in the field. However, the pre-launch calibration coefficients needed to be updated when the satellite was launched because the environment of the satellite instrument had changed. Hence, on-orbit calibration is performed using either onboard calibration systems or vicarious calibration (VC) during the orbital operation of the satellite instruments. Due to the lack of an effective onboard calibration, the operational calibration of the previous MERSI RSBs was mainly based on field VC campaigns conducted over a China Radiometric Calibration Site; namely, Dunhuang (Li et al., 2009). The reference radiance at the TOA used for this method was obtained from a radiative transfer model (RTM) and synchronous in-situ measurements. It has been proven that this method can yield an accuracy of 3%–5% for most of the RSBs, except for the water vapor absorption channels. The relatively large error of in-situ surface reflectance measurements in the water vapor absorption channels, uncertainty in the water vapor measurements, and relatively low accuracy of the RTM simulation in the water vapor absorption channels, are three major factors leading to the poor calibration accuracy of water vapor absorption channels. Furthermore, this method has disadvantages such as high cost, low calibration frequency, and limited radiance dynamic range based on the use of a single calibration site.The recently developed automatic calibration using multiple Global Pseudo-invariant Calibration Sites (PICSs), including desert, dry salt lake, and dark ocean sites, has gradually become another major operational method that can be used for FY satellite inflight calibration (Sun et al., 2012b; Wang et al., 2015, 2017). This method can achieve calibration at daily frequency. Furthermore, a broad radiance dynamic range is achieved by using multiple sites with different brightness values (Wang et al., 2017). Benefitting from the increase in the dynamic range of the calibration, the calibration uncertainty can be reduced (Wang et al., 2017). Similar to the VC in the field, the calibration reference of this method is obtained from an RTM such as 6SV (Vermote et al., 1997). Further, the calibration sites are located on the Earth’s surface and the accuracy of the estimation of atmospheric parameters (input parameters required for radiative calculation) also affects the accuracy of the results of the RTM. To improve the calibration accuracy of the water vapor absorption channels, a wide dynamic integrated VC (WD-IVC) method has been developed for MERSI instruments (after FY-3C; Xu et al., 2015). In addition to PICS, deep convective cloud (DCC) and lunar targets are included in this method. The spectral features of the DCCs are similar to those of the reference white board used for radiometric calibration. It provides a high and stable reflectance for calibration. The lunar irradiance reflected by the sun has a high photometric stability. Thus, the lunar target is always selected as both the radiometric standard for Earth-orbiting satellite-borne instrument calibration and Earth’s illumination source in the sky at night for ground-based and satellite remote sensing at night (Chen et al., 2013, 2017; Zhang et al., 2019). Another important feature is that DCCs are distributed above the troposphere and the moon has no atmosphere; thus, the effect of the atmosphere on the radiative calibration using these two targets is small.
The WD-IVC and field VC campaign over Dunhuang during the on-orbit test (the first year after MERSI-II’s launch) showed that the calibration accuracy of the pre-launch calibration coefficients for the 905, 936, and 1030 nm bands was worse than 5%, failing to meet the calibration accuracy requirements (Fig. 3). For these three channels, new operational calibration coefficients were calculated using the WD-IVC method. Meanwhile, for the 865 and 940 nm channels, whose calibration accuracy meets the requirements of ±5%, the pre-launch calibration coefficients were used in the current operational system. As illustrated in Fig. 4, by using the current operational calibration coefficients obtained during the on-orbit test (last two columns in Table 2), the long-term calibration accuracy of these five channels for PWV retrieval has been maintained within ±5% since MERSI-II’s launch.
 Figure3. RB in the calibration of the pre-launch calibration coefficients for the five bands used for the PWV retrieval. The red and blue bars denote the results from the WD-IVC method and the green bar denotes the results from the field VC campaign over Dunhuang.
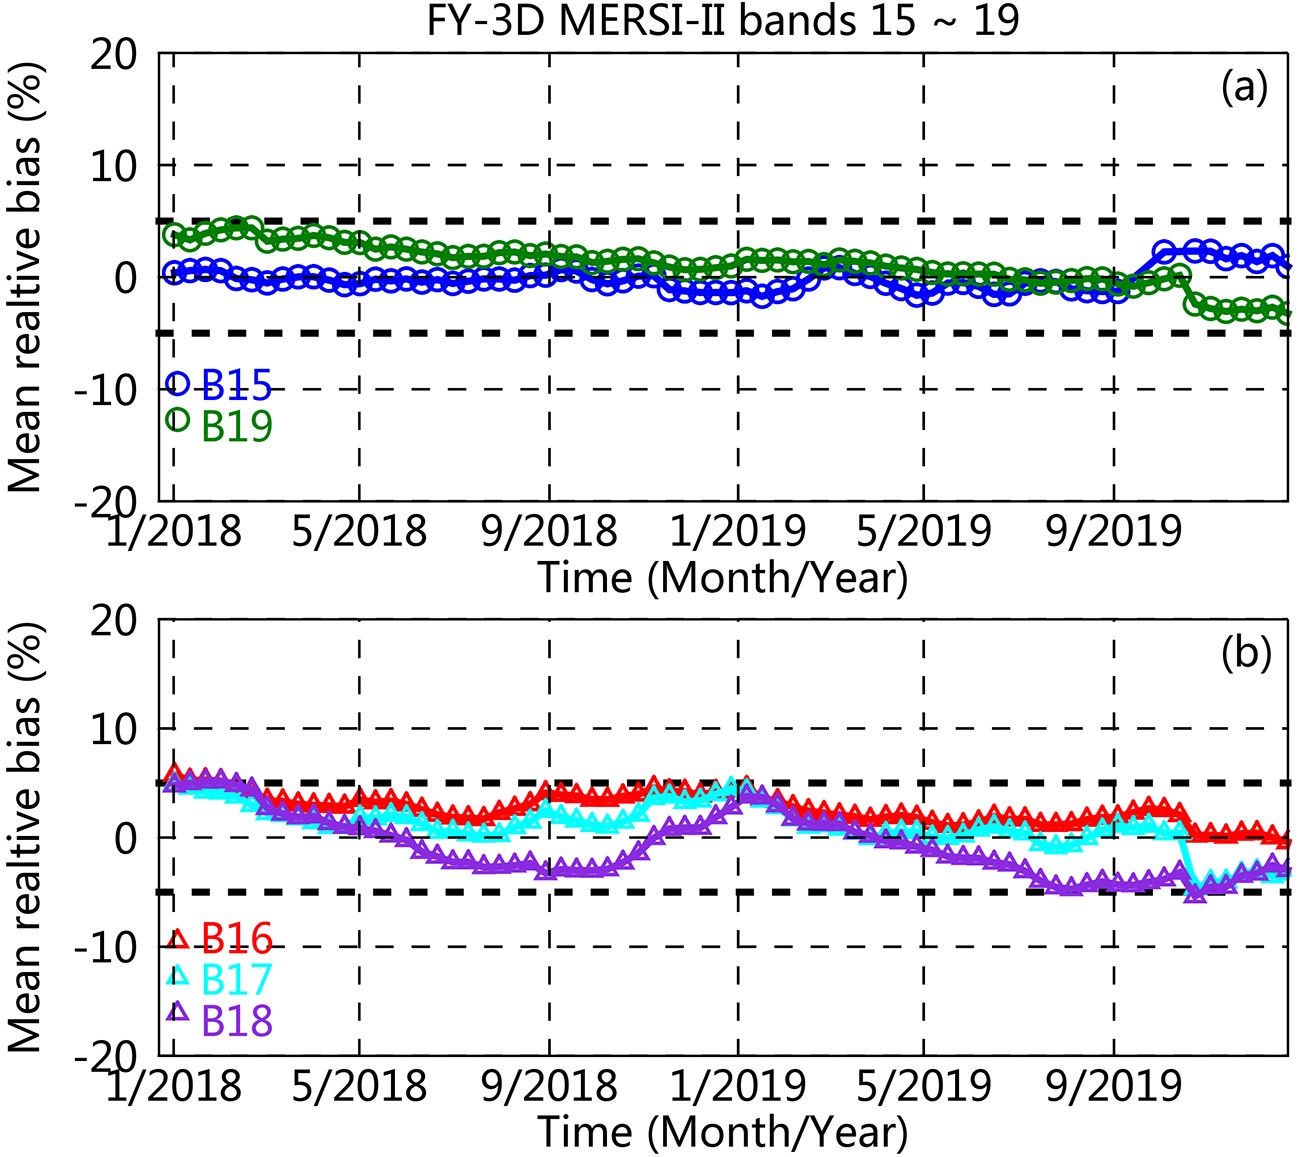 Figure4. Long-term calibration accuracy of the five channels used for the PWV retrieval between January 2018 and December 2019. The wavelength for Bands 15–19 are 865 nm, 905 nm, 936 nm, 940 nm and 1030 nm, respectively. (a) Window channels of bands 15 and 19. (b) Absorption channels of bands 16–18.
| Band No. | Center wavelength (nm) | Pre-launch | On-orbit | |||
| offset | slope | offset | slope | |||
| 15* | 865 | ?1.299 | 0.00863 | ?1.299 | 0.00863 | |
| 16 | 905 | ?4.706 | 0.02717 | ?4.5605 | 0.0261 | |
| 17 | 936 | ?6.507 | 0.02745 | ?5.6694 | 0.0242 | |
| 18* | 940 | ?6.784 | 0.0286 | ?6.784 | 0.0286 | |
| 19 | 1030 | ?4.052 | 0.0295 | ?6.0429 | 0.0335 | |
| Note: *The on-orbit operational calibration coefficients for channels 15 and 18 are from the pre-launch test. The on-orbit operational calibration coefficients for channels 16, 17 and 19 are derived based on the WD-IVC method. | ||||||
Table2. List of pre-launch and on-orbit operational calibration coefficients.
3.1. Theory of the NIR PWV retrieval technique
The radiance at a downward-looking satellite sensor in NIR channels can be approximated as (Gao and Kaufman, 2003)where Lsensor(λ) is the radiance at the sensor channel with a wavelength of λ, Lpath(λ) is the path scattered radiance, μ0 is the cosine of the solar zenith angle, E0(λ) is the solar flux at the TOA, T(λ) is the total atmospheric transmittance, and ρ(λ) is the surface bidirectional reflectance. Because the aerosol optical thickness is small in the NIR region, Lpath(λ) can be ignored. Hence, Eq. (1) can be written as
where

If the surface reflectance linearly correlates with the wavelength, a three-channel ratio of the absorption channel with a combination of two window channels will be used to obtain the transmittance of the absorption channel. The transmittance at the water vapor absorption channel can be written as
where the subscript “wv” denotes the water vapor channel; the subscripts “01” and “02” denote the window channels located on the left- and right-hand sides of the water vapor channel, respectively; Twv is the transmittance of the absorption channel; and ρwv*, ρ01* and ρ02* are the apparent reflectances of the absorption channel and two window channels, respectively. The proportional constants, k01 and k02 are calculated as
where λwv is the wavelength of the absorption channel; λ01 is the wavelength of the left-hand window channel—that is, shorter wavelength; and λ02 is the wavelength of the right-hand window channel—that is, longer wavelength. The water absorption channels of MERSI-II are 905, 936 and 940 nm, and the left- and right-hand window channels are 865 and 1030 nm, respectively. Note that the premise of Eqs. (3) and (4) is that the transmittance of the window channel equals one; otherwise, Twv should be determined based on the transmittance of the window channel (T01) or the weighted sum of the transmittance of two window channels (k01T01 + k02 T02).
The transmittances of the five MERSI-II channels as a function of total water vapor amount were precalculated using MODTRAN4.3. The transmittances were calculated under six different atmospheric conditions by using the six standard atmospheric models defined in MODTRAN4.3 (Berk et al., 1987), which represent different latitudes worldwide as well as different water vapor levels. Figure 2b shows examples of the transmittances of the five MERSI-II channels as a function of the total water vapor content based on the tropical atmospheric model. The actual water vapor transmittance was extracted from the radiances of the five MERSI-II channels using two- or three-channel ratio techniques according to the surface type. The three-channel ratio technique was used for water vapor derivations over clear land pixels (the reflectance spectrum linearly correlates with the wavelength), while the two-channel ratio technique was used over the ocean with sun glint and cloud pixels [the reflectance spectrum is almost constant (Kaufman and Gao, 1992)]. Subsequently, the combined two-way water vapor content (


| Condition | Atmospheric model used | Condition | Atmospheric model used |
| SZA ≤ 20 | Tropical | 60 < SZA ≤ 70 | Subarctic summer |
| 20 < SZA ≤ 45 | Midlatitude Summer | SZA > 70, T < T0 | Subarctic winter |
| 45 < SZA ≤ 60 | Midlatitude Winter | SZA > 70, T ≥ T0 | U.S. standard |
Table3. Selection of the transmittance–water vapor lookup table according to the solar zenith angle (SZA) and surface temperature (T).
where θs and θv are the solar and view zenith angles, respectively.
As shown in Fig. 2, water vapor has very different absorption coefficients over the three absorption channels. Therefore, under a given atmospheric condition, the derived water vapor values from the three channels can be different. A mean water vapor value (W) is obtained from the following equation:
where W1, W2 and W3 are the water vapor values derived from the 905, 936 and 940 nm channels, respectively; and f1, f2 and f3 are the corresponding weighting functions, which are calculated based on the sensitivity of the transmittance in each channel (Twv,i) to the water vapor (W): ηi = ΔTwv,i / ΔW. The weighting functions,

These normalized weighting functions are numerically computed using the simulated transmittance–water vapor curves. Figure 5 shows the dependence of

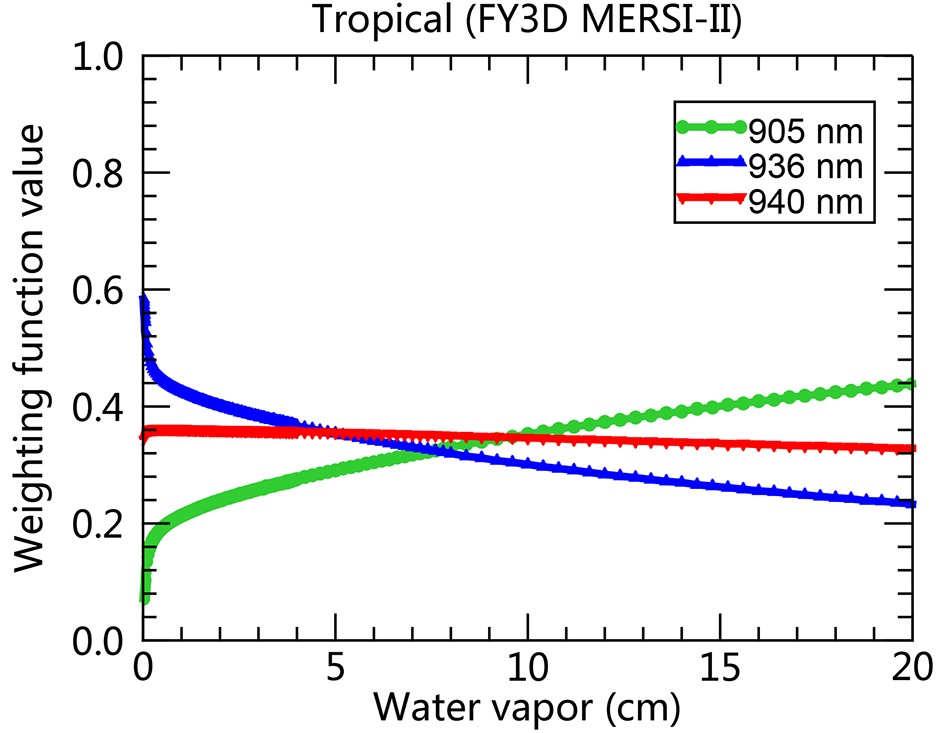 Figure5. Normalized weighting factors as a function of the total PWV for the three absorption channels of MERSI-II.
2
3.2. PWV accuracy assessment
33.2.1. Ground-based water vapor data
In this study, the GPS-derived PWV is used as a reference to compare with the PWV retrieved from MERSI-II NIR channels. Compared with the traditional ground-based water vapor instrument, i.e., radiosonde, GPS has the advantage of a high observation frequency. The temporal resolution of the radiosonde is relatively low, only twice per day. However, with GPS techniques, the PWV has been successfully retrieved at a high temporal resolution (e.g., 10 or 30 min). This helps to increase the opportunity to validate the satellite products and also reduces the impact of the differences between the satellite and ground-based instruments. The GPS computes the atmospheric water vapor column from the phase delays of GPS signals induced by the ionosphere and neutral atmosphere (Bevis et al., 1992). The GPS PWV data were obtained from SuomiNet (3
3.2.2. Data comparison
Time and space co-located GPS data are used to evaluate the MERSI-II PWV products. The setting of criteria for the spatiotemporal collocation between satellite and ground-based data is important, as it may introduce some errors and influence the comparison results. The temporal difference is usually limited from ±30 min to ±4 h of satellite overpass time and the spatial distance discrepancy is usually limited to a window size from 3 km × 3 km to 0.5° × 0.5° between the satellite pixels and ground-based stations (Liu et al., 2006, 2013, 2015b; Wong et al., 2015; Gong et al., 2018). In this study, the collocation is limited within ±1 h of time coincidence and a distance window of 5 km radius between the GPS location and the center of the MERSI-II retrievals. Thus, the GPS measurements within ±1 h of the MERSI-II overpass time were averaged to compare the results with MERSI-II products. The MERSI-II pixels with a central location of 5 km within the coordinates of the ground-based stations were averaged for further comparison. Note that the MERSI-II pixels used for the comparison should pass through the cloud mask filtering and the fraction of the remaining valid cloud-free pixels must exceed 90%. The MERSI-II L2 Cloud Mask (CLM) products obtained at the same time as the MERSI-II L2 PWV products were used to screen cloudy pixels. In the CLM images, pixels with values of 0, 1, 2 and 3 indicate cloudy, probably cloudy, probably clear, and clear, respectively. Hence, pixels with CLM values of 0, 1 and 2 were excluded from further analysis.Four statistical indicators, including the correlation coefficient (R), root-mean-square error (RMSE), mean bias (MB), and relative bias (RB), were used to evaluate the MERSI-II PWV products. The RMSE was used to quantify the differences between paired datasets and is defined as
where n is the number of data pairs; PWVM represents the MERSI-II PWV data; and PWVR represents the reference PWV—that is, the GPS-derived PWV.
The MB and RB provide information on overestimation or underestimation of the dataset and are defined as follows:
The R indicates the strength of the linear relationship between paired datasets and can be calculated using Eq. (13):
When RB and MB are close to 0 and the RMSE is small, the accuracy of the MERSI-II PWV products is considered to be high. A high R also suggests a good agreement between the two sets of data.
4.1. Effect of the radiometric calibration on the product precision
To investigate the PWV retrieval error caused by the radiometric calibration accuracy, four retrieval experiments were performed by setting the water absorption channel as having a positive calibration bias of 5%, 10% and 15%, respectively. The two-channel ratio technique and the transmittance–water vapor lookup table for the tropical model atmosphere were used here to retrieve the water vapor content. The water vapor amounts in the lookup table were used as reference PWV. Based on the principle of the two-channel ratio technique illustrated in Eq. (3), the transmittance at the water absorption channel is directly proportional to the TOA reflectance of this channel, which is proportional to the calibration coefficient. Hence, the transmittance in the lookup table was scaled according to the calibration bias to obtain a new set of transmittance values. Subsequently, a new set of PWV contents was obtained by searching the lookup table. Figures 6a–c present comparisons between the newly retrieved PWV amounts and reference PWV values for the three absorption channels. The results in Fig. 6 show that the retrieved PWV values are lower than the reference PWV when the water absorption channel has a positive calibration bias. The retrieved PWV amounts decrease with increasing calibration bias of the water absorption channel—that is, the transmittance increases, which agrees well with the relationship between the transmittance and PWV content shown in Fig. 2. The absolute PWV retrieval error is equivalent to the calibration bias. The PWV retrieval error of the weak absorption channel of 905 nm is the largest among the errors of the three absorption channels under the same calibration bias conditions. The retrieval errors in terms of the RB are ?9.1%, ?16.7% and ?23.1% when the calibration bias is 5%, 10% and 15%, respectively. The PWV retrieval error of the narrow strong absorption channel at 936 nm is the smallest and the RB values are ?5.9%, ?11.3% and ?16.2%, respectively. Those of the channel at 940 nm are slightly larger, at ?6.8%, ?12.9% and ?17.4%, respectively. Because the PWV retrieval error is inversely proportional to the calibration bias, the magnitude of the PWV retrieval error is the same as the value reported here, but the sign is reversed.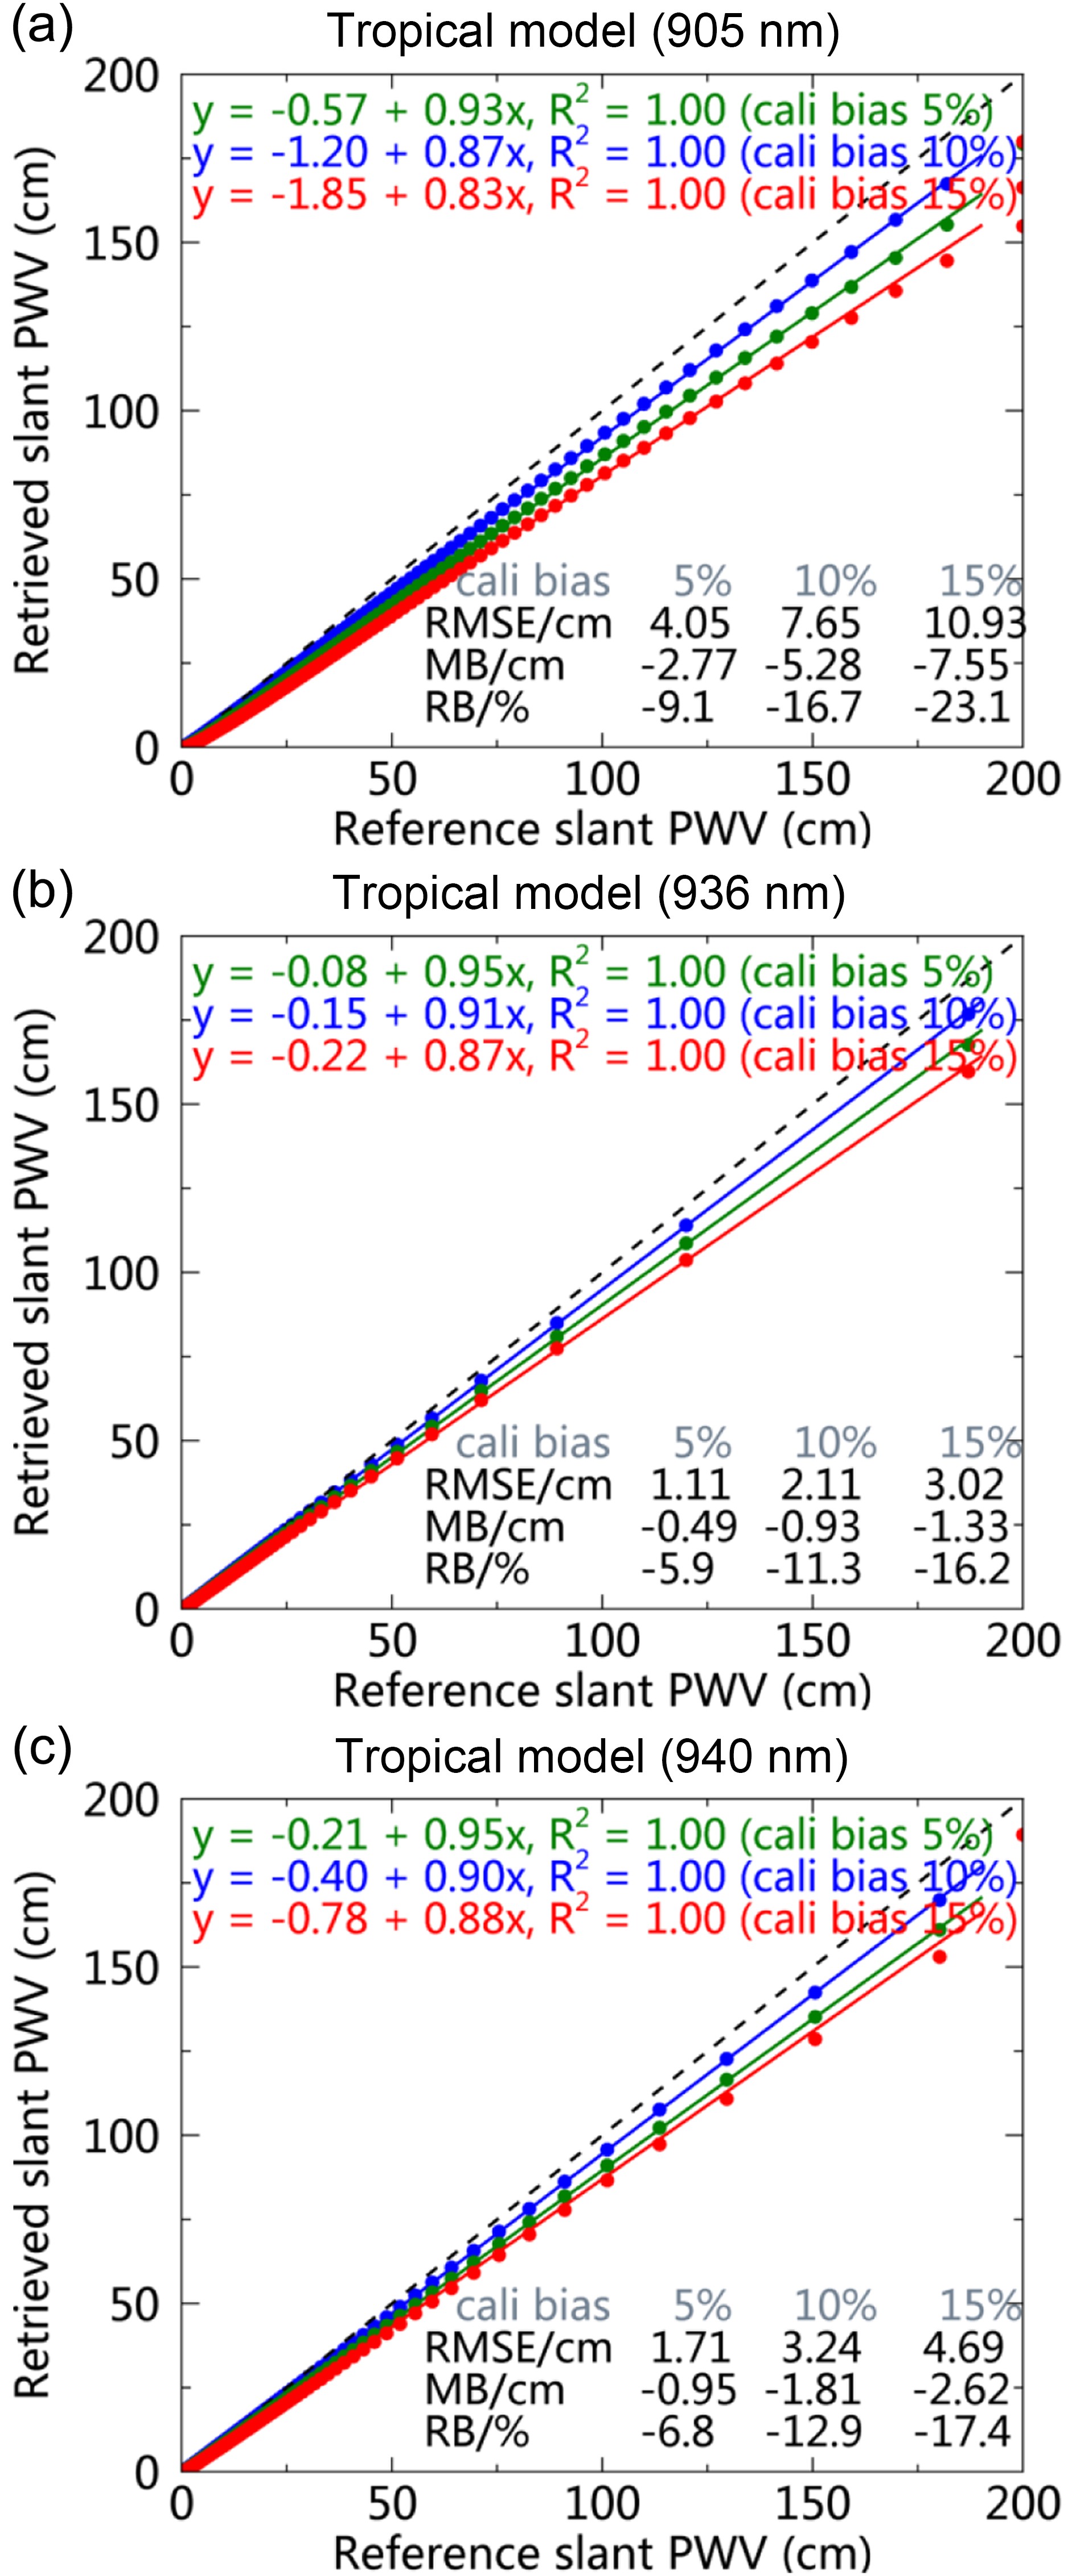 Figure6. Scatterplots of the reference water vapor values and those retrieved when the water absorption channel has a positive calibration bias of 5%, 10% and 15%: (a) 905 nm; (b) 936 nm; and (c) 940 nm. The gray dashed line has a 1:1 ratio and the blue line represents the PWV values for the water absorption channel with a positive calibration bias of 5% with respect to the reference PWV. The green and red lines represent the cases with a calibration bias of 10% and 15%, respectively.
The actual MERSI-II L1B data with two different sets of calibration coefficients (Table 2) were used to further evaluate the influence of the radiometric calibration on the PWV product precision. One of the calibration coefficients represents the pre-launch calibration test and the other represents the on-orbit operational calibration results. Based on the RB in the calibration between the pre-launch and on-orbit operational calibration coefficients (listed in Table 4), the RB of the water vapor transmittance used for the PWV retrieval can be derived through Eqs. (3) and (4). As listed in Table 4, the calculated transmittance values are positively biased; the values for the 905, 936 and 940 nm channels are 6.58%–9.15%, 11.49%–16.35%, and ~7.49%, respectively. Based on the assumption that the calibration of the window channel is correct, the error in the transmittance of the absorption channel is equal to the calibration error in this channel. The simulation analysis between the calibration bias and PWV retrieval accuracy in Fig. 6 indicates that the PWV retrievals of the 905, 936 and 940 nm channels will be underestimated by approximately 9.1%–16.7%, 11.3%–16.2%, and 12.9%, respectively.
| Band No. | Center wavelength (nm) | RB of the calibration (%) | RB of the transmittance (%) | |
| Two-channel ratio | Three-channel ratio | |||
| 15* | 865 | 0.00 | ? | ? |
| 16 | 905 | 6.58 | 6.58 | 9.15 |
| 17 | 936 | 11.49 | 11.49 | 16.35 |
| 18* | 940 | 0.00 | 0.00 | 7.49 |
| 19 | 1030 | ?9.68 | ? | ? |
| Note: *For channels 15 and 18, the pre-launch test results were used as the on-orbit operational calibration coefficients. Hence, there is no difference in the calibration results between the pre-launch and on-orbit operational calibration coefficients. For the two-channel ratio technique, the window channel with the shorter wavelength (865 nm) was adopted to calculate the PWV transmittance. | ||||
Table4. RB of the calibration and water vapor transmittance for the pre-launch and on-orbit operational calibration coefficients.
The accuracies of the MERSI-II PWV products were validated using global GPS measurements. The global MERSI-II L1B data were collected during the on-orbit test period from 25–29 May 2018, calibrated using the two different sets of calibration coefficients, and then used to generate the PWV products based on the water vapor retrieval algorithm mentioned in section 3. The left-hand panels in Fig. 7 present scatterplots between the GPS-derived PWV values and those from MERSI-II based on the pre-launch calibration coefficients. The right-hand panels are similar but based on the use of the operational calibration coefficients to calibrate the MERSI-II L1B data. The comparison shows that the PWV retrieval error of channels 905 and 936 nm is large when the pre-launch calibration coefficients are used, with a RB of ?37.8% and ?30.9%, respectively, and that of the 940 nm channel is relative lower, with a RB of ?15.6%. After updating the calibration coefficients, the error of the MERSI-II retrieved PWV values for channels 905, 936 and 940 nm decreased to ?20.8%, ?12.9% and ?8.0%, respectively, and the product accuracy increased by 17.0%, 18.0% and 7.6%, respectively. These values agree well with the above-mentioned analysis of the difference in the accuracy of the PWV retrievals based on the use of pre-launch and on-orbit operational calibration coefficients. The validation results in Fig. 7 also illustrate that, by using the current operational calibration coefficients, good accuracies of the final PWV products—that is, the three-channel weighted ones [Eq. (8)]—are achieved, with an RMSE and RB of 3.42 mm and ?13.36%, respectively, which are comparable with values obtained for other global remote sensing products of the same type, such as the NIR PWV products from MODIS. Typical RB and RMSE values in the MODIS NIR PWV products are 5%–10% and less than 3 mm, respectively (Gao and Kaufman, 2003). Larger errors, with RB > 10% and RMSE between 4 and 13 mm, have also been reported for MODIS under humid conditions, such as in summer or in coastal areas (Liu et al., 2013, 2015b; Wong et al., 2015).
 Figure7. Scatterplots between the water vapor values measured with GPS and those retrieved from MERSI-II NIR channels for the period 24–29 May 2018 globally: (a–d) pre-launch calibration coefficients used to calibrate MERSI-II L1B data; (e–h) on-orbit operational calibration coefficients used to calibrate MERSI-II Level-1B data. The gray dashed line has a 1:1 ratio.
2
4.2. Status and samples of the operational PWV products from MERSI-II
The MERSI-II NIR PWV products have been routinely produced at the National Satellite Meteorological Center, China, since June 2018, several months after the launch. The products can be downloaded from the FengYun Satellite Remote Sensing Data Service Network (Figures 8–10 show a few examples of Level-2 5-min granule water vapor images and Level-3 daily and monthly mean water vapor images. Figure 8b presents an example of a Level-2 PWV image over the Arabian Peninsula obtained at 1000 UTC 13 September 2019. The corresponding true color image composite processed from the MERSI-II L1B radiance of channels centered at 650 nm (red), 550 nm (green) and 470 nm (blue) is shown in Fig. 8a. The Arabian Peninsula is located at 13°N–20°N and is a flat plateau with an average altitude of 1200–2500 m. This region is characterized by a tropical desert climate with little precipitation. The hot and dry climate results in a large desert within this region, accounting for approximately one-third of the total area (Fig. 8a, yellow–brown colors). The PWV image in Fig. 8b illustrates that only the parts close to water bodies have relatively higher moisture contents, with water vapor contents in the range of 20–40 mm, while the water vapor concentrations across the rest of the area are small (mostly < 20 mm), which is consistent with the dry climate characteristics. Further, the variation of the PWV over the inland area is weak because of the flat plateau.
 Figure8. (a) Example of a MERSI-II Level-2 PWV image over the Arabian Peninsula obtained at 1000 UTC 13 September 2019 and (b) the corresponding true color image composite processed from the MERSI-II Level-1B radiance of channels centered at 650 nm (red), 550 nm (green) and 470 nm (blue). There are no PWV retrievals over the water bodies, except for the sun-glint region of the ocean.
 Figure10. Monthly averaged global Level-3 water vapor images derived from FY3D MERSI-II NIR channel observations in (a) July 2019, (b) October 2019, and (c) December 2019.
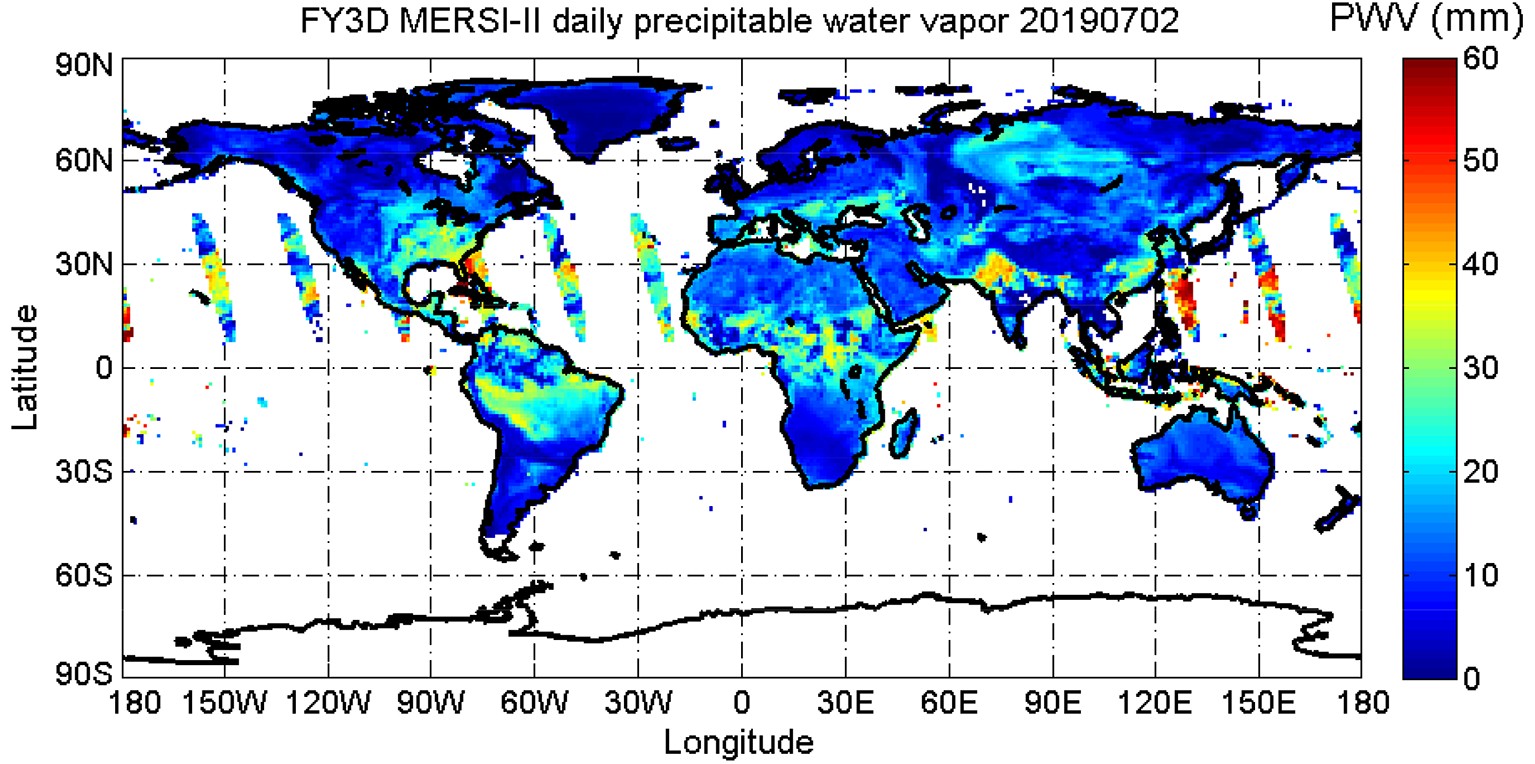 Figure9. Daily global Level-3 water vapor images derived from FY3D MERSI-II NIR channels on 2 July 2019.
Figure 9 is an example of a MERSI-II Level-3 daily global PWV image obtained on 2 July 2019. There are no PWV retrievals over the ocean, except for the sun-glint area (oval region in Fig. 9). Regions with solar zenith angles above 72° also has no retrievals, as the observation time is close to night and the energy at the satellite’s entrance is weak. Figure 9 shows that the daily PWV product contains fine spatial variation patterns of the water vapor and thus can be used for the analysis of the spatial distribution of the PWV over a large area. A high PWV content is typically observed near the equator. High PWV values (> 35 mm) are also detected in the land area, such as in the Amazon rainforest in South America, South Asia, southeastern China, Southeast Asian islands, and central and southern Africa. Furthermore, sub-high water vapor concentrations (> 25 mm) can be detected in northeastern China, central Europe, southern Russia, and the southeastern United States. Because July corresponds to winter in the Southern Hemisphere, the water vapor contents over the southern parts of South America and Africa, as well as Australia, are small (< 20 mm).
Figure 10 presents examples of Level-3 monthly averaged PWV images for the entire globe for the months of July, October and December in 2019. The PWV contents in eastern China increase with decreasing latitudes. The interannual variation of the PWV distribution is significant in midlatitude areas. From July to December—that is, from summer to winter in the Northern Hemisphere—a decrease in the PWV content can be observed in the southeastern United States, southern parts of India, and southeastern China. In contrast, a slight increase in the PWV content can be observed in the midlatitude regions of the Southern Hemisphere because the seasonal changes are opposite to those in the Northern Hemisphere. In the tropical and high-latitude areas, the interannual variation of the PWV distribution is weak. The analysis of the water vapor images in Figs. 10a–c shows that the Level-3 monthly mean PWV images can be used to study the seasonal variations of water vapor on a global scale.
2
4.3. Validation of the MERSI-II NIR PWV products via ground-based measurements
To validate the accuracy of the NIR PWV products, we compared the MERSI-II NIR water vapor values with those measured by the ground-based instrument, i.e., GPS, from January to December 2019. The GPS sites located in North America were used for comparison because data updates for other global sites have stopped since October 2018 to this June. Figure 11a shows a scatterplot of the water vapor values measured with the GPS and those measured with MERSI-II on clear days. A high correlation coefficient (R2 = 0.96) was obtained, suggesting good agreement between the two sets of data. The RMSE, MB and RB were 3.87 mm, ?2.31 mm and ?10.87%, respectively, indicating a relatively small systematic bias. Figure 11b presents a histogram of the PWV retrieval error (RB) in different channels. In general, the peak value of RB in all three absorption channels ranges from ?9% to ?16%, with 905 nm a sight larger than the other two channels. Hence, the RB of the final PWV product can be expected to be controlled at less than ?10%, through improving the PWV retrieval accuracy at 905 nm. Overall, however, the accuracy of the current NIR PWV products of MERSI-II has significantly improved compared with the previous MERSI. In previous studies, a negative RB of 30%–40% was reported for the FY-3A/MERSI NIR PWV products (Hu et al., 2011; Gong et al., 2018).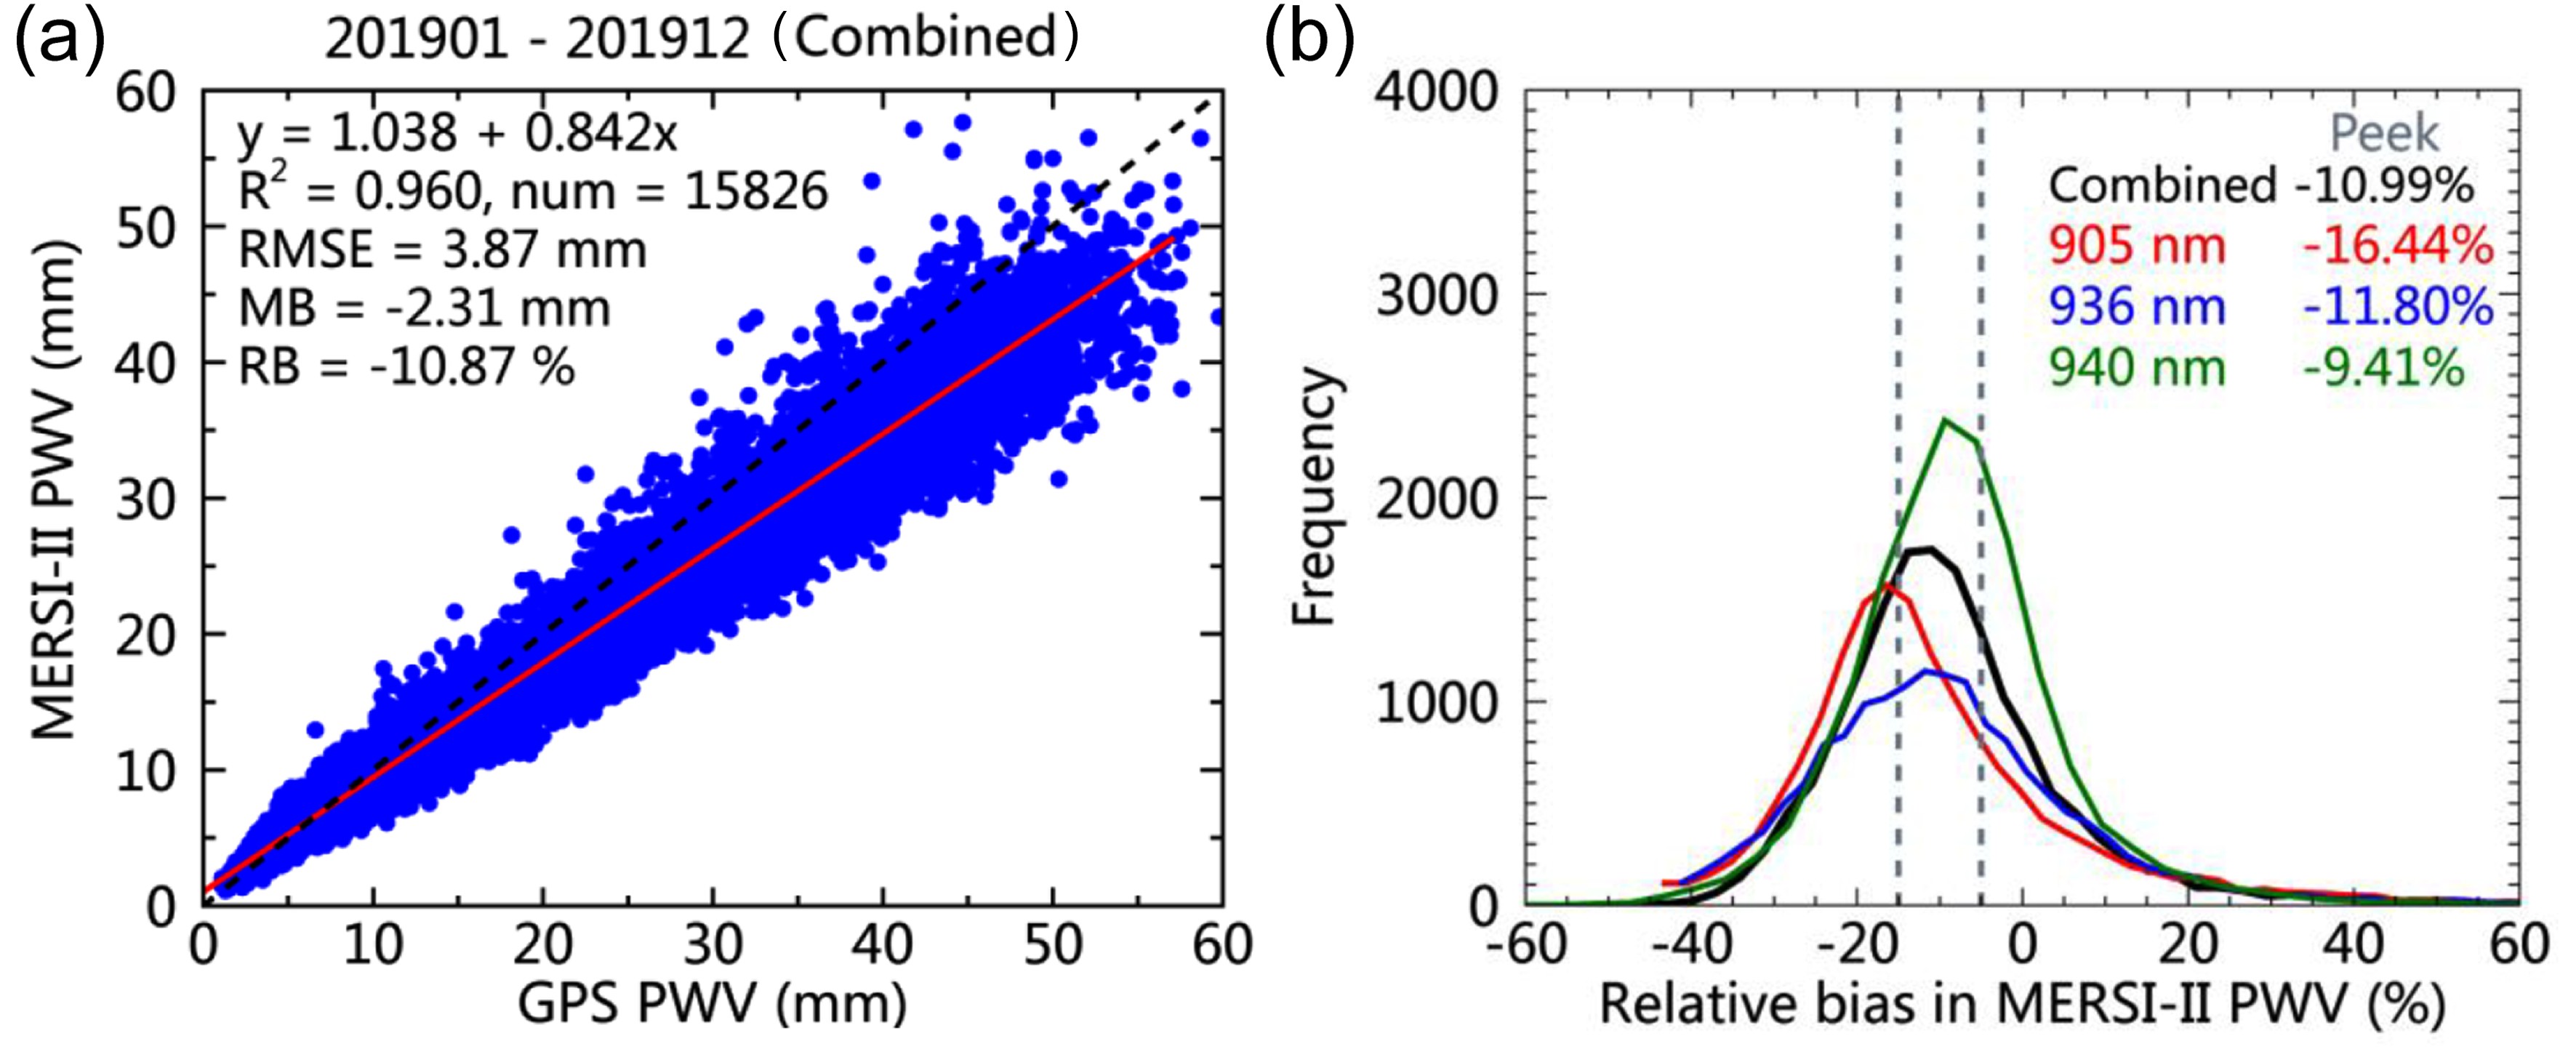 Figure11. (a) Scatterplot of the water vapor values measured with the GPS and MERSI-II NIR PWV values measured on clear days from January to December 2019 over North America. (b) Histogram of the difference between the GPS-measured and MERSI-II-retrieved PWVs using different channels.
The monthly mean RB and RMSE of the MERSI-II NIR PWV products on clear days are shown in Fig. 12. The error variations show an apparent seasonal pattern. The largest error appears in summertime, with an RB and RMSE of ?14.3% and 5.5 mm, respectively. The smallest error appears in winter, with an RB and RMSE of around ?3.0% and 1.8 mm, respectively. Overall, during the one-year period after the on-orbit test, the RB and RMSE of MERSI-II NIR PWV products were better than ?15% and 5.5 mm, respectively, which is consistent with the accuracy obtained during the on-orbit test, suggesting a good calibration accuracy and high radiometric stability of the five corresponding channels of the MERSI-II instrument used for NIR PWV remote sensing.
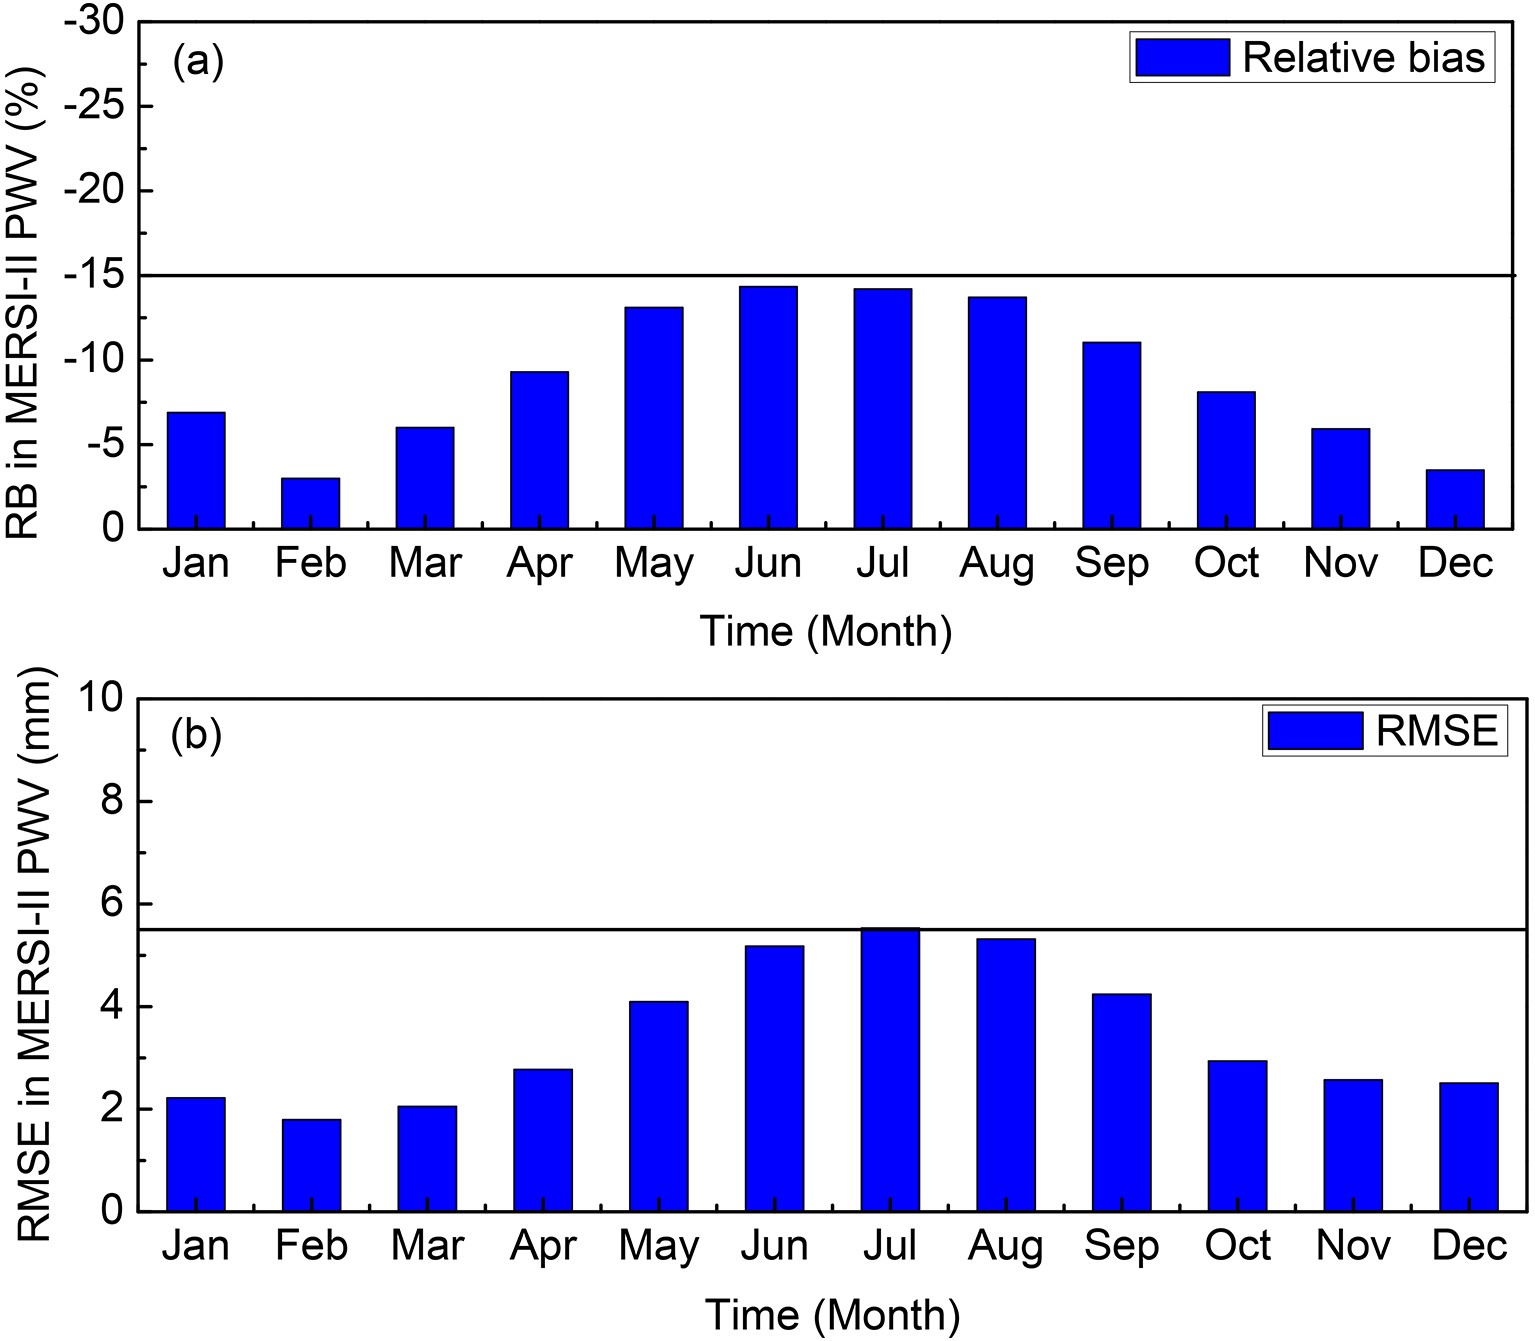 Figure12. (a) Monthly mean RB and (b) RMSE of the MERSI-II NIR PWV products compared with the GPS measurements from January to December 2019 over North America.
Regarding the instrument improvements related to NIR PWV retrieval, the settings of the water vapor absorption channels are more reasonable than those used in the previous version, MERSI. In MERSI, two weak absorption channels at 905 and 980 nm were adopted. The simulated transmittances show that these two channels are both more sensitive to changes in the concentration of atmospheric water vapor under dry conditions. To avoid redundant information, only one weak absorption channel at 905 nm was kept in MERSI-II and the 980 nm channel was replaced with a wide and strong absorption channel at 940 nm. The sensitivity to changes in the water vapor content of this channel is between that of the other two channels, providing additional information for the water vapor retrieval under intermediate water vapor conditions. Accordingly, MERSI-II provides more information under different conditions (dry, intermediate, and humid).
The radiometric calibration accuracy affects the precision of the PWV products retrieved using NIR channels. The absolute value of the PWV retrieval error is equivalent to the calibration bias; the error of the 905 nm channel is slightly larger than that of the other two water absorption channels. A WD-IVC calibration method was applied for on-orbit operational calibration updates in MERSI-II, leading to a decrease in the calibration uncertainty based on the use of different types of automatic on-orbit VC methods. Based on the use of the WD-IVC method, the long-term calibration accuracy of the five channels used for the PWV retrieval has been maintained within ±5% since MERSI-II’s launch.
Benefitting from MERSI-II’s better channel setting in the NIR spectral region as well as sound and stable calibration accuracy, the quality of the NIR PWV products of MERSI-II has significantly improved compared with that of the previous MERSI. The RB and RMSE of the PWV values were estimated to be better than ?15% and 5.5 mm, respectively, one year after the launch. The granule Level-2 “pixel-based” NIR PWV product and the daily, 10-day and monthly Level-3 NIR PWV products (global 0.05° × 0.05° latitude–longitude grid) have been routinely produced and archived at the National Satellite Meteorological Center computing facility since June 2018. These products are useful for the study of seasonal and annual variations of water vapor content on regional and global scales.
The small systematic underestimation of the current NIR PWV products will be further investigated in the next step. For example, the precision of the transmittance calculation by MODTRAN4.3, the uncertainty in the surface spectra reflectance, and the influence of high aerosol loadings (e.g., dust, haze) as well as thin cirrus clouds on the PWV retrieval should be studied in the future.
Acknowledgements. This research was funded by the National Key R&D Program of China (Grant Nos. 2018YFB0504900, 2018YFB0504901, and 2018YFB0504802) and the National Natural Science Foundation of China (Grant Nos. 41871249 and 41675036). The authors thank SuomiNet for providing the GPS data, as well as the FengYun Satellite Remote Sensing Data Service Network for providing the FY-3D/MERSI-II data.
