HTML
--> --> -->Previous studies had measured atmospheric amines in urban, rural, coastal and marine areas (Kieloaho et al., 2013; Shen et al., 2017; Liu et al., 2018; Zhou et al., 2019). It is recognized that in coastal regions and marine areas, the main sources of amines are biological activities on the ocean surface, rather than industry and combustion sources (Facchini et al., 2008; Müller et al., 2009), which is different from urban areas (Zhou et al., 2019) where industrial sources dominate (Shen et al., 2017). For example, higher DEA and TMA were observed on the days with stronger biological activities compared to the days with reduced biological activities in the North Atlantic. Additionally, the mass fraction of amines in WSON (water-soluble organic nitrogen) also increased on the days with stronger biological activities (Facchini et al., 2008). In fact, DEA and TMA could be emitted from marine sources as gaseous species and then partition to particle phase (Yu et al., 2016). To date, studies on particulate amines are still rare, especially field studies in coastal and rural areas. The pollution levels, influencing factors, and size distributions of amines have yet to be fully investigated (Xie et al., 2018). Considering the importance of amines in atmospheric chemistry, it is essential to conduct additional measurements on amines in different environments and/or seasons.
The Yangtze River Delta (YRD), China is one of the most developed regions in the world and is suffering from complex atmospheric air pollution, although China had taken strong action to reduce pollutant emissions (Zhang et al., 2012; Liu et al., 2016; Wang et al., 2016; Chen et al., 2017; Ge et al., 2019). Chongming Island, which is located in a rural section of the YRD, near East China Sea, has less local industry and is usually considered as a background site of YRD region (Wang et al., 2020). As a rural and coastal site that is displaced from mainland, the atmosphere of Chongming Island could be influenced by local marine emissions and/or transport from nearby cities. Nowadays, the Chinese government is trying to build Chongming Island into the largest Eco-Island in the world, so special attention has been paid to its atmosphere. In this study, field observations were conducted to investigate the particulate amines at Chongming Island during the summer of 2018. The concentrations of four amines in the PM2.5 category, including methylamine (MA), dimethylamine (DMA), diethylamine (DEA), and trimethylamine (TMA), were determined from 30 May to 15 August, and their size distributions were also documented. The main objectives of this study were to investigate: 1) concentration levels of atmospheric amines in the background region of the YRD in summer; 2) their size distribution characteristics; 3) the impact of environmental factors on particulate amines; and 4) the potential sources of the particulate amines in the background atmosphere of YRD. The results of this study could help researchers to better understand the atmospheric behavior of amines, which is valuable for policy makers to build a world-class Eco-Island.
2.1. Study site and field observations
The field measurement was conducted at the Wetland Ecological Observation Station of East China Normal University, which is located in Chongming Island (31°44'03"N, 121°12'39"E). The observation station is near the Yangtze River and East China Sea and surrounded by farmlands and native plants, in the absence of local industrial sources. The location of the sample site in the present study is shown in Fig. S1 in the electronic supplementary material (ESM).The warm season observational period was conducted from 30 May to 15 August 2018. Diurnal (0700?1900 LST; LST = UTC + 8) and nocturnal (1950?0650 LST) PM2.5 (particulate matter with aerodynamic diameter less than 2.5 μm) samples were collected by using a high-volume sampler (TISCH, Tianhong, China) equipped with a pre-baked quartz filter (Whatman). The field operation yielded 147 valid PM2.5 samples noting that several samples were discarded due to unexpected damage to the filter.
In order to investigate the size distribution of atmospheric amines, size-segregated samples were also collected during the observation period using a nine stage Micro-Orifice Uniform Deposit Impactor (28.3 L min–1, Anderson, Thermo Electron Corporation, USA) and 80 mm quartz filters. The cutoff points of the size-segregated samplers were 0.43, 0.67, 1.1, 2.1, 3.3, 4.7, 5.8 and 9.0 μm, respectively. The flow rate of the sampler was calibrated before and after each sampling cycle. Each set of size-segregated samples was collected based on a 3-day duration. Finally, a total of 3 sets of samples were obtained during the study period, which was from 5 to 8 June, from 8 to 11 June, and from 14 to 17 June, respectively.
Trace gas pollutants including NH3, HONO, SO2, and HNO3 were measured by an online-IC system called IGAC (In-situ Gases and Aerosol Composition monitor, Fortelice International Co., Ltd.). The detailed information about the measurement of trace gas pollutants can be found in our previous study (Xie et al., 2020). The concentration of ozone, O3, was continuously measured using a real-time monitor (49i, Thermo Fisher Scientific Inc. USA). All of the trace gas pollutants were measured hourly and average values were calculated to fit the same interval with PM2.5 samples for further analysis.
2
2.2. Laboratory analysis
PM2.5 filters were gravimetrically measured using a high precision digital balance (Sartorius, G?ttingen, Germany). The filters were conditioned in a desiccator for at least 24 hours with a temperature of 25°C?30°C and a relative humidity of 45%?55% before weighing. The concentrations of WSTN (water-soluble total nitrogen), WSOC (water-soluble organic carbon), and WSON (water-soluble organic nitrogen) were measured using a TOC-L CPH analyzer (Shimadzu, Japan). The EC (element carbon) and OC (organic carbon) in the filter samples were measured by the DRI Model 2001 carbon analyzer following the IMPROVE thermal/optical reflectance (TOR) protocol.PM2.5 and size-segregated sample filters were placed into a polypropylene jar (Nelgene) with 15 mL of ultrapure water, for a 60 min ultrasonic extraction prior to another 60 min oscillation in a shake bed. Then, the extract was filtered through a 0.45 μm PTFE filter before the amine and ion measurement. An ion chromatograph (IC-940 Professional, Metrohm) was used for the detection of amines and other ions. The column Supp5-150/4.0 was used to determine the anions, including Cl?,


2
2.3. Auxiliary data
The 1 h resolution meteorological data for the Xisha water source station located at Chongming Island was obtained from the National Climatic Data Center (NCDC,2
2.4. Quality control and data analysis
The filters were baked at 550°C for at least 4 hours before sampling. Field and procedure blanks were analyzed along with the samples, and the values of the blanks were subtracted from the sample results.The PMF model was used to identify the potential source of amines. The principles of the PMF model can be found elsewhere (Jaeckels et al., 2007; Yu et al., 2013). The PM2.5 particles included in the identification were: total amines; MA; DMA; DEA; TMA; EC; OC; WSOC; WSON; Na+; K+; Mg2+;Ca2+;


The data presented in this study was analyzed using the SPSS 23.0 instrument (IBM Corporation, Armonk, NY, USA) prior to applying a Kolmogorov-Smirnov Z test and a Spearman correlation, noting a significance level of 0.05.
3.1. Level of pollutants
The concentrations of the measured amines in PM2.5, and other major components of PM2.5, trace gas pollutants, and the P values of diurnal and nocturnal difference are provided in Table 1. It should be noted that the concentration of TMA in about 25% of the samples were under the detection limit, thus a zero was used in these cases for the purpose of calculating the mean value of TMA. The average concentrations of MA, DMA, DEA, and TMA (mean ± standard deviation) were: 15.0 ± 15.0; 6.3 ± 6.9; 20.4 ± 30.1; and 4.0 ± 5.9 ng m–3, respectively. The relative abundance of amines followed a decreasing trend of DEA > MA > DMA > TMA, but the difference between DMA and TMA was not significant (P > 0.05). The total amines concentration (sum of the four measured amines) during the sampling period was 45.6 ± 43.9 ng m–3 with a range of 34.4 to 328 ng m–3. The four measured amines were found to be significantly correlated with each other (P < 0.05). Specially, TMA was usually considered as the precursor of DMA in seawater (Lidbury et al., 2014), which is consistent with the robust relationship between these two amines in the present study (Table S1 in the ESM). Our results are also consistent with the premise that the sources of these two amines might be partially from marine sources (Yu et al., 2016). The nitrogen in the total amines contributed to WSON with a range of 0.005 to 0.33 (mean: 0.03), and the mean value of mass ratio of amines/WSOC was 0.04. Although the mass fraction of amines was not very high in WSON and WSOC, they were also an important contributor of SOA (Facchini et al., 2008). Apart from DMA, other measured amines did not show significant differences between diurnal and nocturnal values. DEA and MA were higher in day time, but the differences were not significant. Similar to the total amines, WSON and OC did not exhibit significantly different behavior between their diurnal and nocturnal values, which is opposite to the behavior of NH4+, WSTN, and EC.| Species | Diurnal | Nocturnal | P | Daily | |
| (a) Amines in PM2.5 (ng m?3) | |||||
| MA | 16.1±16.0 | 13.8±14.0 | 0.886 | 15.0±15.0 | |
| DMA | 6.8±5.4 | 5.9±8.3 | 0.013 | 6.3±6.9 | |
| DEA | 21.7±31.1 | 19.3±29.9 | 0.075 | 20.4±30.1 | |
| TMA | 3.4±4.9 | 4.6±6.8 | 0.133 | 4.0±5.9 | |
| Total | 47.7±41.4 | 43.6±47.0 | 0.131 | 45.6±43.9 | |
| (b) Other species in PM2.5 (μg m?3) | |||||
| PM2.5 | 32.5±19.7 | 34.5±23.0 | 0.491 | 33.4±21.2 | |
| WSTN | 2.5±2.0 | 3.9±3.6 | 0.022 | 3.2±2.9 | |
| WSON | 0.38±0.32 | 0.50±0.60 | 0.191 | 0.44±0.48 | |
| WSOC | 2.2±2.2 | 1.7±1.9 | 0.057 | 1.9±2.0 | |
| EC | 0.89±0.66 | 1.02±0.98 | 0.008 | 0.95±0.83 | |
| OC | 3.7±2.5 | 3.0±2.5 | 0.886 | 3.3±2.5 | |
| Levoglucosana | 8.0±9.4 | 16±22 | 0.013 | 12±17 | |
| F? | 0.01±0.01 | 0.01±0.01 | 0.185 | 0.01±0.01 | |
| Cl? | 0.22±0.20 | 0.40±0.40 | 0.000 | 0.31±0.30 | |
| ${\rm {NO}}_2^- $ | 0.13±0.09 | 0.10±0.07 | 0.255 | 0.11±0.08 | |
| ${\rm {NO}}_3^- $ | 2.3±2.3 | 5.0±5.9 | 0.001 | 3.59±4.61 | |
| ${\rm {SO}}_4^{2- }$ | 5.9±3.4 | 5.9±3.3 | 0.964 | 5.87±3.31 | |
| Na+ | 0.69±0.60 | 0.63±0.50 | 0.491 | 0.65±0.50 | |
| ${\rm {NH}}_4^+ $ | 2.1±1.6 | 3.0±2.5 | 0.036 | 2.5±2.1 | |
| K+ | 0.10±0.11 | 0.16±0.28 | 0.886 | 0.13±0.21 | |
| Mg2+ | 0.10±0.05 | 0.09±0.05 | 0.057 | 0.09±0.05 | |
| Ca2+ | 0.24±0.14 | 0.18±0.10 | 0.022 | 0.21±0.13 | |
| (c) Trace Gas pollutants (μg m?3) | |||||
| NH3 | 4.4±4.0 | 4.8±6.2 | 0.809 | 4.6±5.1 | |
| HF | 0.25±1.38 | 0.06±0.06 | 0.463 | 0.16±0.98 | |
| HCl | 0.31±1.18 | 0.13±0.04 | 0.006 | 0.22±0.84 | |
| HONO | 0.92±1.28 | 1.08±0.86 | 0.049 | 1.07±1.35 | |
| HNO3 | 0.51±1.46 | 0.19±0.18 | 0.002 | 0.35±1.05 | |
| SO2 | 2.0±2.0 | 1.2±0.8 | 0.077 | 1.6±1.6 | |
| O3 | 117±47 | 64±25 | 0.000 | 91±45 | |
| Notes: a: the unit for this species was ng m?3. | |||||
Table1. Concentrations of measured amines in PM2.5, other major components of PM2.5, trace gas pollutants, and P value of diurnal and nocturnal difference. Data shown is the mean and standard deviation.
Table S1 in the ESM provides the Spearman correlation between amines and other components. In most cases, MA, DMA, and DEA showed better correlations with other pollutants than TMA. Significantly positive correlations were found between amines and PM2.5, WSTN, WSON and WSOC, which is to be expected as the measured amines were organic compounds bounded to PM2.5. Amines were also found to be correlated with secondary inorganic components including


2
3.2. A comparison with previous studies
Previous studies had conducted several field observations of particulate amines in urban, rural, coastal, forest, and marine areas in summer, which were summarized and provided in Table S2 in the ESM. Generally, our measurement of DMA was 6.3 ± 6.9 ng m–3, lower than those measured in urban Shanghai (Tao et al., 2016; Zhou et al., 2019), urban Nanjing (Shen et al., 2017), and urban Guangzhou (Liu et al., 2017), and urban Tampa Bay in the USA (Calderón et al., 2007). This result could be explained if the primary source of DMA was a consequence of anthropogenic activities, which was less pronounced in the study site compared to the urban areas, which have a greater presence of industry emissions (Zhou et al., 2019). Recall, that the DMA in our study was also lower than other studies that were conducted in marine and coastal areas (Sorooshian et al., 2009; Hu et al., 2015; Xie et al., 2018; Zhou et al., 2019), which is to be expected since the site in the present study was a background site away from industry sources, and the biological activities in the study site were weaker than a coastal site. For MA, the concentration in our study was lower than that measured in urban Guangzhou (Liu et al., 2013), but higher than those measured in urban Shanghai (Tao et al., 2016) and forest regions (Hemmil? et al., 2018; Liu et al., 2018). The result here might indicate that compared to DMA, the origin of MA is more strongly tied to biological activities instead of to industrial emissions in Chongming Island. The sum of DEA and TMA (TMDEA) was used for comparison in this study in an effort to be consistent with previous studies. In this study, the concentration of TMDEA was 24.2 ± 30.7 ng m–3, significantly higher than a summer study in 2013 (1.7 ± 1.6 ng m–3), but lower than another summer study in 2013 (38.8 ± 17.0 ng m–3), which were both conducted in urban Shanghai (Tao et al., 2016; Zhou et al., 2019). The notable concentration differences between these two urban studies is likely attributed to in the distances between the sampling sites and industry sources. (Tao et al., 2016; Zhou et al., 2019). Interestingly, the TMDEA in the present study was higher than urban and forest observations but comparable with or lower than those measured in a marine environment. (Sorooshian et al., 2009; Hu et al., 2015; Hemmil? et al., 2018; Liu et al., 2018; Xie et al., 2018; Zhou et al., 2019). As mentioned above, DEA and TMA could be emitted from marine sources (Yu et al., 2016), the results here indicate that a marine source is possible for these two particular amines (DEA and TMA), which is consistent with the findings of previous studies (Yu et al., 2016; Zhou et al., 2019).2
3.3. Temporal variation
Figure 1 shows the temporal variation of major pollutants, including the four measured amines (Fig. 1a), PM2.5,

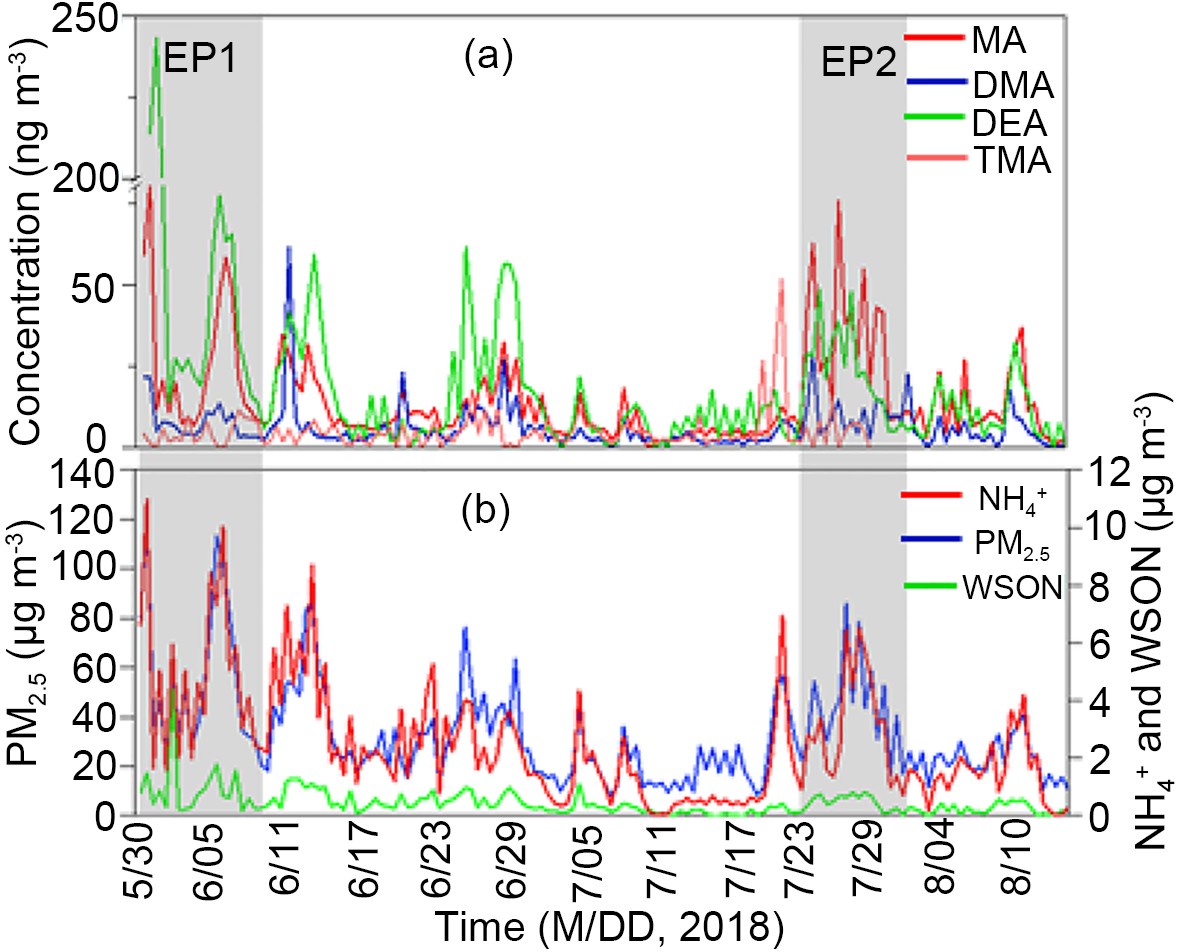 Figure1. The temporal variation of amines and other major pollutants during the campaign. Panel (a): measured amines including MA, DMA, DEA, and TMA; Panel (b):
2
3.4. Size distribution
In order to explore the size distribution of amines in PM2.5, size-segregated samples were collected and measured. It should be noted that DEA and TMA in some size bins were below the detection limit, thus only MA and DMA were used for analyzing their size distributions. Figures 2a-b showed the size distributions of MA, DMA,


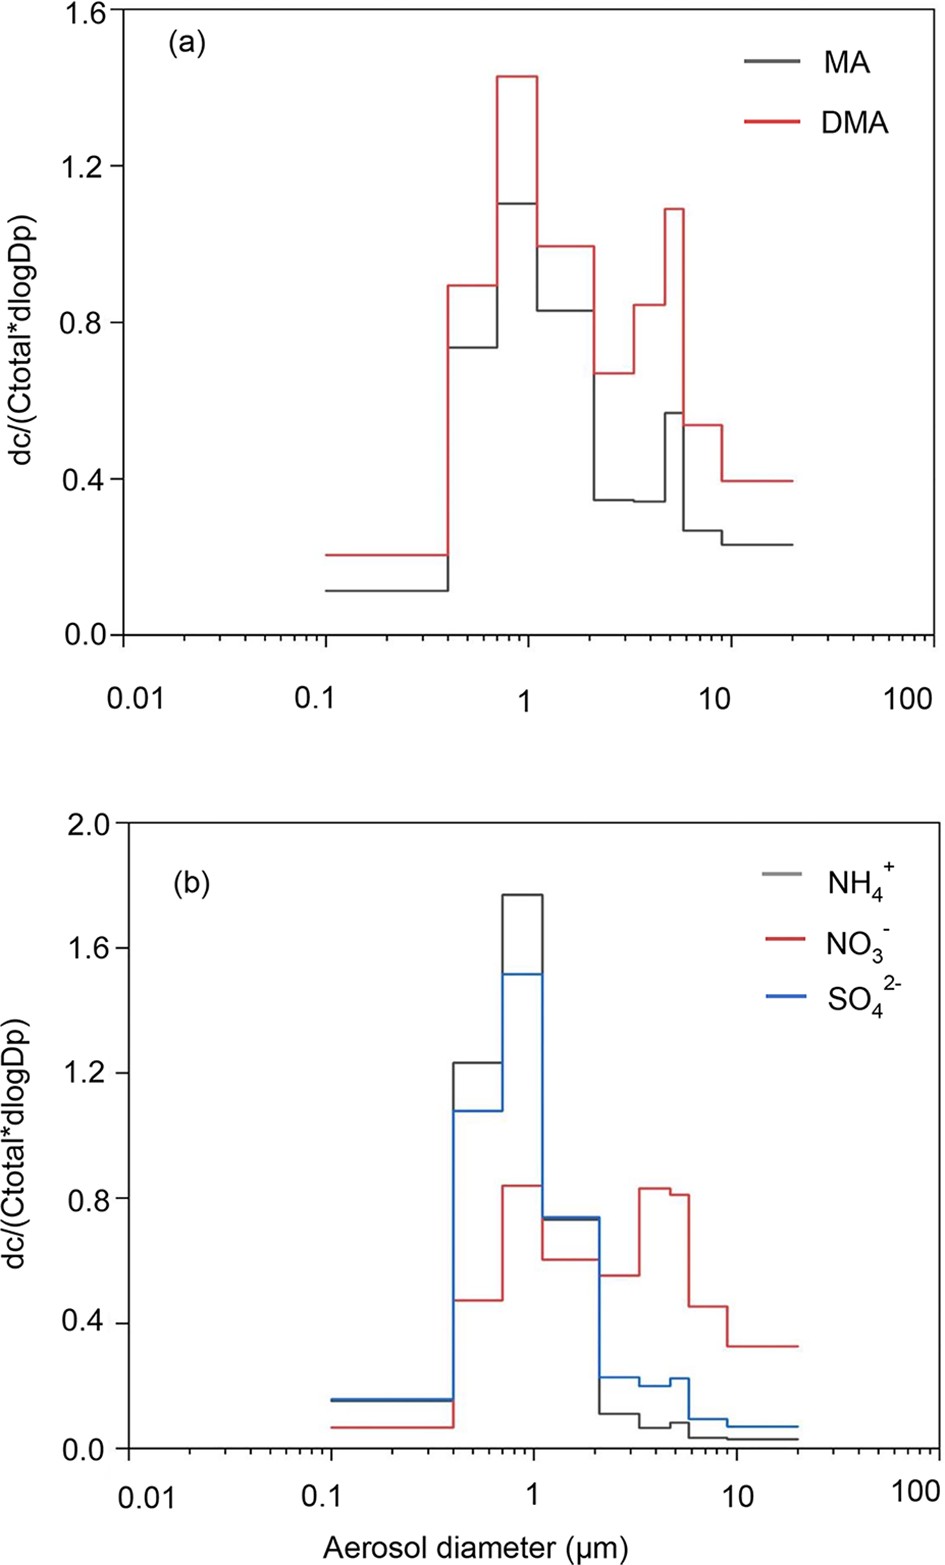 Figure2. The size distribution of amines and


2
3.5. Influencing factors
Concentrations of atmospheric amines could be influenced by various factors, such as temperature (T), boundary layer height (BLH), oxidizing capacity of atmosphere, and relative humidity (Ge et al., 2011b; You et al., 2014; Zhou et al., 2019). In this study, the relationship between amines and temperature was very weak, thus not discussed hereafter. Rather, we will discuss the impact of other factors such as boundary layer height (BLH), pH, aerosol liquid water content (ALWC) of aerosol, and relative humidity (RH) on the particulate amines.3
3.5.1. Boundary Layer Height (BLH)
As shown in Figs. 3a-d, three of the four measured amines (MA, DMA, and DEA) were found to have a significant negative correlation with BLH, with the notable exception of TMA. The possible reason for the weak relationship between TMA and BLH might be attributed to a difference of source for TMA compared to the other amines. BLH was also found to be positively correlated with wind speed although the correlation was marginally significant (Fig. S3 in the ESM), which suggests the possibility that the low wind speeds would result in substantial accumulation of fine particulate amines when the BLH was also low. Generally, a lower BLH is conducive to unfavorable diffusion conditions for amines in PM2.5, along with low wind speed, especially in winter (Liu et al., 2013). In this study, although the relationship between amines and BLH was weaker compared to a previous one-year study conducted in urban Shanghai (Zhou et al., 2019), BLH also showed a negative relationship with the amines. Figure3. The relationship between particulate amines and BLH, the values below the detection limit and the two highest values of DEA were not included in the calculation. Blue dots show the measurement data and black lines show exponential fitting of the data. Red circles and vertical lines show the mean and one standard deviation of concentrations of amines, with each bin representing the 20th percentile of relative BLH values.
3
3.5.2. Relative humidity
Figure S4 in the ESM shows the relationship between amines and relative humidity (RH). It was found that the amines have a negative relationship with RH. For MA and TMA, although, the relationships were not significant, which was different from DMA, DEA, and total amines. Previous studies found that higher RH was favorable for the gas-to-particle conversion of amines, thus amines bounded to PM2.5 were positively correlated to RH (Yu et al., 2016). Theoretically, high RH favors the gas-to-particle conversion of amines, while in this study, a dependency of amines upon RH, especially for DMA and DEA, was observed, which could be explained by the potential deposition of amines which is to be expected in high RH environments.3
3.5.3. pH and liquid water content of aerosol
Figure S5 in the ESM shows the relationships between total amines and pH and ALWC. The ALWC during the sampling period was 30.3 ± 35.6 μg m?3 and without significant day and night difference (P > 0.05). It was found that concentration of the total amines was positively correlated with ALWC (P < 0.05). As a group of water-soluble organics, high ALWC was favorable for amines partitioning into aerosols (Ge et al., 2011a), so it was not surprising to see a robust relationship between amines and ALWC. In the present study, the pH of aerosol during the campaign was 2.97 ± 1.10, indicating a strong acidity. The pH of aerosol was found to be negatively correlated with amines (Fig. S5 in the ESM), which was also an expected result, recalling that amines are alkaline substances. Theoretically, aerosols with low pH are favorable for amines partitioning into particles.2
3.6. Sources of amines
33.6.1. Marine source
As mentioned above, TMDEA (DEA+TMA) in Chongming Island was significantly higher than most urban areas, which implied marine sources contributed to these two particular amines substantially. This is not surprising since DEA and TMA could be emitted from a marine source in a gas phase before transitioning to a particle phase (Yu et al., 2016). Figures 4 a-c shows the backward trajectories starting from Chongming Island for the clean days (PM2.5 < 35 μg m–3) in different sampling months, it clearly suggested that during the sampling period, the majority of air masses predominantly originated from the East China Sea. Consistent with the above discussion, a marine source is a likely and essential origin for amines, especially during clean days when air masses are predominantly transported from marine areas.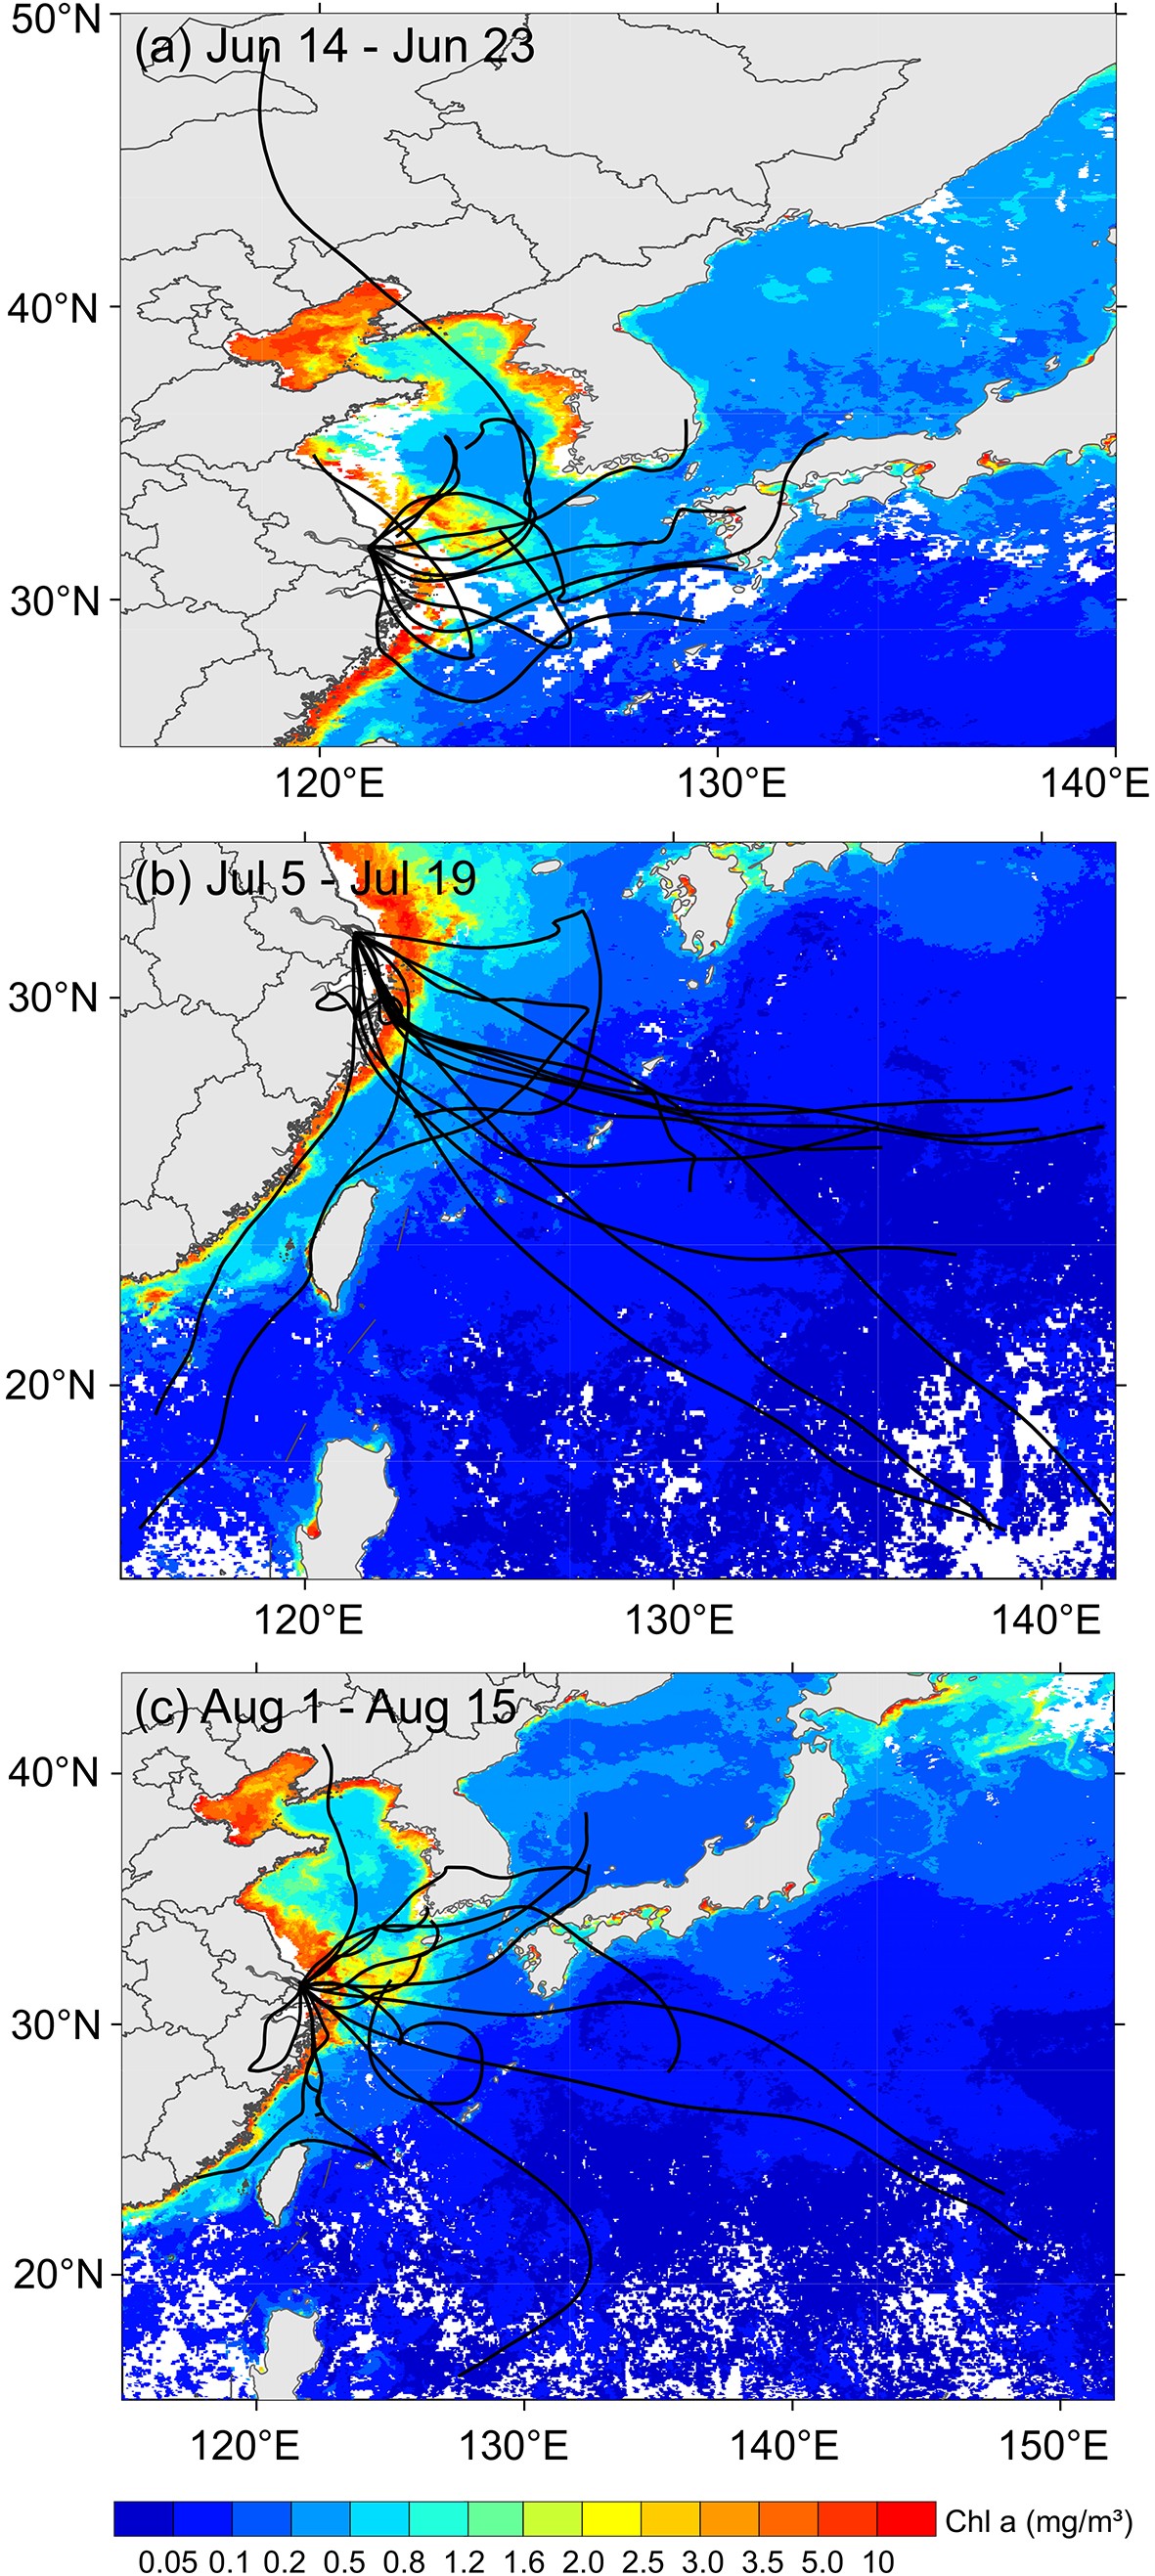 Figure4. The 72 h backward trajectories starting from Chongming Island and the average Chl a data was obtained from https://oceancolor.gsfc.nasa.gov/ in June (a), July (b), and August (c), respectively.
3
3.6.2. Anthropogenic Sources
As mentioned above, amines were strongly correlated with SNA, indicating that anthropogenic sources were also crucial for amines. Specially, DMA was proven to have a unique effect on new particle formation. Results in the present study also indicated that the air pollution in Chongming Island was possibly attributed to amines, especially during polluted days. Amines including DMA and MA could be emitted from coal or biomass combustion with emission factors at a level of 20 mg kg–1 (Shen et al., 2017). In the present study, the amines were also found to be significantly positively correlated with K+ and levoglucosan, indicating that biomass burning was a potential source of amines in Chongming Island. As an Eco-Island, Chongming Island has limited local industry, but the local, rural residents also burn biomass for cooking, which might be a source for the aerosol amines. This is consistent with previous studies; and, since the study site was not very far away from the mainland, it could also be influenced by air mass transport from the surrounding mainland such as Jiangsu province and Shanghai (Wang et al., 2020; Xue et al., 2020). Figure S6 shows the backward trajectories starting from Chongming Island in EP1 and EP2. As seen in Fig. S6 in the ESM, the majority of air mass originated from the mainland such as the YRD region and Shandong province in EP1 and EP2, which is dramatically different from the backwards trajectories for the clean days (Figs. 4a-c). Thus, during the polluted periods, the amines in Chongming Island were mostly derived from anthropogenic sources transported from the mainland. This result was consistent with our previous studies conducted on the same site and during the same periods, which focused on PAHs (polycyclic aromatic hydrocarbons) and inorganic ions (Wang et al., 2020; Xue et al., 2020), and also similar to a previous cruise campaign in the East China Sea (Liu et al., 2020).3
3.6.3. Contributions of Various Sources
In this study, the PMF was used to investigate the source apportionment of amines, thus, the total variable was set to be total amines. Finally, six sources were identified and shown in Figs. 5a-f. Generally, secondary sulfate, secondary nitrate, and secondary ammonia sources are identified based upon their high contributions of sulfate, nitrate, and ammonia, although some sources directly emitted sulfate, nitrate, and ammonia (Zhang et al., 2008; Pan et al., 2016; Lu et al., 2018). In this study, factor 1 was characterized by


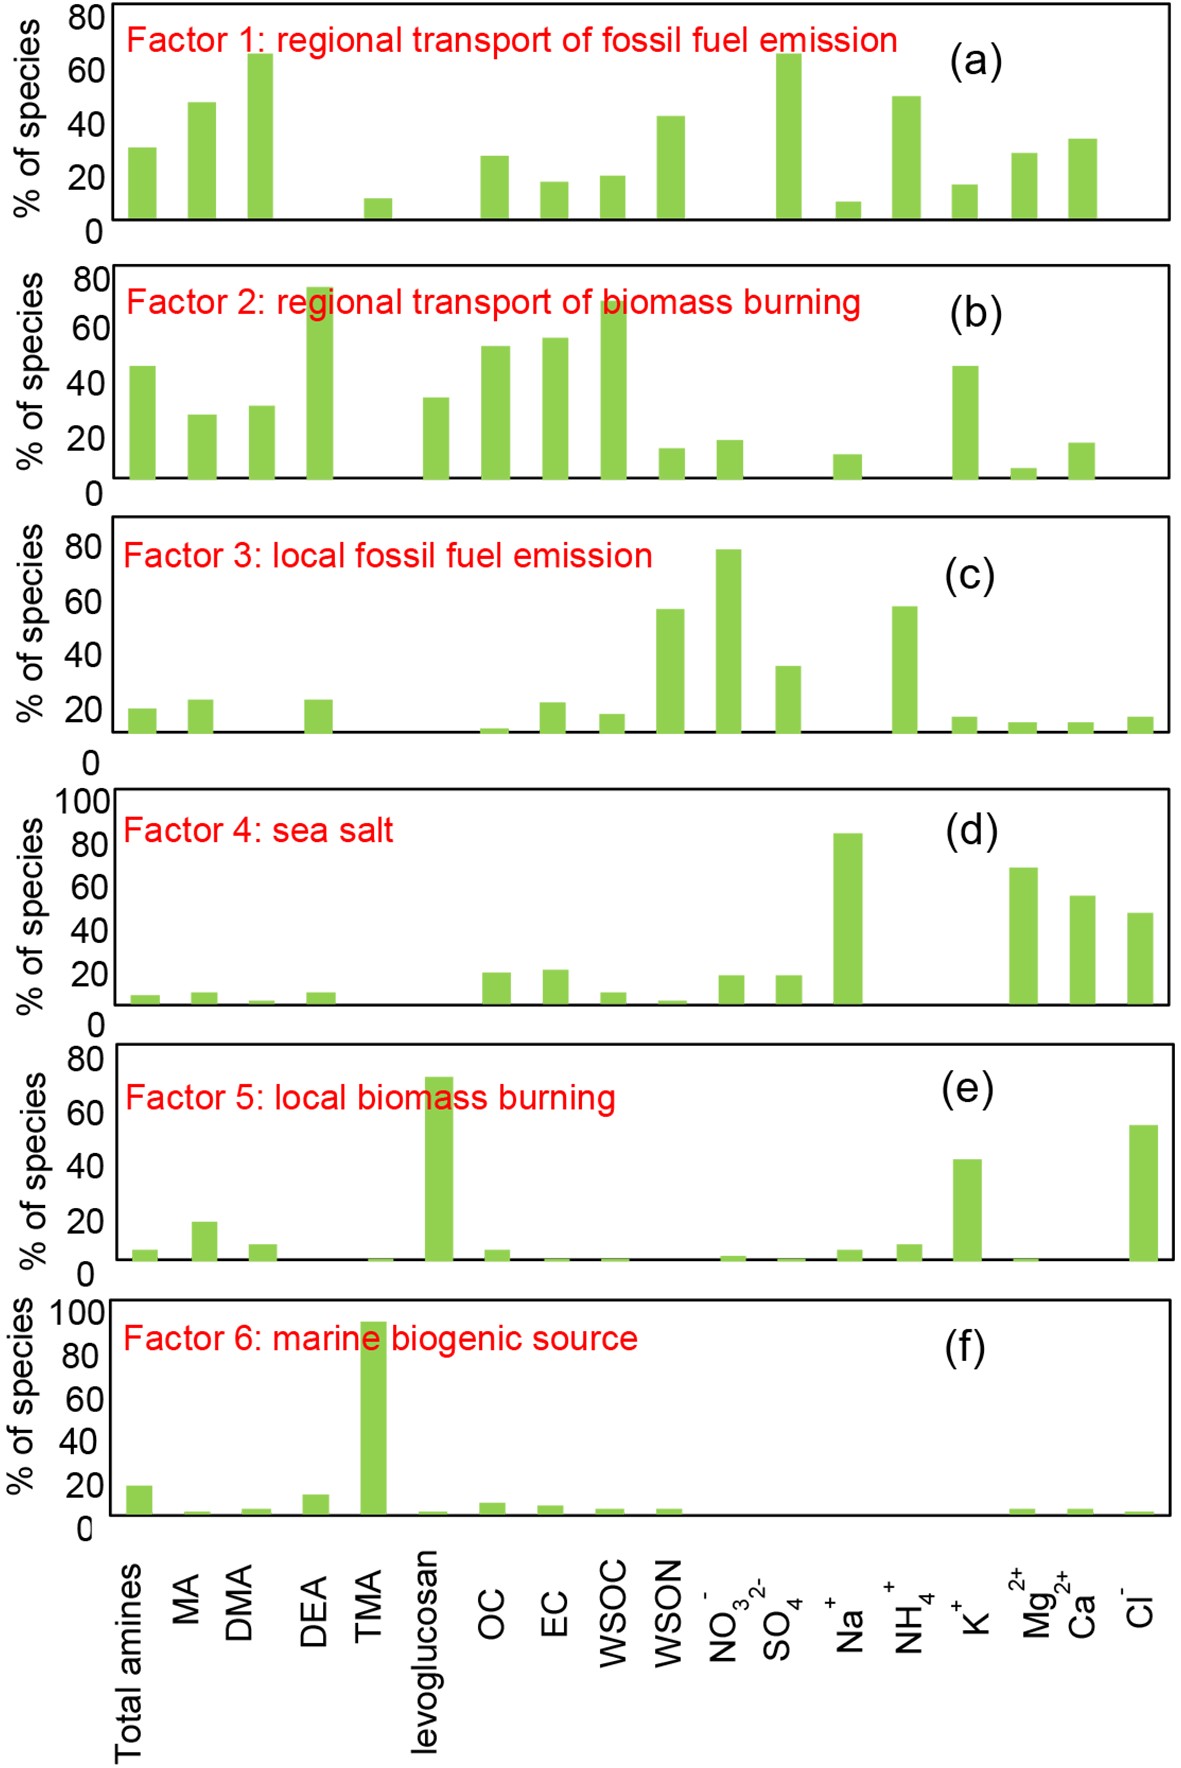 Figure5. The six sources identified from PMF model in the present study.
Figures 6a-c displays the relative contribution attributed to the above various sources on amines during the whole campaign of, EP1, and EP2. It was clearly indicated that the marine source (sea salt and biogenic source) in EP1 and EP2 was lower than the average value during the whole campaign, which was consistent with the results mentioned above. We also found the anthropogenic sources to be the dominant source of amines on the Chongming Island, from both local biomass and fossil fuel burning in addition to pollution transported from other provinces.
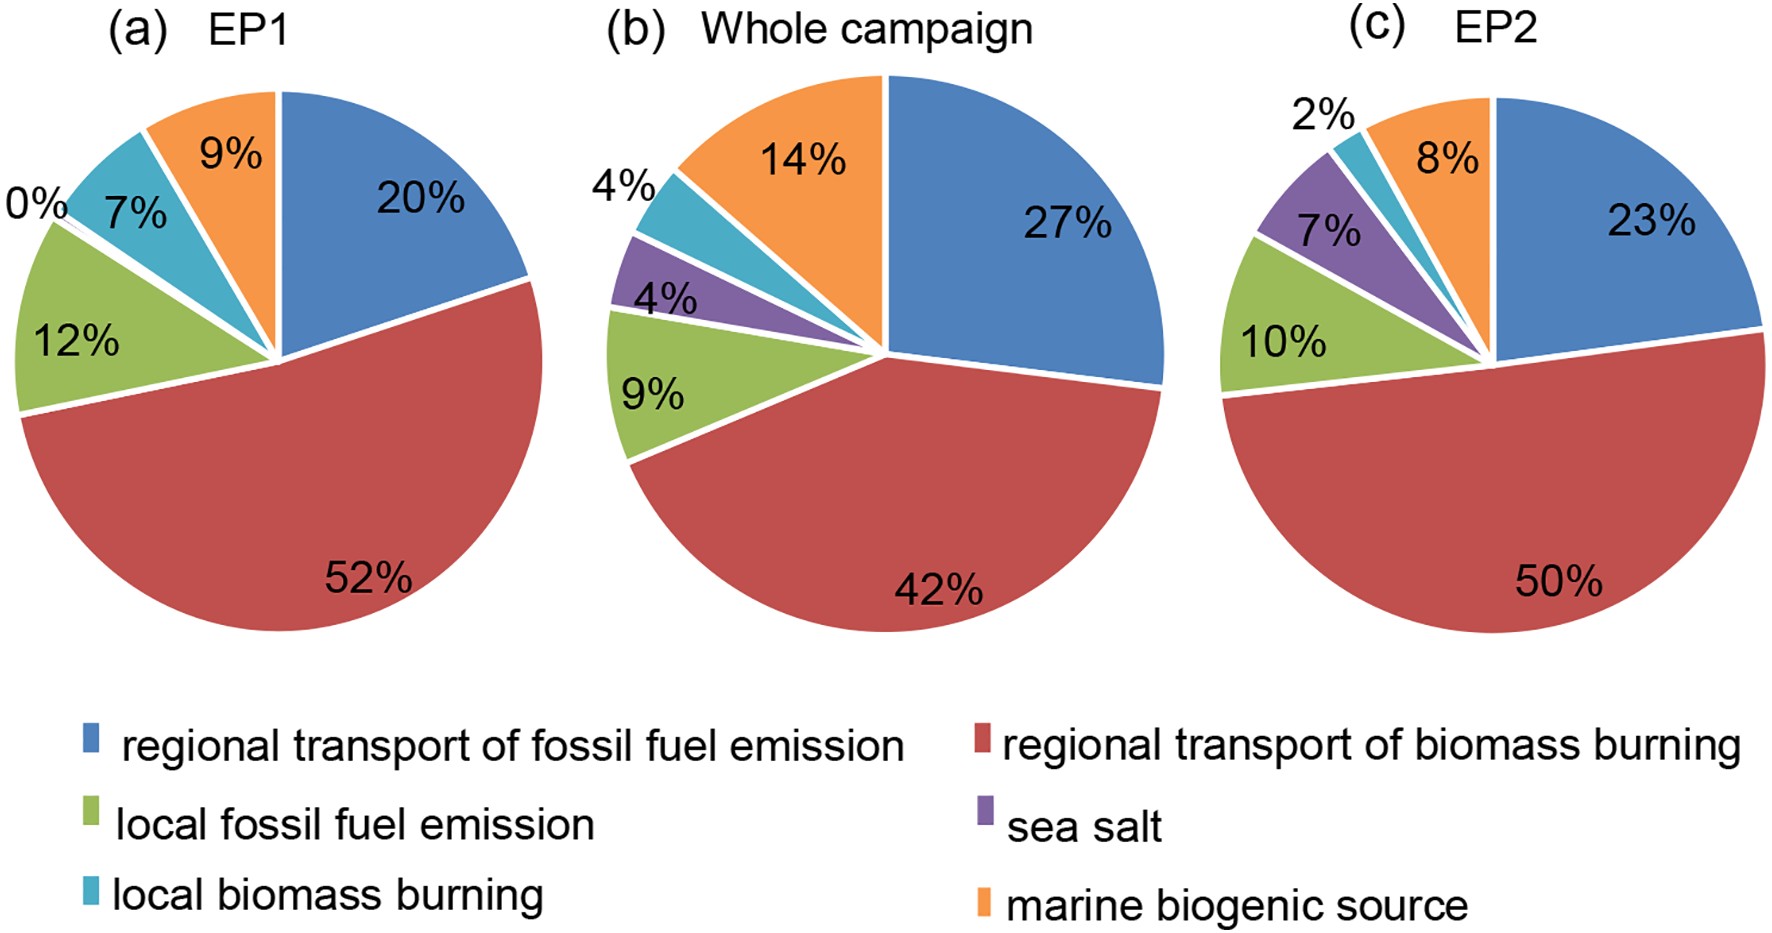 Figure6. The relative contribution of various sources of amines during the whole campaign, EP1, and EP2.
Acknowledgements. This work was financially supported by National Key R&D Plan, Ministry of Science and Technology of China—“Mechanism and chemical process characterization of atmospheric particulate matter multi-isotope fractionation” (Grant No. 2017YFC0212703), the program from National Natural Science Foundation of China (Grant No. 41773117), and the program of Happiness Flower Plan of East China Normal University of China.
Electronic supplementary material: Supplementary material is available in the online version of this article at
