HTML
--> --> -->The mean large-scale environment for rapidly intensifying TCs, as identified by the statistical analysis of Kaplan and DeMaria (2003), generally comprises weak vertical wind shear (VWS), high low-level moisture content, high upper-level divergence and weak external forcing from upper-tropospheric systems. Nevertheless, many studies have shown that other scenarios may also lead to RI occurrence. For instance, some TCs are capable of intensifying rapidly in moderate or strong VWS (e.g., Molinari and Vollaro, 2010; Rogers et al. 2015). Besides, interaction between a TC and upper-tropospheric trough can either trigger or suppress TC intensification (DeMaria et al., 1993; Chen et al. 2015; Fischer et al. 2017), which is known as the “bad trough?good trough” issue (Hanley et al., 2001). Despite the complex relationship between environmental conditions and RI occurrence, previous studies (e.g., Kaplan et al., 2010, 2015; Rozoff and Kossin, 2011) have shown that probabilistic models employing large-scale predictors from the Statistical Hurricane Intensity Prediction Scheme (DeMaria et al., 2005) dataset can provide skillful forecasts for RI events and aid the intensity guidance provided by deterministic models.
In addition to environmental factors, recent studies have incorporated predictors related to TC inner-core characteristics into probabilistic models and found improvements in the forecast skill of RI (Kaplan et al., 2015; Rozoff et al., 2015). Appropriate representation of the inner-core structure is also important in numerical models. A critical issue of TC forecasts with numerical models is providing the model a set of accurate initial conditions, in which the vortex structure needs to be as close to the actual TC as possible (Kurihara et al., 1993; Emanuel and Zhang, 2016). However, the initial TC vortices obtained from global analysis or the output of global models usually yield weaker intensity and unrealistic inner-core structure. This problem has been alleviated in recent years owing to improvements in observation and assimilation systems. For example, Honda et al. (2018) showed that the assimilation of high-resolution new-generation satellite data improves the analyzed TC structure and TC intensity forecasts appreciably.
Other than data assimilation, many initialization methods not relying on observations have been proposed for TC forecasts, which is the focus of this study. Some initialization methods have been employed in the operational forecast models of different agencies (Cha and Wang, 2013; Tallapragada et al., 2015; Heming, 2016). Recent studies have shown evidence that a suitable vortex initialization can be complementary to the assimilation of real data to benefit TC intensity forecasts (Zou et al., 2015; Chang et al., 2020).
One commonly used initialization method is the bogussing scheme, in which an empirically constructed vortex is inserted into the model analyses after removal of the existing inaccurate vortex (Holland, 1980; Leslie and Holland, 1995; Kwon and Cheong, 2010). The inserted vortex is designed to match the intensity and location estimated by the warning centers. A main limitation of this initialization is that physical and dynamical inconsistencies generally exist between the initial conditions and the numerical model. Nonetheless, previous studies have shown that this method can effectively improve TC track and intensity forecasts (Leslie and Holland, 1995; Kwon and Cheong, 2010).
Another method is referred to as dynamical initialization (DI), in which the TC vortex is initialized through model integration (Bender et al., 1993; Kurihara et al., 1993; Peng et al., 1993; Hendricks et al., 2011; van Nguyen and Chen, 2011). The primary advantage of this approach is that the imbalance of the initial TC vortex can be eliminated through model integration. In an early version of a DI scheme developed by Kurihara et al. (1993), the existing TC vortex was separated from the global analysis and then spun up using an axisymmetric version of the forecast model. van Nguyen and Chen (2011) developed a DI scheme that spins up the TC vortex through 1-h cycle runs from the initial model time using the same model as in subsequent simulation. This scheme has a main advantage, compared to that in Kurihara et al. (1993), in that the TC vortex is better adapted to the large-scale environment in which it is embedded. Subsequently, several other DI methods were proposed based on the framework of the DI scheme in van Nguyen and Chen (2011), with different time windows for the cycle runs [e.g., a 6-h window in Cha and Wang (2013); a 3-h window in Wang et al. (2013)] or extra modification to the thermodynamic fields during the cycle runs (van Nguyen and Chen, 2014). Numerous studies (Wang and Wang, 2014; Lee and Wu, 2018; Qin and Zhang, 2018) show that these DI methods can reasonably reproduce TC features and improve the prediction of RI if realistic large-scale conditions and appropriate model physics schemes are incorporated.
Although both the bogussing and DI methods are widely used and have proven effective in improving TC intensity forecasts, it is unclear how these two approaches take effect to benefit the prediction of TC RI and which one is better. As noted by Smith and Montgomery (2015), understanding the dominant dynamical and thermodynamical mechanisms for TC intensification is crucial for future advances in TC intensity forecasts. Therefore, the aim of this study is to evaluate these two initialization methods in predicting TC RI and identify the key factors that impact the accuracy of RI prediction. Two representative DI and bogussing schemes are chosen for comparison; namely, the DI scheme developed by Cha and Wang (2013) and the bogussing scheme inherent in the Weather Research and Forecasting (WRF) model. Our investigation focuses on Typhoon Lekima (2019), the strongest typhoon in the western North Pacific basin during the summer of 2019, which experienced a severe and long-lasting RI process during its lifespan. To substantiate the effects of the two different schemes in RI prediction, the model is simply initialized using the global analysis without assimilating any extra data.
The rest of this paper is organized as follows. Section 2 presents a detailed description of the two initialization schemes. An overview of Typhoon Lekima is presented in section 3, together with a description of the model and experimental design. The simulated TC features and the associated physical mechanisms are given in sections 4 and 5, respectively. The sensitivity of the simulation results to the prescribed tangential wind profile is examined in section 6. A summary is given in section 7.
2.1. TC DI scheme
The DI scheme developed by Cha and Wang (2013) has been implemented into the real-time TC forecasting system of the International Pacific Research Center since 2011. The core of this scheme is the 6-h cycle runs integrated from 6 h before the initial forecast time (t0?6 h) to the initial forecast time (t0) that spins up the axisymmetric component of the TC vortex. During the cycle runs, the spectral nudging method (von Storch et al., 2000; Cha et al., 2011) is applied to the wind field to reduce error in large-scale circulation. The cycle run is repeated until the intensity of the model TC vortex is comparable to the observed and then the model output of the last cycle run is used for the initial condition of the subsequent simulation. Therefore, this DI scheme allows the warm startup of model physics, which is a key difference from the DI schemes in other studies (e.g., Bender et al., 1993; Peng et al., 1993; van Nguyen and Chen, 2011; Wang et al., 2013). Another important advantage of the current DI scheme is that the initial condition generated by this scheme is dynamically and physically consistent with the WRF model, since both the cycle runs and the subsequent simulation are conducted using the WRF model.The first procedure of the DI scheme is separation of a TC vortex from the total field of the global analysis using the vortex-separation algorithm developed by Kurihara et al. (1993) and later modified by van Nguyen and Chen (2011). This algorithm is based on the assumption that any variables associated with a TC can be decomposed into the vortex component FV and the background environmental component FE:
To separate FV from the total field F, a spatial filtering method (van Nguyen and Chen, 2011) is first utilized to extract the disturbance component with a wavelength smaller than 900 km. Then, a cylindrical filter is employed to isolate the TC vortex component from the disturbance field. Detailed descriptions and formulae of the two filtering methods can be found in van Nguyen and Chen (2011) and Cha and Wang (2013). After separation of the TC vortex, we can obtain the axisymmetric and asymmetric components of the TC vortex by simply calculating the azimuthal mean and azimuthal anomaly of the TC-related variables. Before the first cycle run, the axisymmetric TC component is relocated to the observed TC center while the asymmetric TC component remains unchanged.
After each cycle run, the axisymmetric TC vortex at the end of the 6-h integration (t0) is extracted from the model output fields using the same vortex-separation algorithm and is used as the initial axisymmetric TC vortex for the next cycle run. However, the environmental component and the asymmetric TC component are reinitialized as those from the global analysis at t0?6 h in each cycle run. Namely, the DI scheme only spins up the axisymmetric TC component. To smoothly merge the axisymmetric TC component from the cycle run to the rest of the field at t0?6 h, a new axisymmetric TC vortex is constructed by merging the axisymmetric TC vortices at t0?6 and t0 h:
In Eq. (2), ω is a weighting function given as:
where r denotes the radius from the TC center and R is the radius of the TC domain used for separation and merging of the TC component. Note, according to Kurihara et al. (1993), R is defined as the radius where the 850-hPa azimuthal mean tangential wind Vt850 satisfies the following criteria: (1) Vt850 < 6 m s?1 and

We can see from Eq. (3) that the newly constructed axisymmetric TC vortex is identical to that generated from the cycle run within the inner region (r ≤ R/2), while the weight of the TC vortex at t0?6 h increases gradually to 1 from R/2 to R. After the above vortex-construction procedure, the new axisymmetric TC vortex is relocated to the observed TC center at t0?6 as a new initial condition for a new cycle run. The DI procedure is ended once the difference between the simulated 10-m maximum wind speed at t0 and that from the observation is less than 2 m s?1. Then, the model simulation can formally commence at t0 using the restart file from the WRF cycle run; that is, a warm startup of model physics.
2
2.2. Bogussing scheme in the WRF model
The current bogussing scheme in the WRF model was originally developed by the National Center for Atmospheric Research (NCAR) and Air Force Weather Agency (Low-Nam and Davis, 2001) for bogussing TCs into the nonhydrostatic version of MM5 (the Fifth-generation Pennsylvania State University?NCAR Mesoscale Model). This scheme includes two main procedures: the first is removal of the inaccurate vortex from the analysis field and the second introducing a new vortex into the modified analysis field. The first procedure is accomplished by removing the TC-related wind, temperature, geopotential height, and sea level pressure anomalies within a 300-km radius from the TC center in the analysis data (Low-Nam and Davis, 2001). In this study, the algorithm of Kurihara et al. (1993) is still used to remove the axisymmetric TC vortex before inserting the bogus vortex, because we expect the possibility that the environmental field will be identical to that in the DI simulation at t0, such that any discrepancies between the simulated outputs can be attributed to the difference in TC vortices generated by the two initialization schemes.The inserted vortex wind profile is given by a simple Rankine vortex:
where F(r) is the tangential wind at radius r; vm is the maximum tangential wind; rm is the radius of maximum wind (RMW); α is a coefficient controlling the wind profile outside the RMW; and A(z) is the vertical weight function, which is specified to be 1 from the surface to 850 hPa, 0.95 from 850?700 hPa, 0.90 from 700?500 hPa, 0.7 from 500?300 hPa, 0.6 from 300?200 hPa, and 0.1 from 200?100 hPa. After specifying the wind profile, the mass field of the bogus vortex is obtained by solving the nonlinear balance equation for the given tangential wind field. Note that there are four input parameters required for running the bogussing scheme; that is, the longitude and latitude of the reported TC center, the estimated maximum wind, and the RMW. The setup will be discussed in detail in the next section.
3.1. Overview of Typhoon Lekima
Figure 1 shows the track and the evolution of TC intensity in terms of the minimum sea level pressure (MSLP) and the maximum 10-m wind speed (VMAX) of Lekima from 4?11 August 2019. The TC data are from the International Best Track Archive for Climate Stewardship (IBTrACS) dataset, version 4. Lekima was first identified as a tropical depression to the east of the Philippines at 0000 UTC 4 August and upgraded to tropical storm strength at 1800 UTC 4 August (Figs. 1a and b). After a short quiescent period from 1800 UTC 4 to 1200 UTC 5 August, Lekima began to intensify. The storm first developed slowly for 30 h and then experienced RI during 1800 UTC 6 to 0600 UTC 8 August, with VMAX increasing by 68 kt and MSLP deepening by 64 hPa. During the RI period, Lekima moved northwestward and gained sufficient energy supply from the warm seawater (SST > 30°C). Meanwhile, the 300?850-hPa environmental VWS decreased sharply from 8 to 4 m s?1 (Fig. 1c), indicating a favorable large-scale dynamical condition for TC intensification. Note that the 300?850-hPa VWS is calculated using the area-averaged azimuthal mean wind components between 300- and 800-km radii from the TC center, following Chen et al. (2017). The SST and wind fields are from NOAA’s Optimal Interpolation SST (OISST; Reynolds et al., 2007) and NCEP’s Global Forecast System Final Analysis (GFS-FNL) dataset, respectively. The mean intensification rate during the RI of Lekima is 45.3 kt d?1, which is about 1.5 times the RI criterion (30 kt d?1) given by Kaplan and DeMaria (2003).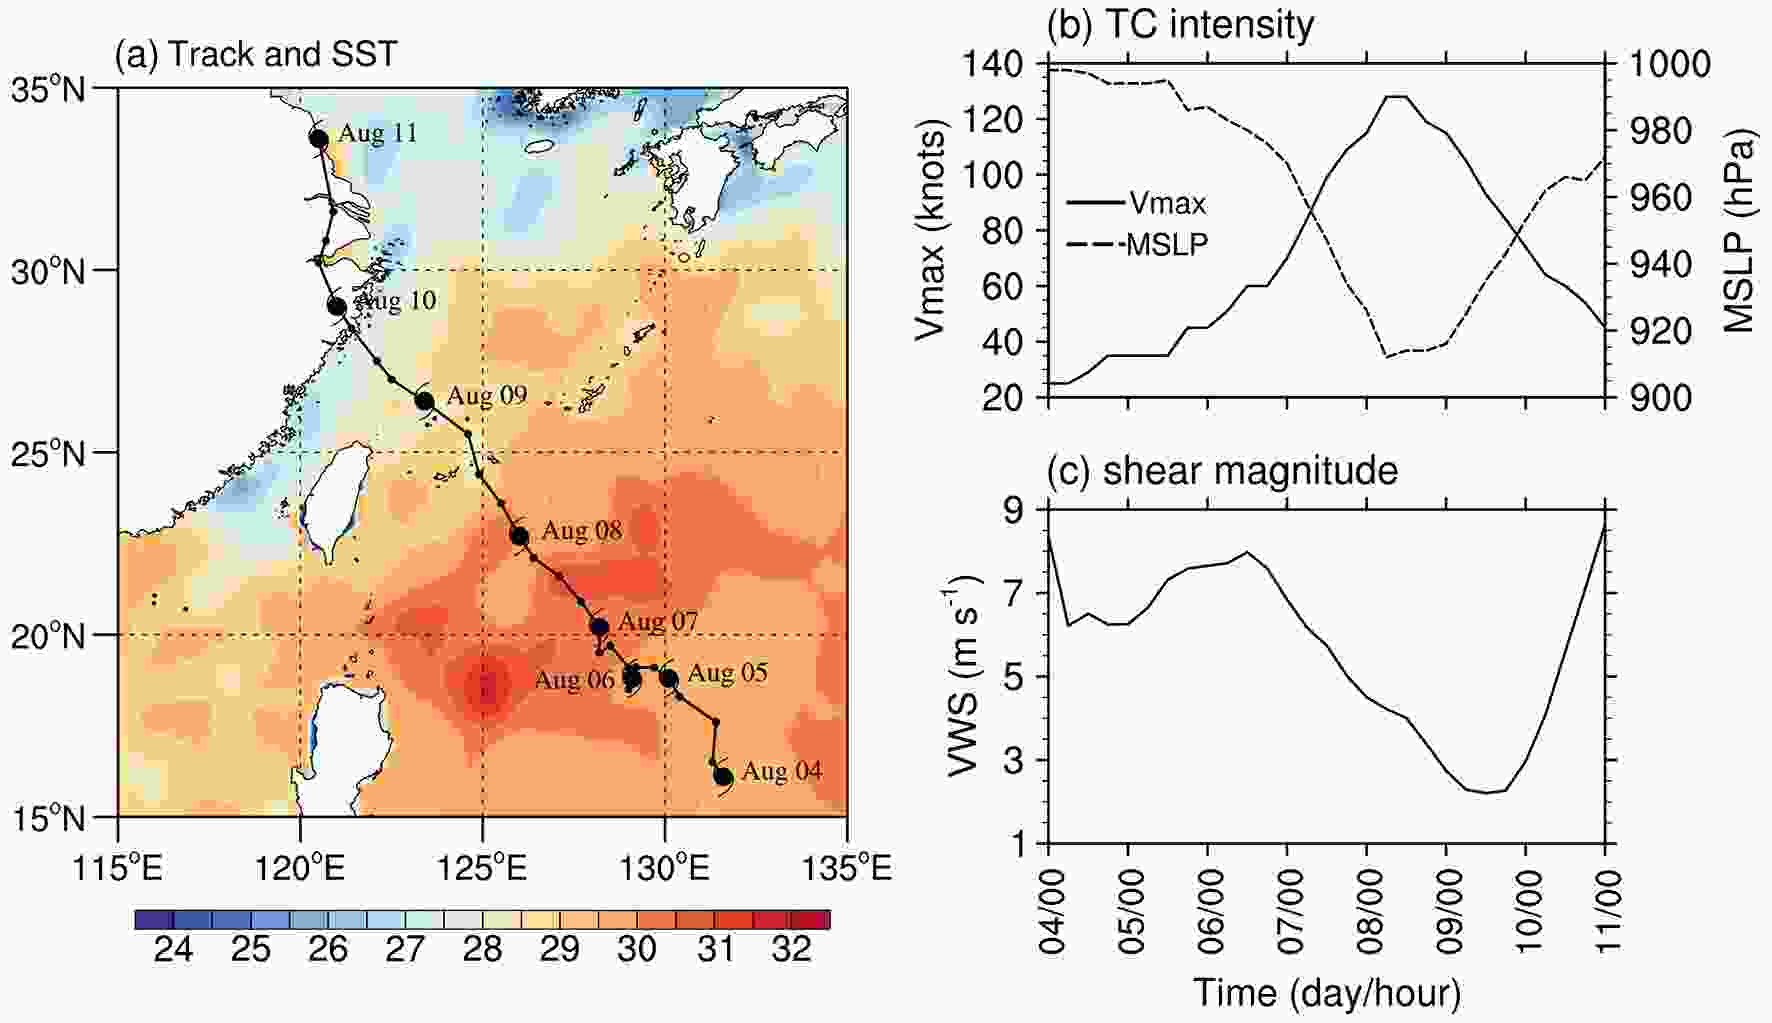 Figure1. (a) SST averaged from 7?8 August 2019 (shading, °C) and the six-hourly TC track from 0000 UTC 4 to 0000 UTC 11 August. The black hurricane symbol denotes 0000 UTC on each day. (b) Time series of maximum 10-m wind speed (m s?1) and minimum SLP (hPa). (c) Time series of the magnitude (m s?1) of the 300?850-hPa environmental VWS.
After RI, Lekima continued to move northwestward and weakened gradually as it passed over the cooler seawater (Fig. 1a) and was impacted by the dry air intrusion from the continent (not shown). At around 1800 UTC 9 August, Lekima made landfall in Wenzhou, Zhejiang Province, China, with a VMAX of 84 kt. Although the intensity decreased considerably just prior to landfall, the severe RI of Lekima made it the strongest landfalling typhoon in 2019.
2
3.2. Model settings
The Advanced Research version of the WRF model (ARW-WRF), version 3.6.1 (Skamarock et al., 2008), is used in this study for the simulation of Typhoon Lekima. The model domain is two-way interactive and quadruply nested, with horizontal resolutions of 27, 9, 3 and 1 km and dimensions of 241 × 241, 241 × 241, 241 × 241 and 421 × 421, respectively (Fig. 2a). The vortex-following method is applied to the three inner domains, while the outermost domain is fixed. There are 55 vertical levels in the terrain-following sigma coordinate, with the model top at 30 hPa. The initial and lateral boundary conditions are interpolated from GFS-FNL, with a horizontal resolution of 1.0° × 1.0° at 6-h intervals. The model is integrated for three days, with the three outer meshes activated at 1200 UTC 6 August and the innermost mesh activated 12 h later (i.e., 0000 UTC 7 August). The OISST data, with a horizontal resolution of 0.25° × 0.25°, are used as the lower boundary condition and updated daily during the simulation.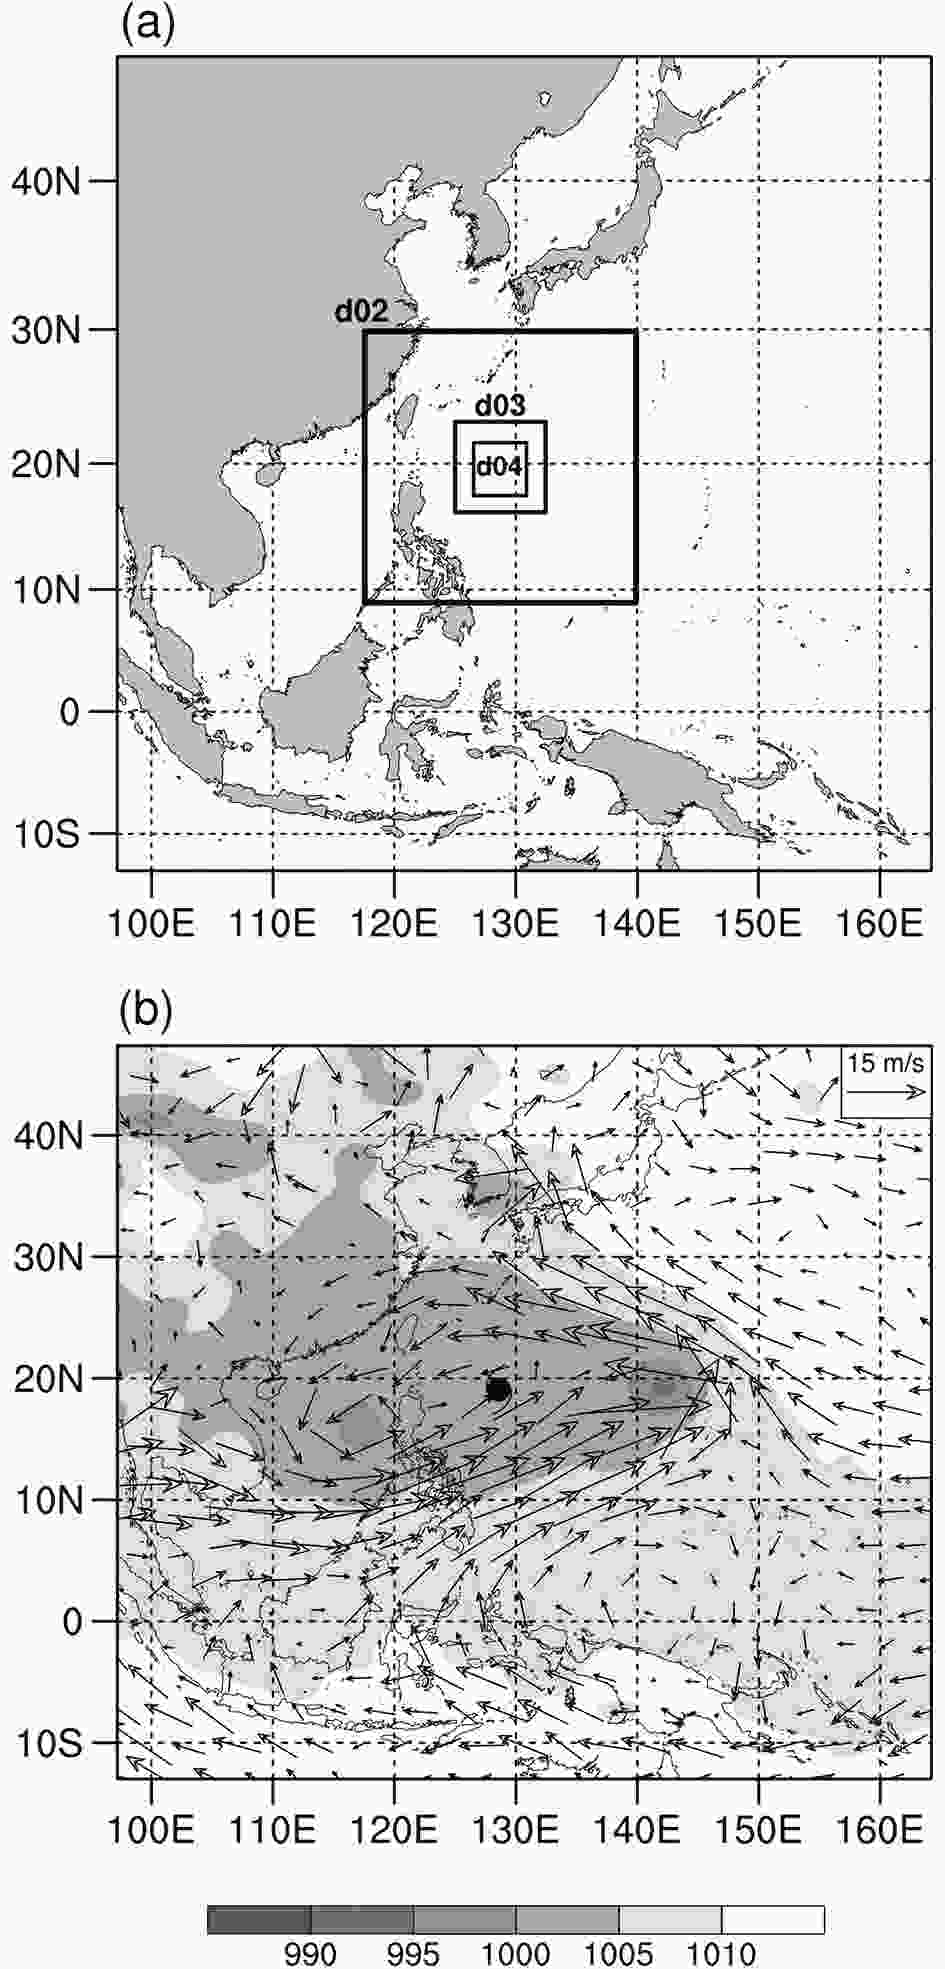 Figure2. (a) Quadruply nested domain settings used for the simulation of Typhoon Lekima (2019). (b) Sea level pressure (shading, hPa) and 850-hPa wind vectors at 1200 UTC 6 August after removing the axisymmetric TC vortex. The hurricane symbol denotes the center of Lekima.
The following physics parameterizations are used in this study: the new Thompson et al. (2008) cloud microphysics scheme; the YSU (Yonsei University) boundary layer scheme (Hong et al., 2004); the Kain?Fritsch cumulus parameterization scheme (Kain and Fritsch, 1993; for the outermost domain only); the RRTM (Rapid Radiative Transfer Model) longwave radiation scheme (Mlawer et al., 1997), and the Dudhia shortwave radiation scheme (Dudhia, 1989).
2
3.3. Experimental design
Three experiments are designed to compare the performances of the two initialization schemes in the simulation of Lekima’s RI. In the control run (CTL), no initialization scheme is used, such that the initial TC vortex is identical to that in GFS-FNL. Two sensitivity runs using the DI scheme and the bogussing scheme are termed as DIS and BOG, respectively. In the DIS experiment, the 6-h cycle run initialized at 0600 UTC 6 August is performed to spin up the axisymmetric component of the incipient TC vortex. After two cycle runs, the simulated TC reaches an intensity comparable to that observed in the IBTrACS dataset (29.1 m s?1 versus 30.8 m s?1). Then, the model is integrated for three days with a warm startup. In contrast, in the BOG experiment, the axisymmetric component of the TC vortex in GFS-FNL is replaced by a bogus vortex constructed by the WRF bogussing scheme. As a reference, the background 850-hPa wind and sea level pressure fields, after removing the axisymmetric TC components, are given in Fig. 2b. The bogus vortex has a maximum surface wind of 30.8 m s?1, which is identical to the observed intensity. Since the TC intensification rate may be impacted by the tangential wind profile (Rogers et al., 2013; Xu and Wang, 2015, 2018), the tangential wind profiles of the initial vortices in DIS and BOG need to be adjusted to similar structures for a fair comparison between the two initialization schemes. To this end, the RMW and parameter α of the Rankine vortex are set to be 140 km and ?0.95, respectively, which yields the tangential wind structure closest to that in DIS. Note that this setup mainly considers the lower-tropospheric wind profile, so there are still differences in the wind structure at other levels between DI and BOG that may affect the subsequent TC intensification. In all three simulations, the large-scale spectral nudging technique is applied to the wind field in the outermost domain throughout the integration to reduce the bias in the large-scale environmental flow.The radius?height cross sections of the azimuthal-mean tangential and radial wind are shown in Fig. 3 to further illustrate the structural discrepancies of the initial TC vortices in the three simulations. A strengthening in the low-level tangential wind is seen in DIS compared to that in CTL (Figs. 3a and b), with the maximum wind speed increasing from 24 to 27 m s?1. However, the RMW of the TC vortex shows no contraction after two cycle runs, which is somewhat different from the results in Wang et al. (2013) in which the RMW of Typhoon Megi (2010) contracts significantly during the DI cycle runs. The nearly unchanged RMW may be attributable to the asymmetries induced by the relatively strong environmental VWS during the cycle run period, as displayed in section 5. In addition, the initial TC vortex in DIS also has stronger low-level boundary-layer inflow and upper-level outflow than that in CTL (Figs. 3d and e), indicating a more well-organized secondary circulation.
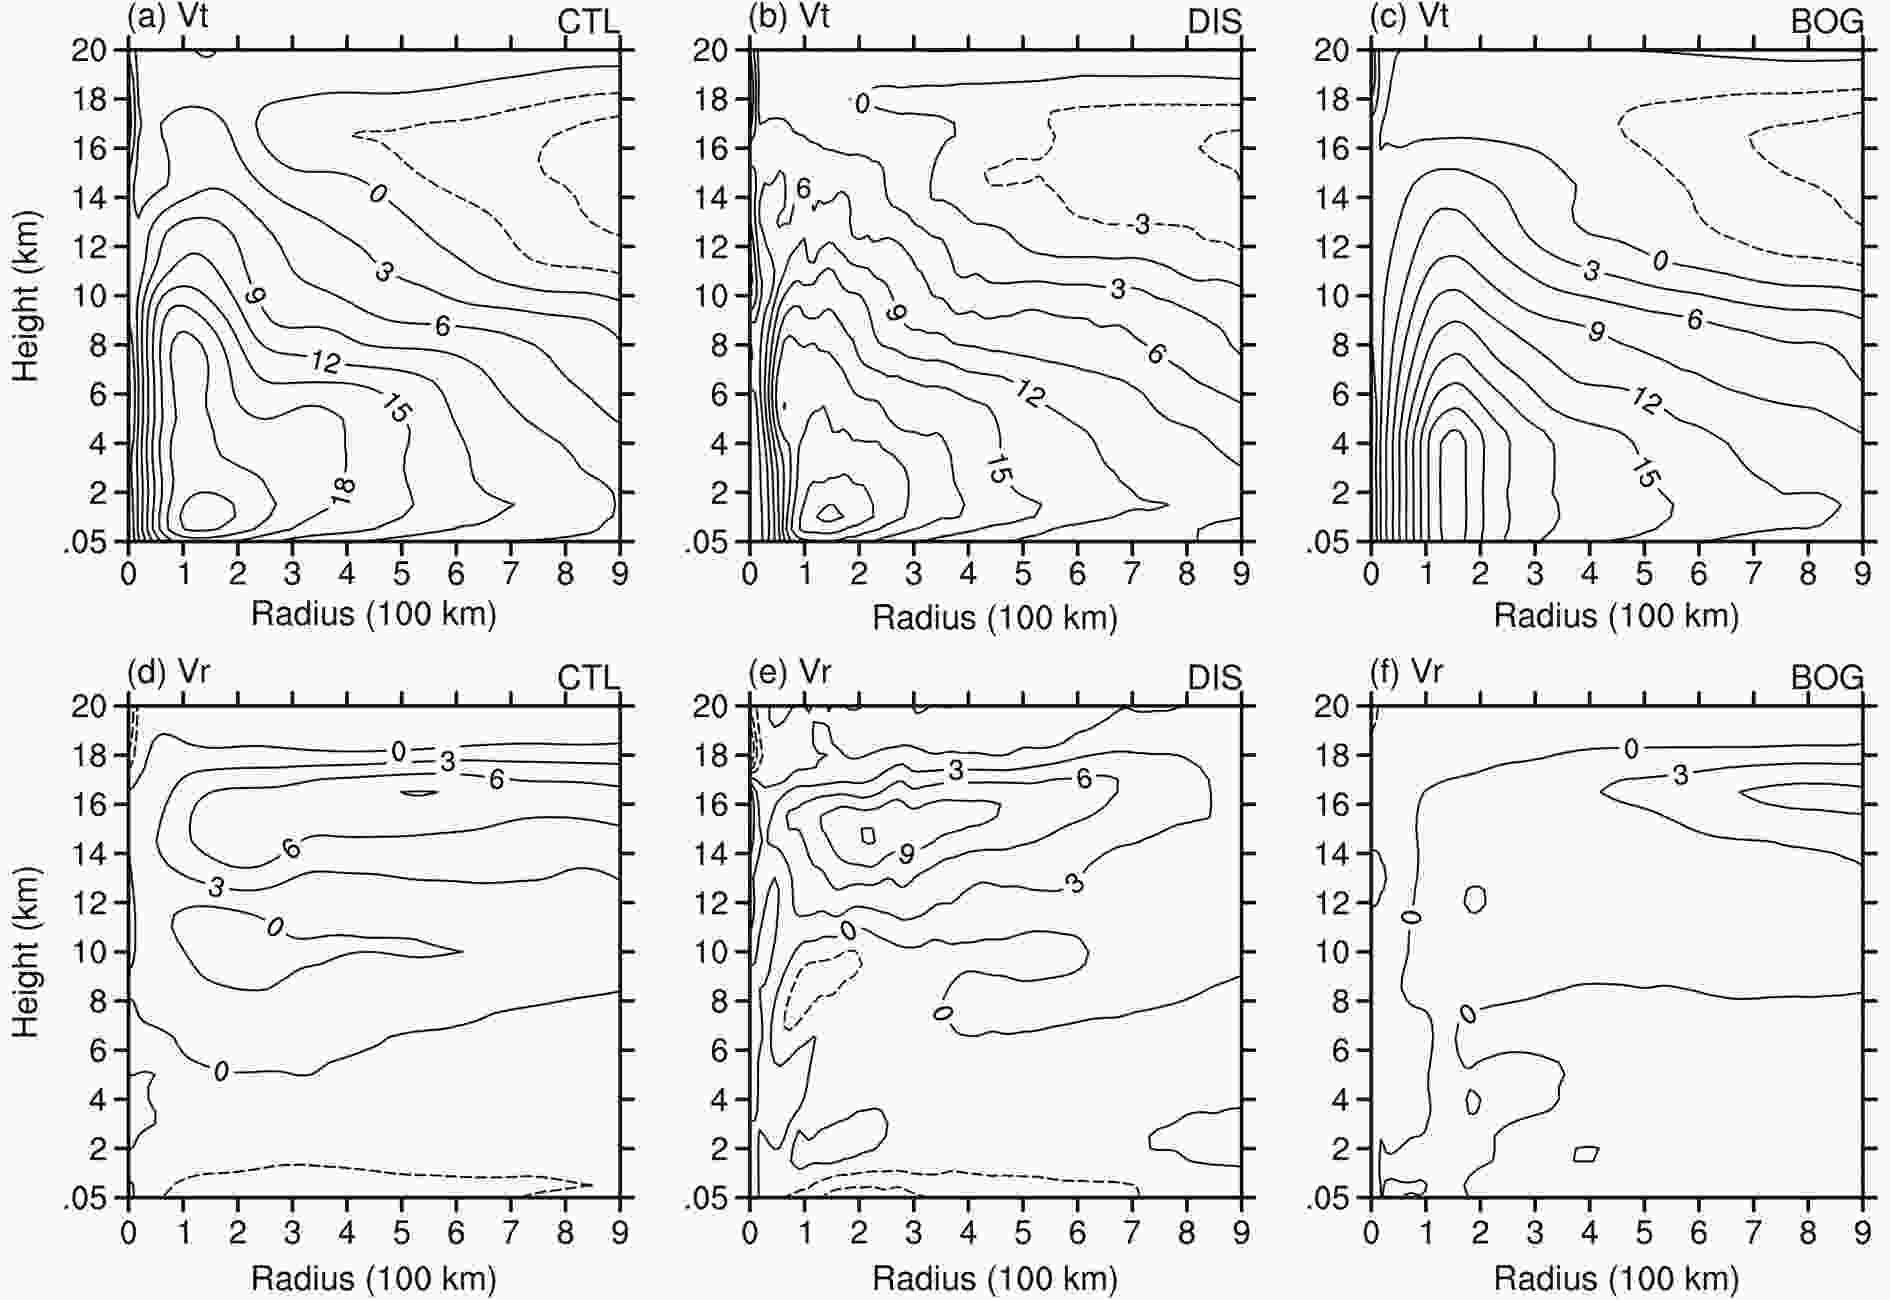 Figure3. Radius?height cross sections of the azimuthal mean (a?c) tangential wind (m s?1) and (d?f) radial wind (m s?1) at 1200 UTC 6 August for (a, d) CTL, (b, e) DIS and (c, f) BOG.
The bogus vortex shows a distinct structure from the initial vortex in CTL and DIS (Figs. 3c and f). Specifically, the maximum tangential wind extends from the surface to a height of 4 km rather than at the top of the boundary layer as in CTL and DIS. Moreover, the initial vortex in BOG has significantly weaker boundary-layer inflow and upper-level outflow than those in CTL and DIS, since the bogussing scheme of the WRF model does not construct a secondary circulation for the bogus vortex accurately.
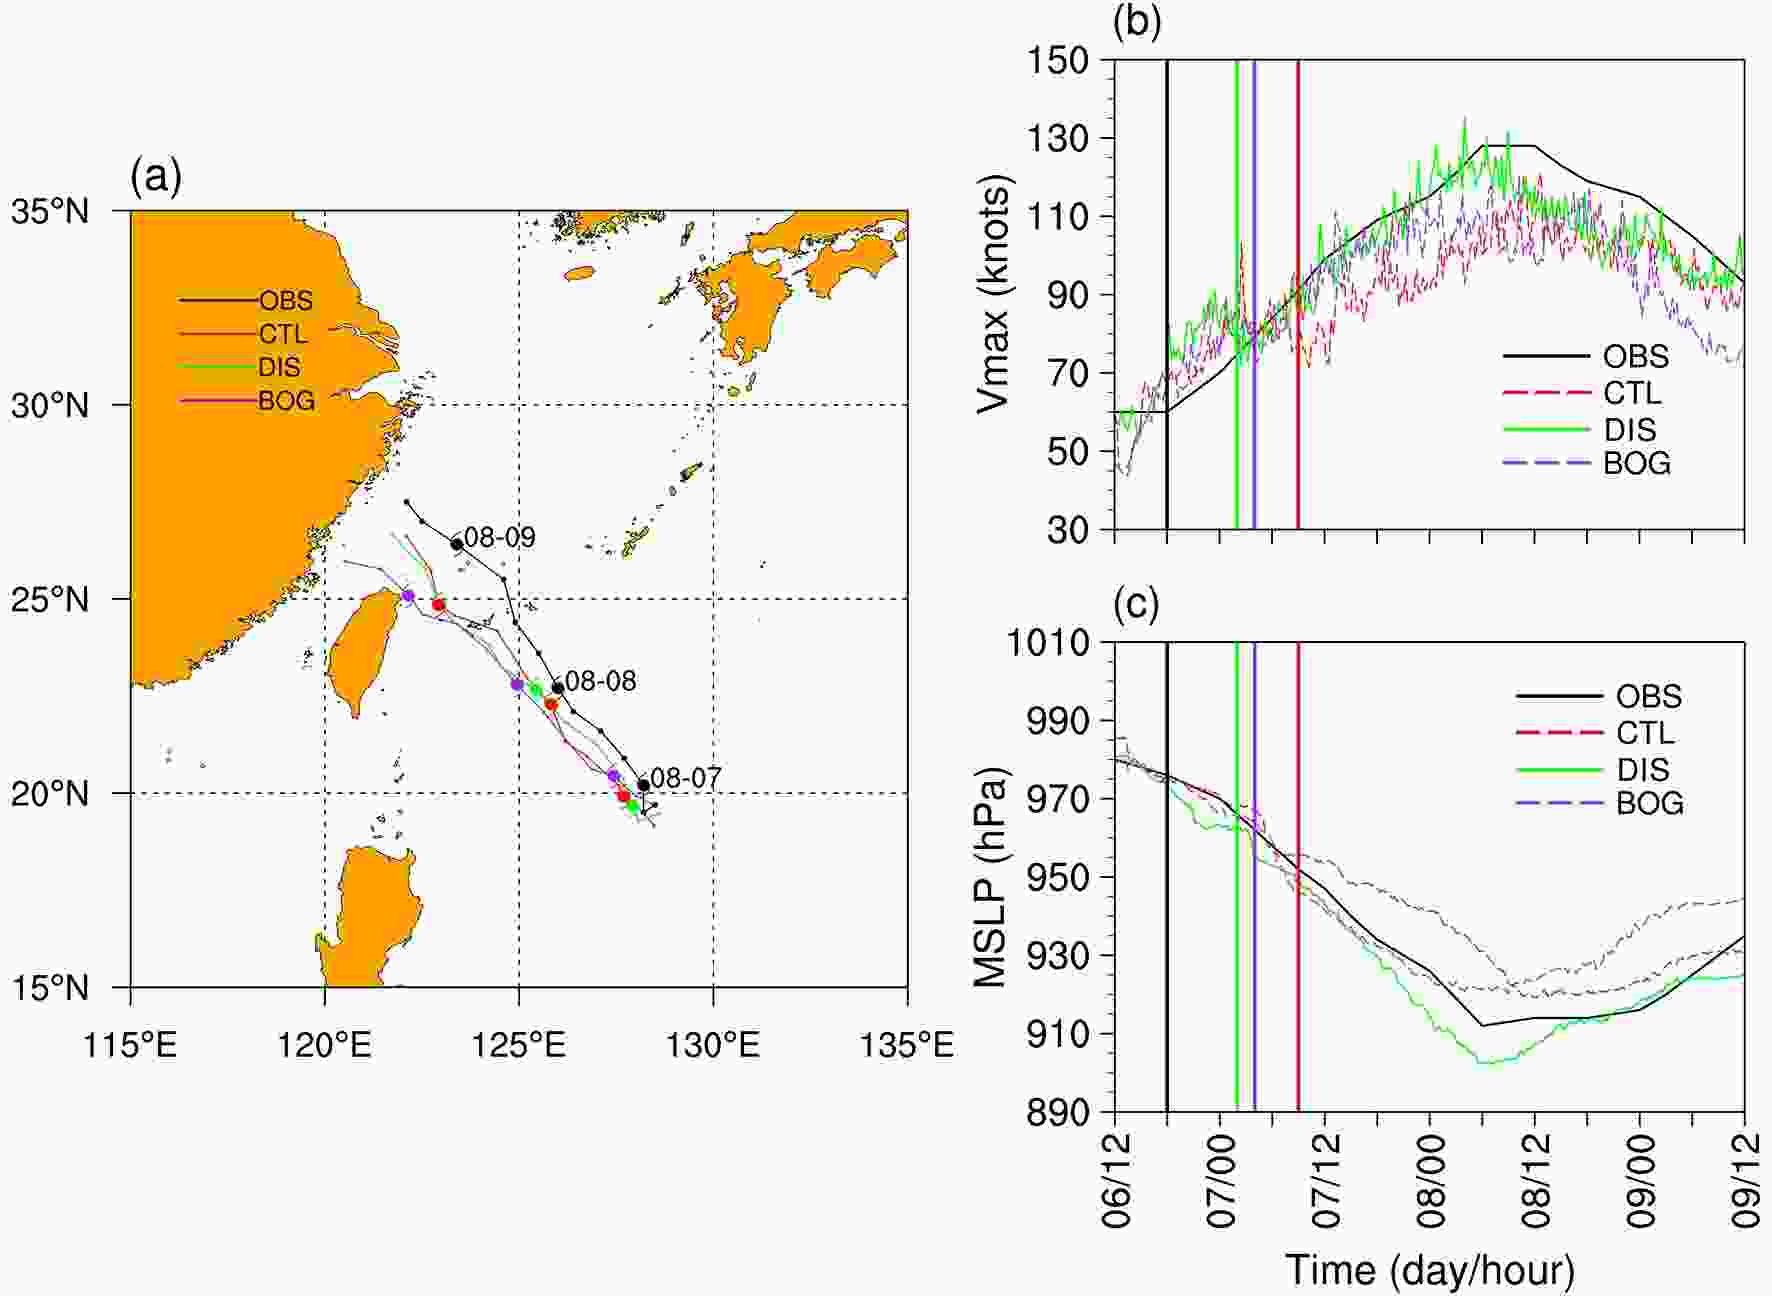 Figure4. Verification of simulated (a) six-hourly TC track, (b) maximum 10-m wind speed (m s?1) and (c) minimum SLP (hPa) against the observed data from IBTrACS. The hurricane symbol denotes 0000 UTC on each day. The black, red, green and purple thick lines in (b, c) denote the RI onset timings of the observed data and simulated results from CTL, DIS and BOG, respectively.
The evolutions of TC intensity are quite different among the three simulations. It is clear that DIS shows the greatest similarity to the observed intensity change (Figs. 4b and c). Both the RI and the subsequent weakening are well reproduced in DIS. The BOG experiment has smaller errors in the simulated intensity than CTL, but still underestimates the intensification of Lekima compared to DIS. We further compare the RI onset timing among the different simulations, since determining the RI onset is of great importance in TC intensity forecasts (Kaplan et al., 2010; Knaff et al., 2018). Following Rios-Berrios et al. (2018), the RI onset in this study is defined as the time point that satisfies the following two criteria: (1) an increase of at least 30 kt in VMAX in the subsequent 24 h and; and (2) an increase of at least 7.5 kt in VMAX in the first 6 h of the subsequent 24 h. Based on these criteria, the RI onset timings in CTL, DIS and BOG are identified as 0900 UTC 7, 0200 UTC 7 and 0400 UTC 7 August, respectively. Interestingly, all simulated TCs undergo a fast-developing period and a short non-developing/weakening period before the RI onset in terms of VMAX (Fig. 4b). This finding agrees with Tao and Zhang (2019), who showed that TCs in a sheared environment usually experience a temporary weakening before RI onset (see their Fig. 2). However, this temporary weakening is not found in the observed intensity, possibly due to the coarse temporal resolution. Therefore, the observed RI onset is simply defined at 1800 UTC 6 August.
As shown in Fig. 4, the RI onset of the TC in DIS is closest to the observed and is 7 and 2 h earlier than those in CTL and BOG, respectively. This result suggests that the DI scheme can effectively reduce the simulation error for RI onset timing. Table 1 summarizes the observed and simulated TC intensity changes in terms of VMAX and MSLP during the subsequent 24 h following RI onset. The DIS TC shows a VMAX change nearly identical to that observed (45 versus 49 kt) and an MSLP change slightly larger than observed (52 versus 43 hPa). By comparison, both the CTL TC and BOG TC show a significantly slower intensification during the RI period, accounting for approximately 65% and 76% of the observed intensity change, respectively.
| IBTrACS | CTL | DIS | BOG | |
| ΔVMAX (kt) | 49 | 32 | 45 | 37 |
| -ΔMSLP (hPa) | 43 | 33 | 52 | 41 |
Table1. Changes in maximum 10-m wind speed (VMAX) and minimum sea level pressure (MSLP) during the 24-h period following RI onset for the IBTrACS data and three simulations.
To demonstrate the effects of the two different initialization schemes on the simulated TC structures, the model radar reflectivity and the satellite infrared (IR) images are depicted in Fig. 5. At 0000 UTC 7 August, Lekima had already developed an incipient eye with deep convection located preferentially in the south of the eyewall (Fig. 5a). Also, a strong outer rainband extending from the southeast to the southwest of the storm can be clearly seen in the IR image. All three experiments successfully reproduce the highly asymmetric structure of Lekima (Figs. 5b-d). However, only the DIS TC has developed a clear eye?eyewall structure at this time. The TC eyes in CTL and BOG are relatively vague owing to the loosely organized inner-core convection. At 1200 UTC 7 August, as Lekima enters the RI period, the eye?eyewall structure becomes more evident and the inner-core convection is more symmetric around the TC center than 12 h before (Fig. 5e). In addition, the convective rainbands south of the storm center become weaker and separated into several mesovortices. Again, the DIS simulation captures these structural features well (Fig. 5g), while both CTL and BOG simulate an overly large eye and excessively strong outer rainbands (Figs. 5f and h).
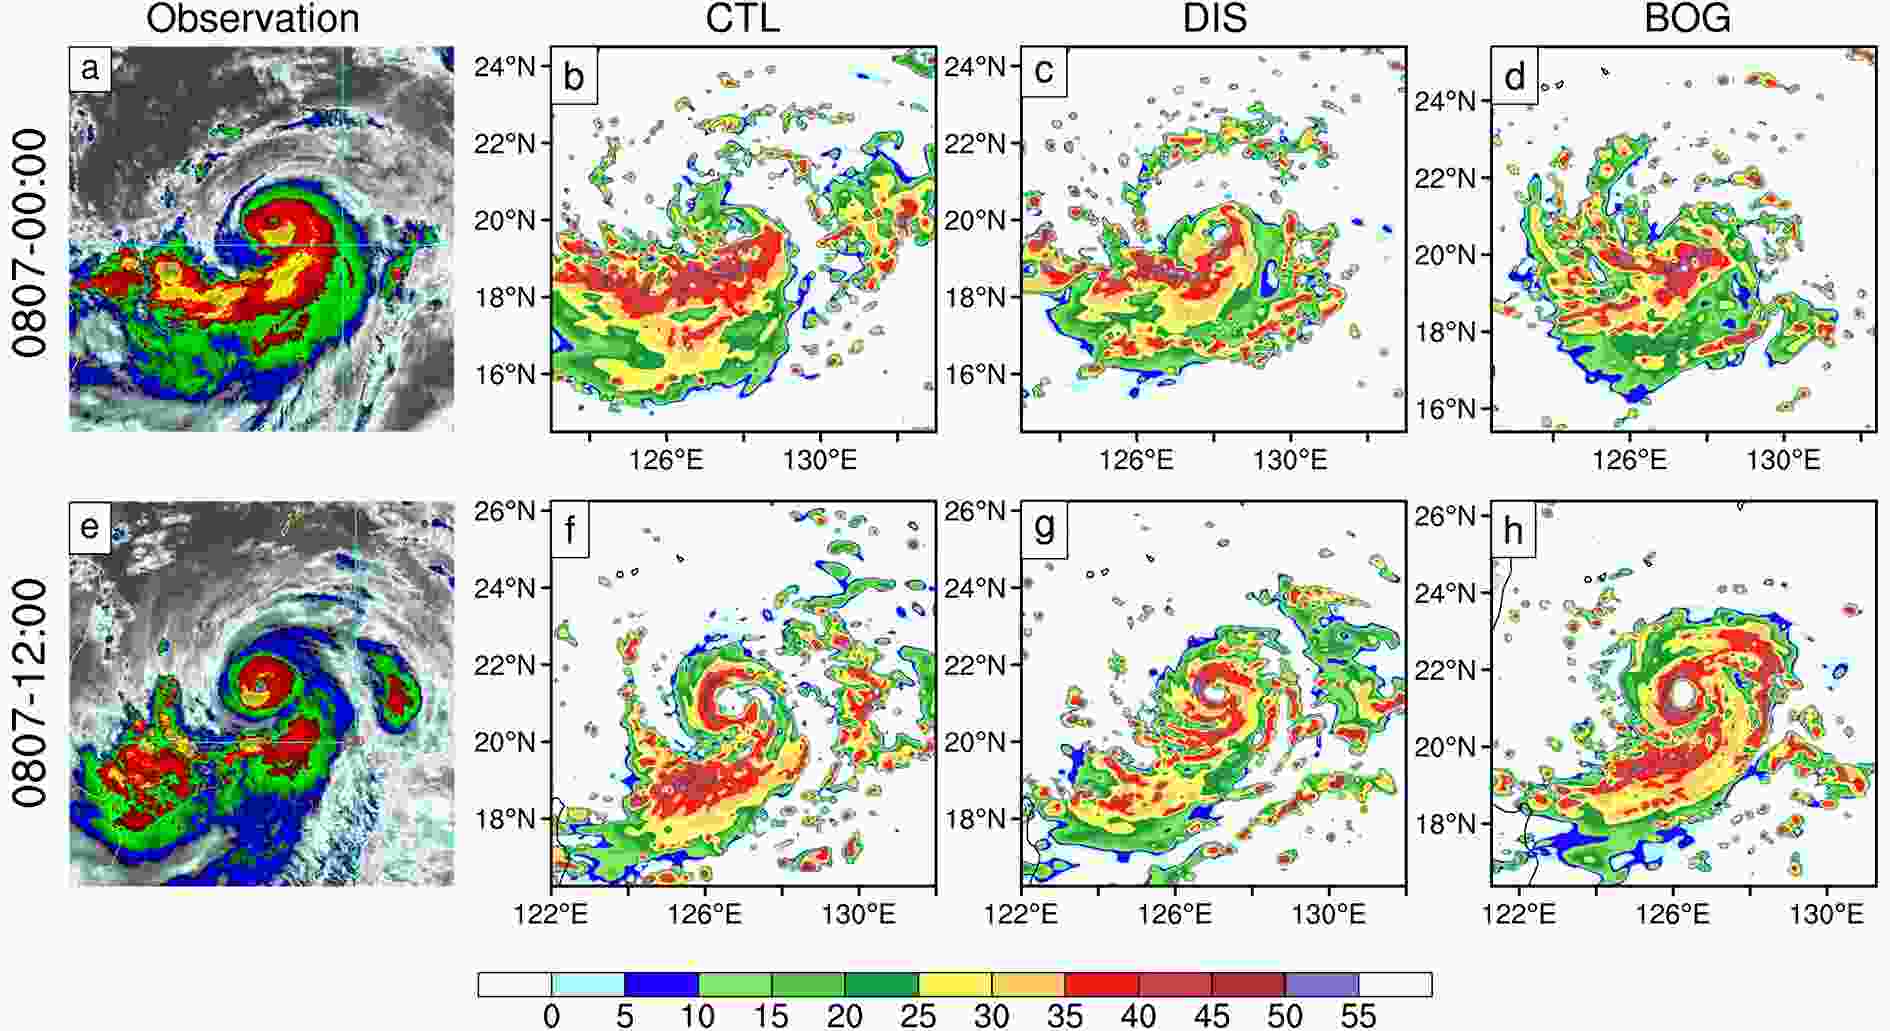 Figure5. (a, e) Enhanced IR images from the Multifunctional Transport Satellite and the simulated radar reflectivity (dBZ) vertically averaged from 0.5?2 km for (b, f) CTL, (c, g) DIS and (d, h) BOG at (a?d) 0000 UTC 7 and (e?h) 1200 UTC 7 August. The satellite IR images are from http://rammb.cira.colostate.edu/products/tc_realtime/.
In short, the DI scheme demonstrates an overall better performance in predicting the RI and the structural evolution of Lekima than the WRF bogussing scheme. Naturally, several questions arise, as follows: (1) What leads to the different RI onset timing in the three experiments? (2) Why does the TC in DIS have a larger intensification rate during the RI period than those in CTL and BOG? (3) What causes the different TC structural features among the three simulations and what is the relationship between these features and RI? These issues are addressed in the next section.
5.1. Storm-scale evolution
To gain more insights into the RI of Lekima, we first examine the evolutions of wind fields and convection from an azimuthal-mean perspective (Fig. 6). Before the RI onset in each simulation, both the primary circulation and the low-level inflow of the TC strengthen gradually with time. With no initialization method applied, the CTL TC shows the weakest inflow in the boundary layer among the three simulations, except for the very early stage of the integration (Fig. 6d). Although the BOG TC has near zero radial wind at the initial moment (Fig. 3f), it develops a strong boundary layer inflow comparable to that in DIS after a quick adjustment of 3 h (Fig. 6f). However, the boundary layer inflow in BOG does not penetrate as deeply into the TC inner-core region as that in DIS, as inferred from the radial location of the ?6 m s?1 isotach. The discrepancy in the radial inflow pattern may further influence the radial distribution of convection. Specifically, the strong boundary-layer inflow in DIS enhances both the mass and moisture convergence in the inner-core region, which causes convection to occur at a smaller radius from the storm center than that in CTL and BOG (Figs. 6d-f). The active convection releases considerable latent heating inside the RMW (Fig. 6b), which in turn enhances the inward transport of moisture and angular momentum from the outside and thus accelerates the tangential wind in the inner-core region (Charney and Eliassen, 1964; Ooyama, 1969). As a result, the RMW of the DIS TC contracts much faster than its counterparts in CTL and BOG. At 0000 UTC 7 August, the RMW in DIS has contracted to 60 km, while lying at 114 and 93 km in CTL and BOG, respectively.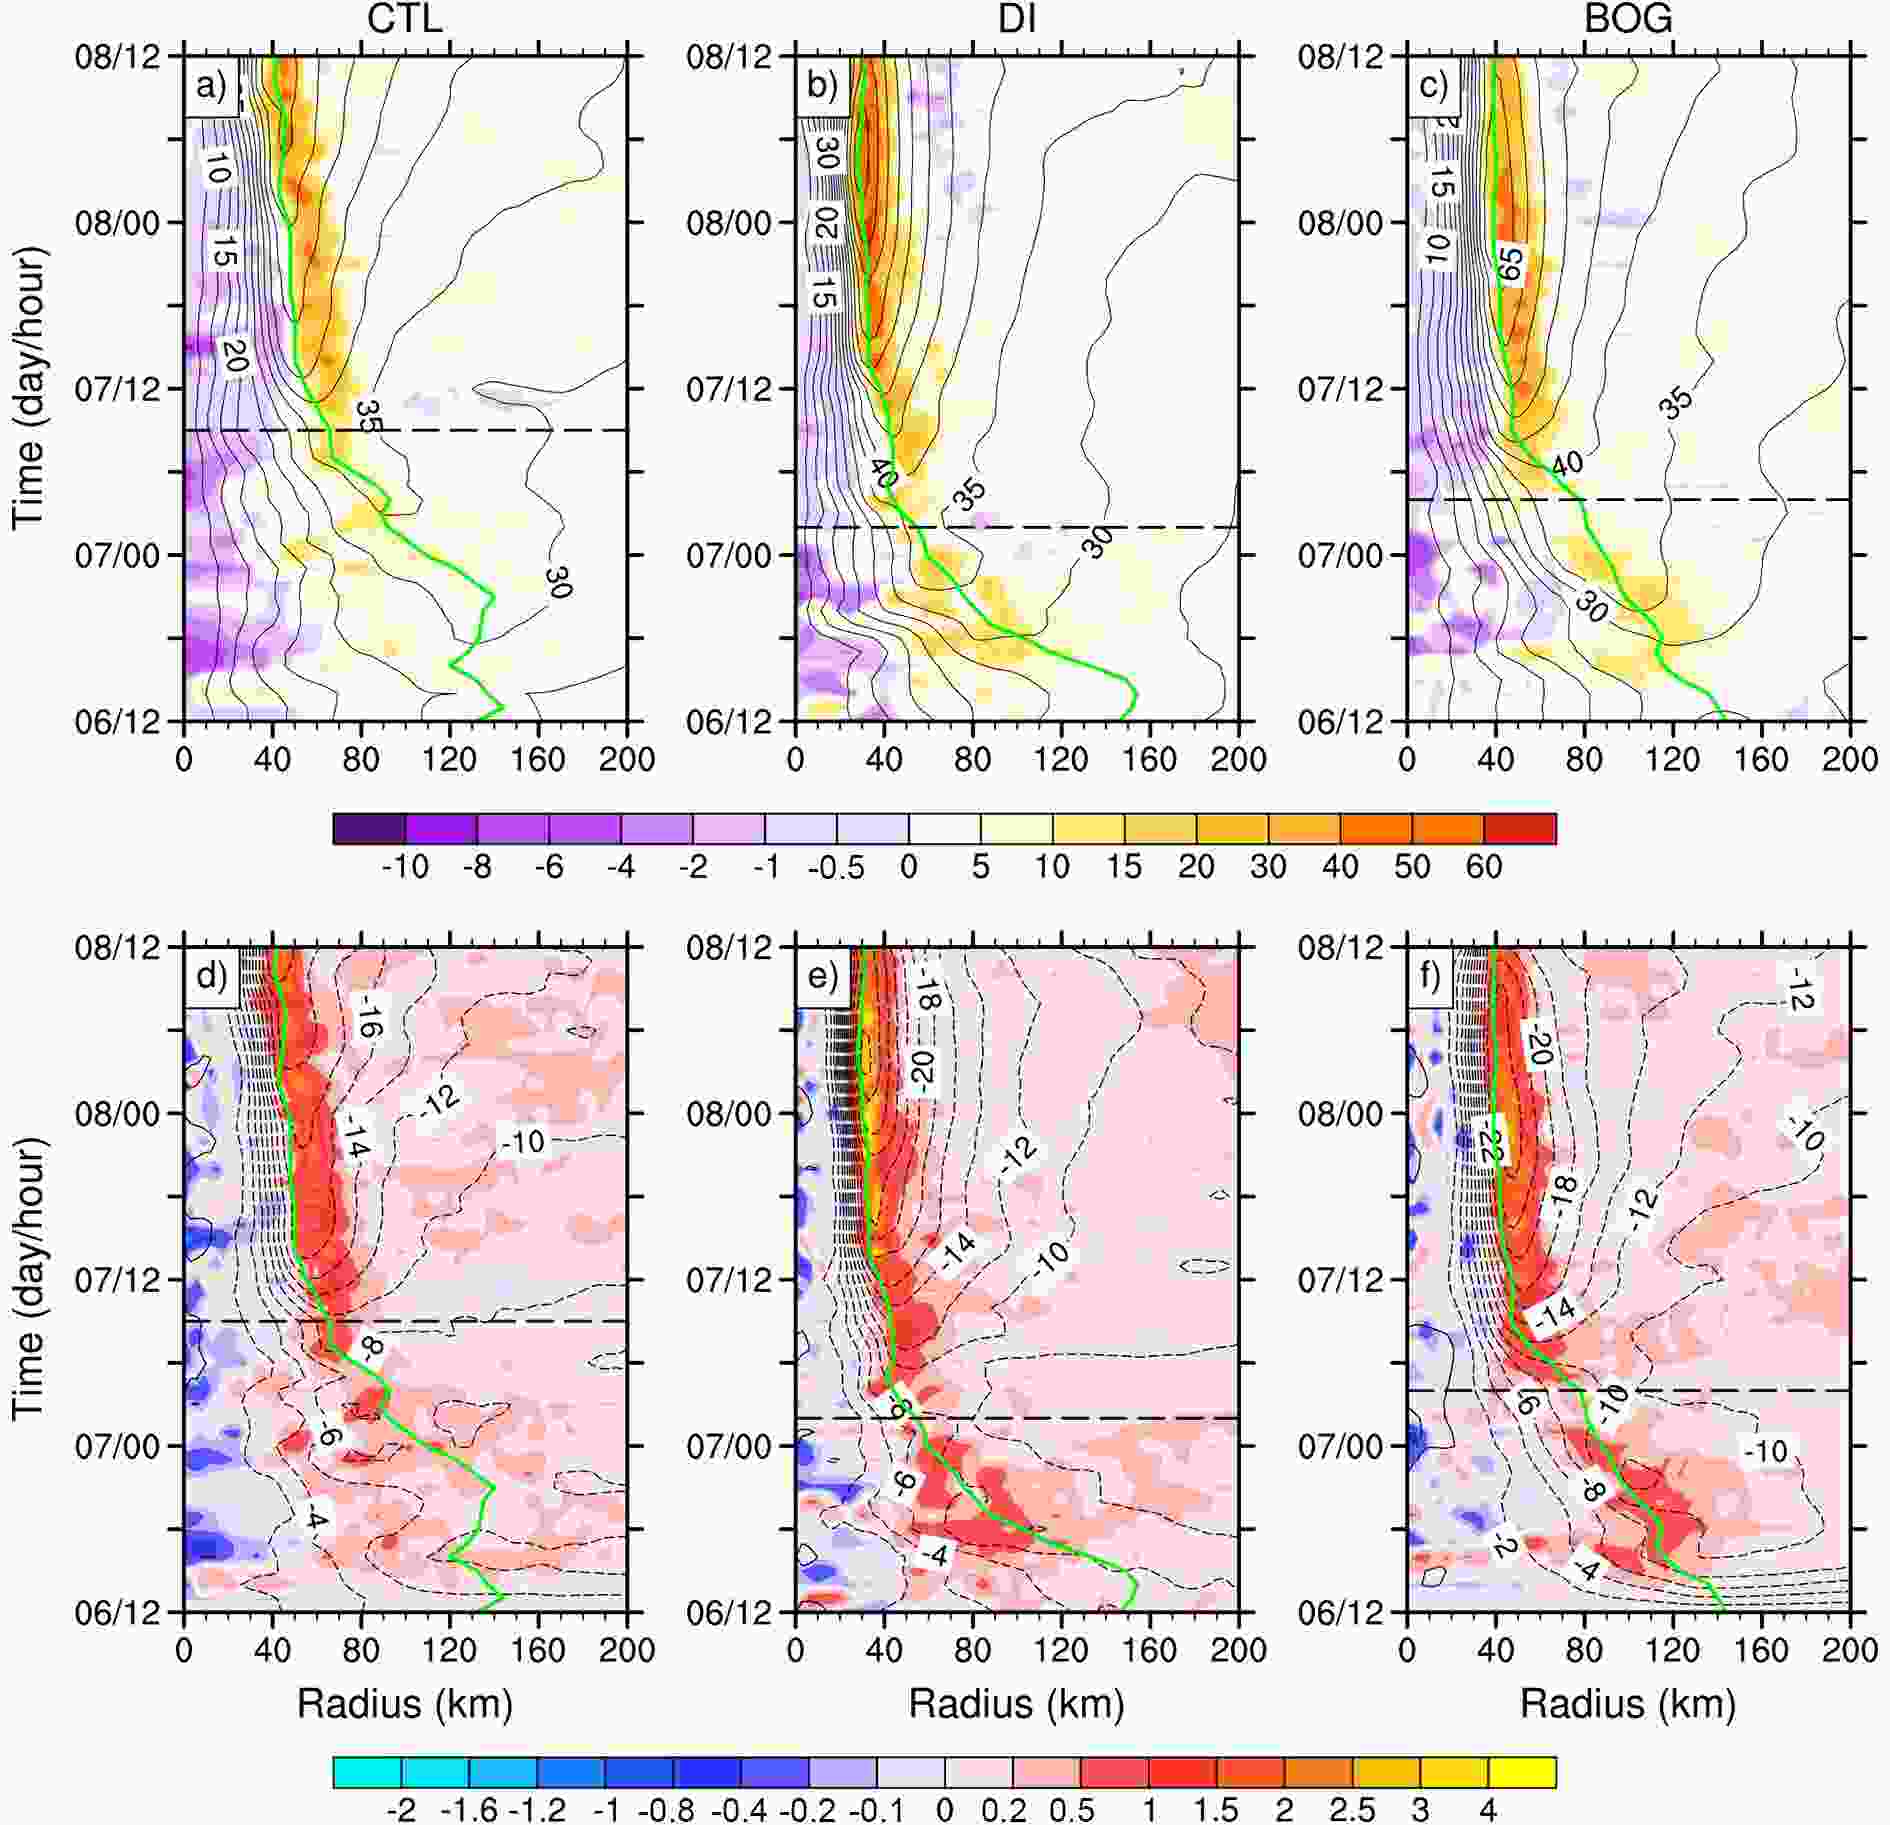 Figure6. (a?c) Time?radius cross sections of the azimuthal mean tangential wind (contours, m s?1) at the height of 1 km and diabatic heating rate (shading, K h?1) vertically averaged from 5?10 km for (a) CTL, (b) DIS and (c) BOG. (d?f) As in (a?c) but for the azimuthal mean radial wind (contours, m s?1) at the height of 0.1 km and vertical velocity (shading, m s?1) vertically averaged from 5?10 km. The green curve represents the RMW at the height of 1 km in each simulation. The black dashed line marks the onset of RI in each experiment.
Recent studies (Miyamoto and Takemi, 2015; Chang and Wu, 2017; Chen et al., 2018b) have stressed the importance of the inner-core structure and intensity on the onset of RI. A compact and intense inner core with high inertial stability not only supports a high level of efficiency in converting diabatic heating to kinetic energy (Shapiro and Willoughby, 1982; Schubert and Hack, 1982; Hack and Schubert, 1986), but also prevents the ware core from being disrupted by the ventilation effect of the environmental VWS (Chang and Wu, 2017). Statistical studies (Carrasco et al., 2014; Xu and Wang, 2015) have also found a higher probability of RI for TCs with a smaller inner-core size. Hence, the strong primary circulation and the rapid RMW contraction in DIS provide a TC structure more favorable for RI onset than in CTL and BOG.
Another important structural parameter associated with RI onset is the axisymmetricity of a TC. Recent numerical (Miyamoto and Takemi, 2015; Chen et al., 2018b; Shi et al. 2019) and observational (Kieper and Jiang, 2012; Zagrodnik and Jiang, 2014) studies all revealed that the RI of a TC generally commences following the formation of an axisymmetric ring-shaped eyewall. Here, we calculate the potential vorticity (PV) axisymmetricity, defined by Miyamoto and Takemi (2015), to describe the axisymmetricity of the simulated TCs, which is given as:
where γ is the PV axisymmetricity; ? denotes PV; and r, λ, z and t are the radius, azimuth, height and time, respectively. An overbar denotes the azimuthal mean and the prime denotes the deviation from the azimuthal mean. The greater the γ, the more axisymmetric the TC structure. Figure 7 shows the evolution of γ averaged within the 3?8-km height range in the three experiments. To assure the value of γ reflects the axisymmetricity of the eyewall, we further average the γ within a 20-km radial extent that is centered on the corresponding RMW at a height of 5 km at each time.
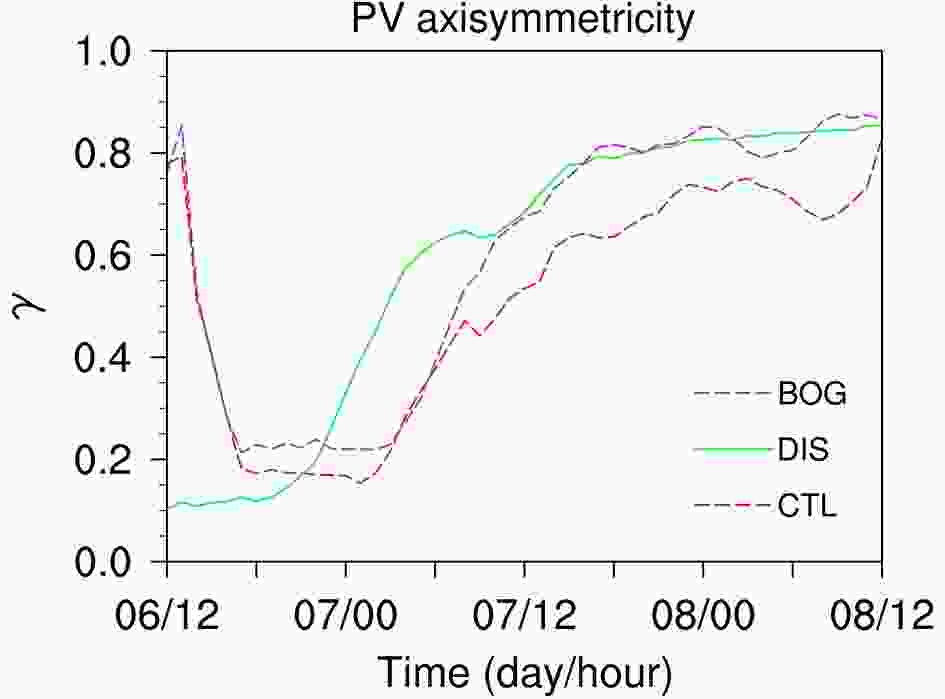 Figure7. Temporal evolution of PV axisymmetricity γ vertically averaged from 3 km to 8 km and horizontally averaged over a radial extent of 20 km centered on the 5-km RMW for CTL (dashed red), DIS (solid green) and BOG (dashed purple).
For both CTL and BOG, the γ is very high (0.8) at the initial time but decreases sharply as the asymmetric convections form around the storm center (not shown). The DIS TC initially has a significantly lower γ (0.1) due to the application of a warm startup. Nevertheless, the γ of the DIS TC begins to increase quickly at 2000 UTC 6 August and reaches a relatively high value (0.4) at RI onset (0200 UTC 7 August), while the γ in CTL and BOG does not increase until 0300 UTC 7 August. This result indicates the axisymmetrization of the eyewall takes place earlier in DIS than in CTL and BOG, which is consistent with the earlier RI onset timing of DIS. Since Lekima was embedded in a sheared environment (Fig. 1c), the differences in the axisymmetrization processes among the three simulations practically reflect the discrepancies in the evolutions of the shear-induced asymmetries. Next, we examine in detail the impact of VWS on the TC structure and its relationship with the simulated intensity change.
2
5.2. Effect of vertical shear on TC structural change
During the majority of the RI period, Lekima was subjected to moderate VWS with magnitudes from 4?8 m s?1 (Fig. 1c). In general, VWS can tilt an upright TC vortex and cause wavenumber-1 asymmetric precipitation distribution, which inhibits TC intensification (Jones, 1995; Corbosiero and Molinari, 2003). Previous studies have found that TCs experiencing RI under a moderate VWS share some similar structural changes before the RI onset (Zhang and Tao, 2013; Rogers et al., 2015; Susca-Lopata et al., 2015; Rios-Berrios et al., 2018; Tao and Zhang, 2019); namely, the midlevel vortex would rotate cyclonically from the downshear flank to the upshear flank relative to the low-level TC center—the so-called vortex precession. Simultaneously, the shear-induced asymmetric precipitation band would also extend from the downshear to the upshear side, causing the axisymmetrization of the inner-core precipitation. After precession, the TC would generally become vertically aligned and possess symmetric inner-core precipitation, which would favor the establishment of a symmetric and deep secondary circulation and thus trigger TC RI (Chen et al., 2018b; Tao and Zhang, 2019). Therefore, under a moderate VWS, a TC expediting the completion of precession is expected to commence RI earlier.To compare the vortex precession process in the three simulations, Fig. 8 shows the sea level pressure, mid-level circulation and radar reflectivity at three different times before the RI onset. Consistent with previous observational and numerical studies (Jones, 1995; Corbosiero and Molinari, 2003; Chen et al., 2006; Zhang and Tao, 2013), the VWS displaces the midlevel vortex away from the surface TC center and excites a clear wavenumber-1 structure with strong convection organized from the downshear to downshear-left section (Figs. 8a, d and g). Later on, the vortex precession is observed in each simulation, but is faster in DIS than in CTL and BOG. Specifically, the midlevel vortex in DIS has already rotated cyclonically into the upshear-left quadrant at 1900 UTC, while the midlevel centers in CTL and BOG are still located in the downshear-left quadrant (Figs. 8b, e and h). Afterward, the inner-core convection in DIS is quickly axisymmetrized, leading to the formation of a ring-shaped precipitation area (Fig. 8f). This accounts well for the sharp increase in the PV axisymmetricity (Fig. 7). Simultaneously, the vortex tilt lessens significantly in DIS but changes little in CTL and BOG (Figs. 8c, f and i). Thanks to the precipitation axisymmetrization and reduced vortex tilt, the DIS TC commences RI earlier than in CTL and BOG.
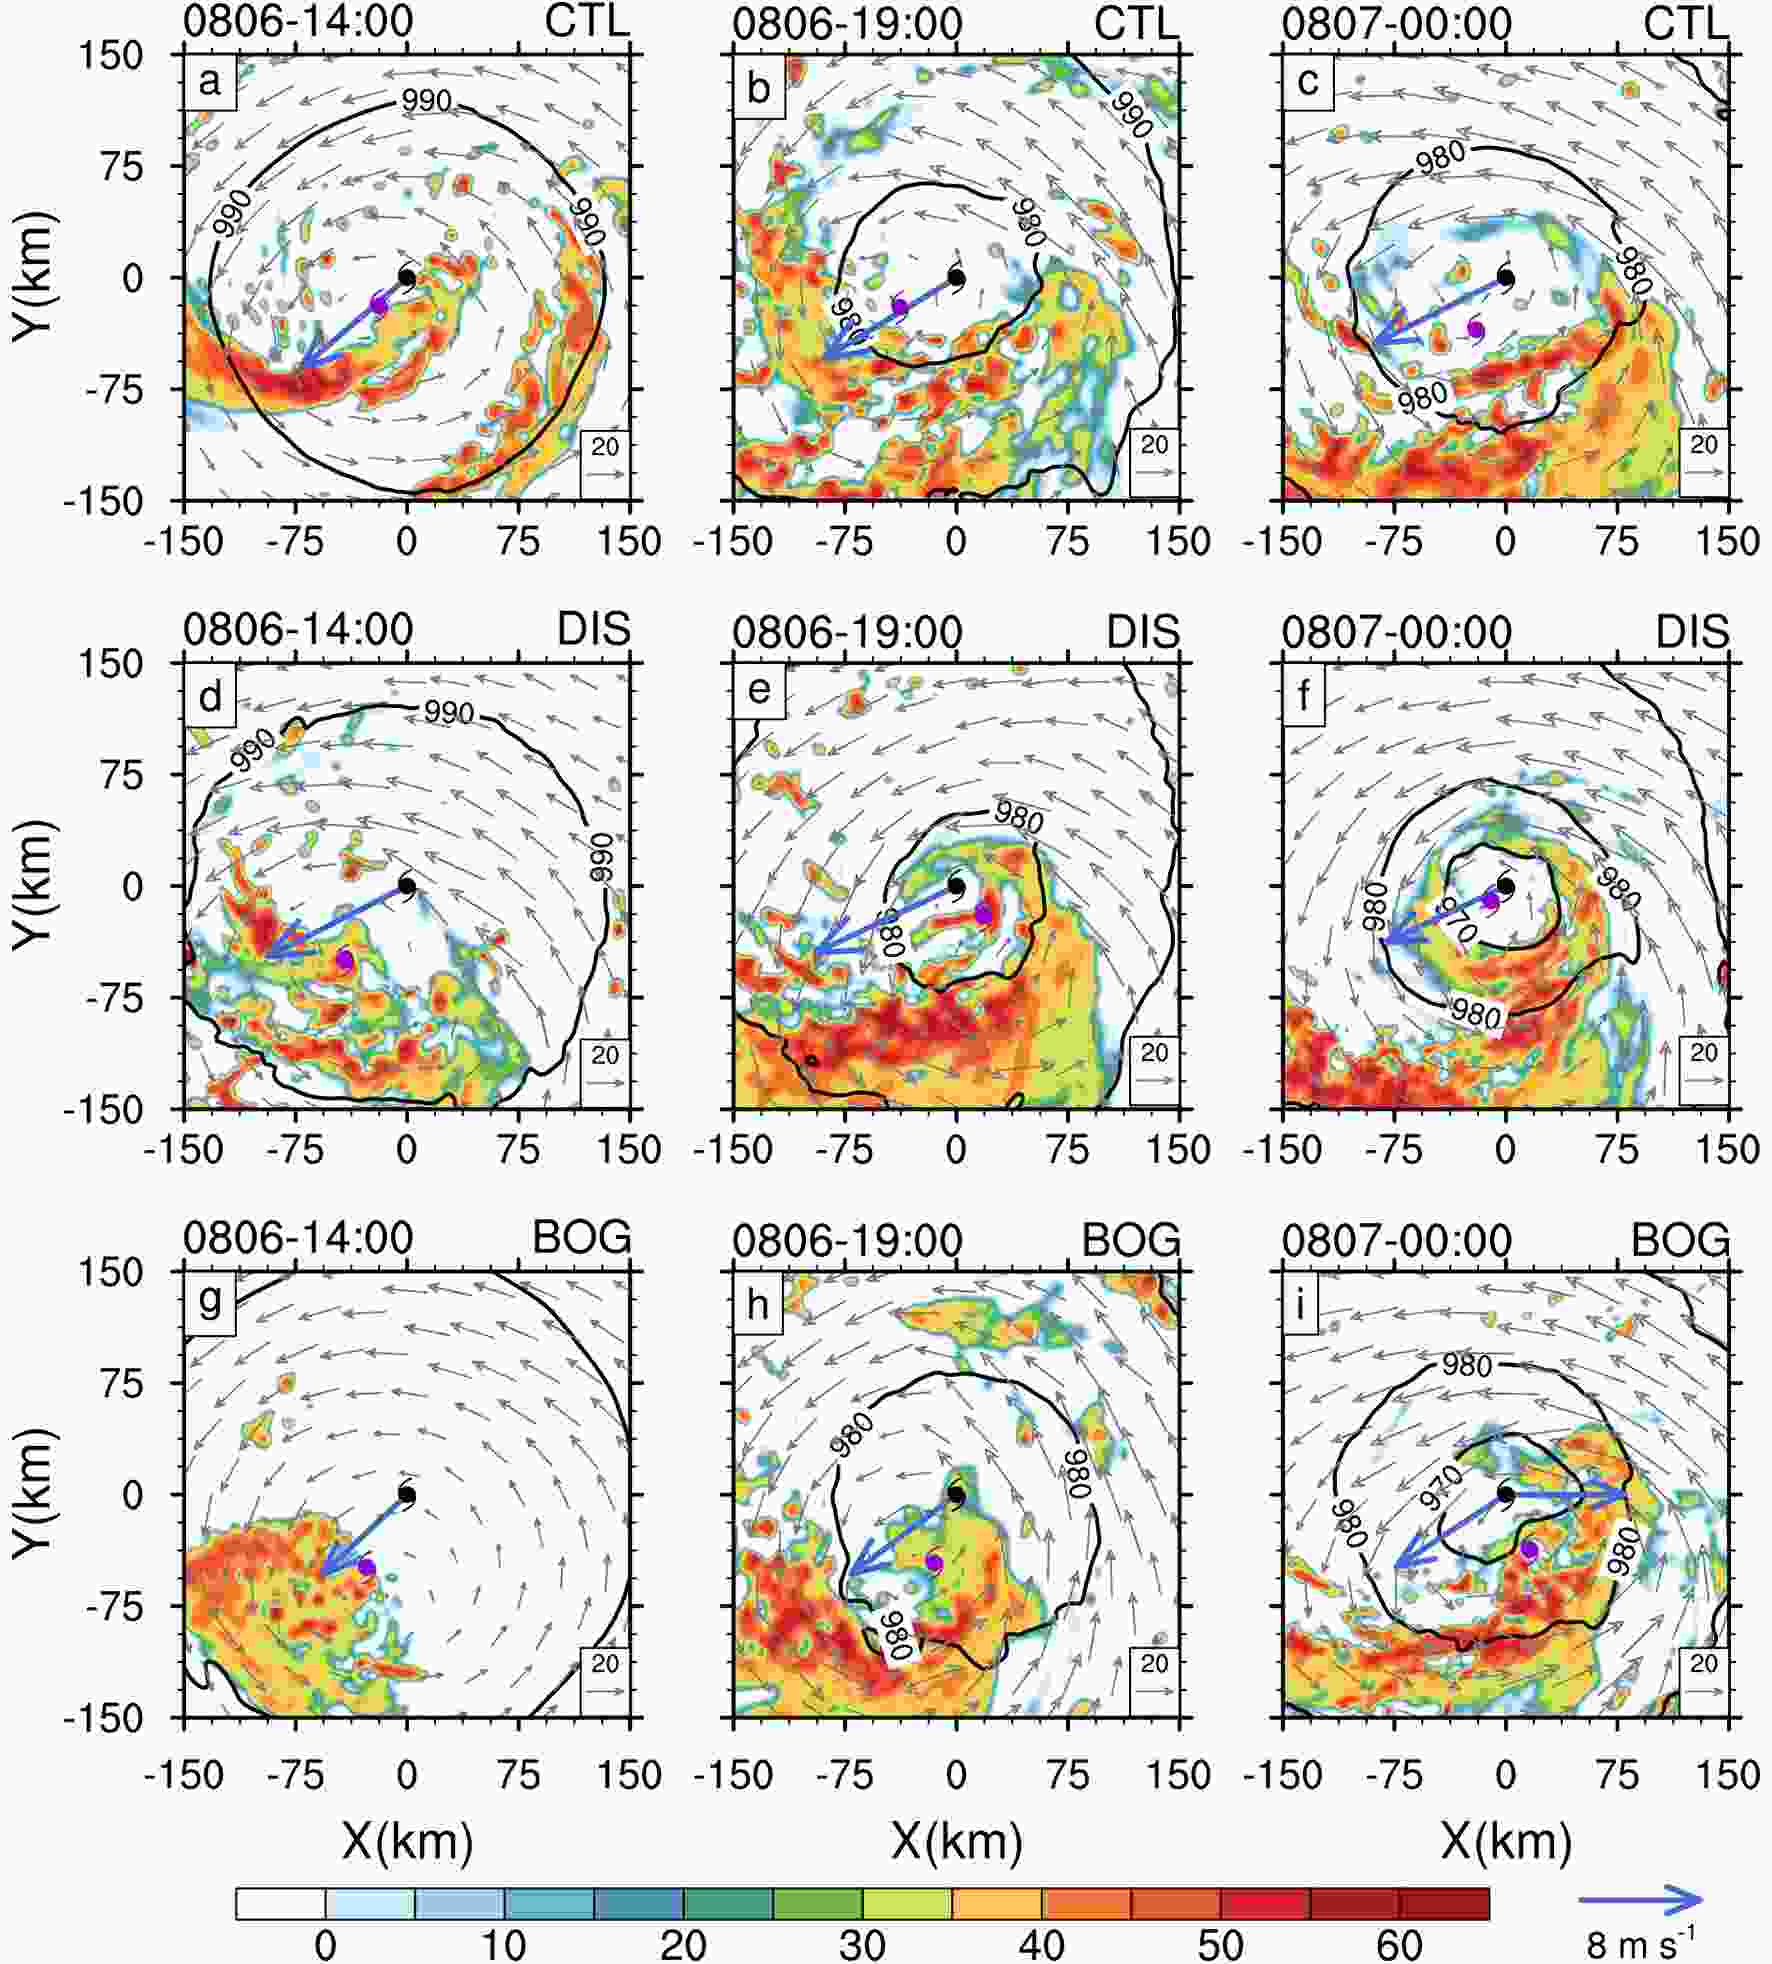 Figure8. Snapshots of the simulated radar reflectivity (shading, dBZ) at the height of 2 km, sea level pressure (contours, hPa) and storm-relative winds (grey vectors, m s?1) at 7 km from 1400 UTC 6 to 0000 UTC 7 August with a 5-h interval, in (a?c) CTL, (d?f) DIS and (g?i) BOG. The black and purple typhoon symbols represent the vortex centers at the surface at and 7 km, respectively. The blue vector represents the 300?850-hPa VWS, with the magnitude denoted by the blue reference vector to the right of the colorbar.
A question naturally arises as to why the midlevel vortex in DIS precesses faster into the upshear flank than in CTL and BOG. Jones (1995) demonstrated that the precession process is induced by the coupling between PV anomalies associated with the mid- and low-level vortices, where the advection of one PV anomaly by the flow induced by the other PV anomaly leads to the cyclonic rotation of the midlevel vortex relative to the low-level one. Thus, the precession speed is closely related to the strength of the low-level and midlevel primary circulation. As mentioned above, the low-level TC tangential winds in DIS spin up faster during the early stage of the integration than those in CTL and BOG (Figs. 6a-c). In addition, the strength of the midlevel circulation in DIS is also strongest among the three experiments (not shown). These facts account well for the faster vortex precession in DIS.
To further demonstrate the relationship between vortex tilt and RI onset, Fig. 9a shows the evolution of tilt magnitude in the three simulations. Here, the tilt magnitude is measured by the distance between the circulation centers at the surface and the height of 7 km. In each experiment, RI onset occurs when the tilt magnitude decreases to a certain value (≈ 15 km). Note that the calculation of tilt can be impacted by the definition of the TC center. To test the sensitivity of tilt evolution to the definition of the TC center, we recalculate the vortex tilt using the pressure centroid method (not shown), which is less sensitive to the mesovortices and irregular circulation structure (Nguyen et al., 2014). Despite a smaller magnitude, the tilt evolution calculated using the pressure centroid is similar to that using the circulation center, both with the fastest tilt reduction in the DIS simulation. These results validate the importance of vortex alignment on RI onset.
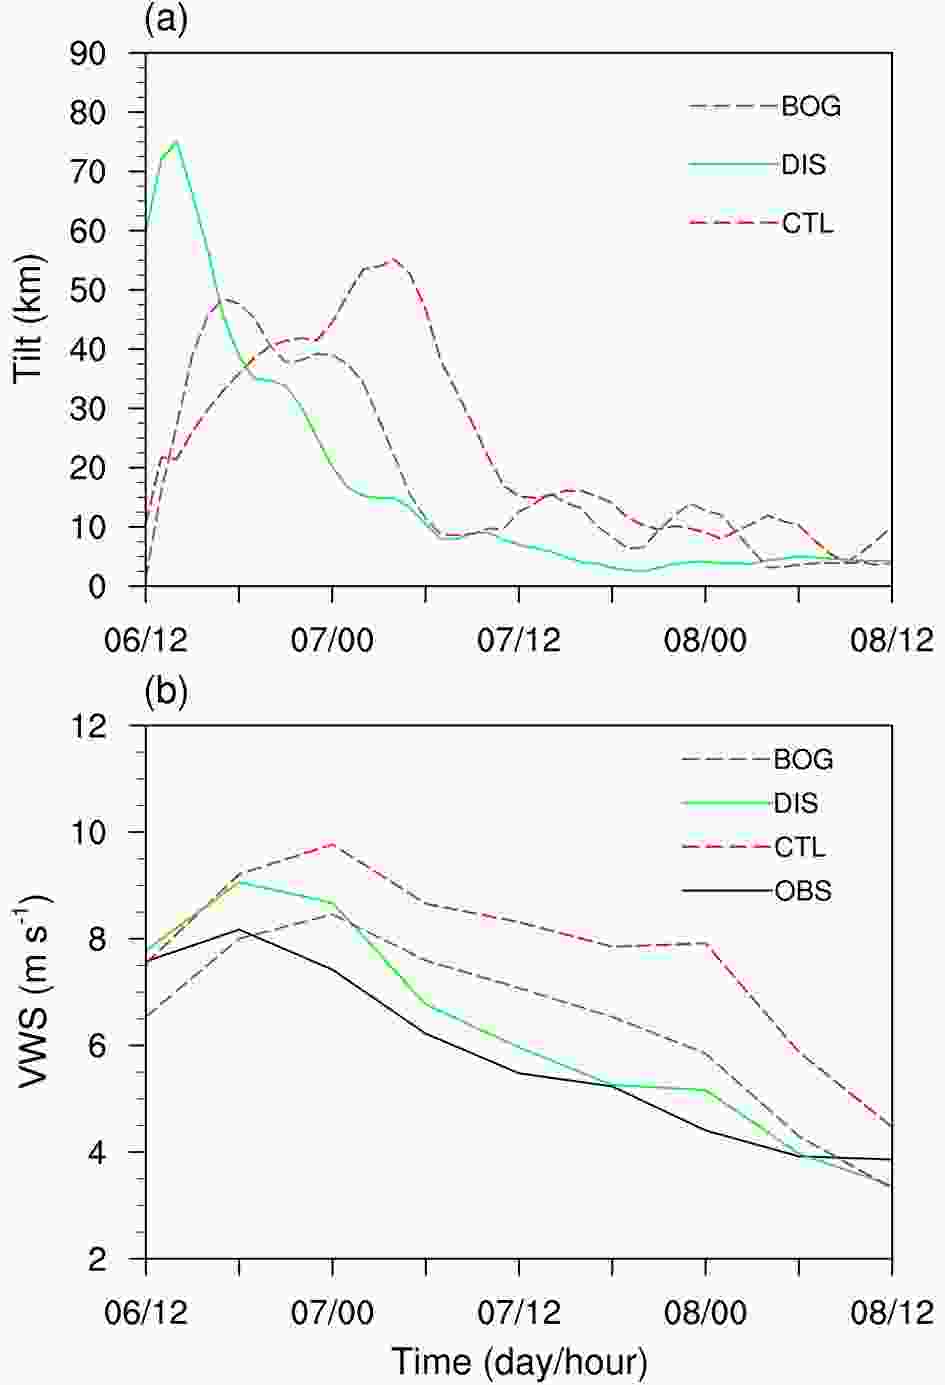 Figure9. Temporal evolution of (a) the magnitude of vortex tilt (km) and (b) the 300?850-hPa environmental VWS (m s?1) in CTL (red dashed), DIS (green solid) and BOG (purple dashed).
Furthermore, the role of VWS magnitude in the intensification rate is further examined. Figure 9b displays the evolution of the environmental VWS in the three simulations. The simulated VWS in DIS agrees well with that calculated from GFS-FNL, whereas the VWS in CTL and DIS are generally 1?3 m s?1 greater than that in DIS. The stronger VWS prevents the vortex from being vertically aligned (Fig. 9a) and may hinder the eyewall updrafts by midlevel ventilation (Tang and Emanuel, 2010; Ge et al., 2013), which partly accounts for the slower intensification rate during the RI in CTL and BOG. It is speculated that the different VWS magnitude is related to the discrepancy in TC?environment interaction among the three simulations, given that the initial vortex structures and intensities are distinct. Recent studies (Dai et al., 2019; Ryglicki et al., 2019) also report that the interaction between TC outflow and the surrounding environment can change the VWS around a TC. For instance, Ryglicki et al. (2019) suggested the divergent TC outflow at the upper level acts to divert the background environmental flow around the TC, thus reducing the local VWS. The detailed processes causing the different VWS are worthy of further investigations but are beyond the scope of this study. Nevertheless, the above results indicate a significant influence of an initial vortex in simulating the environmental factors, which in turn affect the forecast of TC RI.
Another factor possibly related to the distinct intensification rates in the three simulations is the outer rainband activity. Both the CTL TC and the BOG TC are characterized by a stronger and wider outer rainband as compared to the DIS TC (Fig. 5). The evolution of the outer rainband is further illustrated by the rainwater mixing ratio averaged between the 100 and 270-km radii (Figs. 10a-c). The simulated outer rainband exhibits an apparent wavenumber-1 feature with a primary rainband in the downshear-left quadrant, as generally observed in sheared TCs (Chen et al., 2006; Hence and Houze, 2008). In both CTL and BOG, the primary rainbands have a comparable intensity before and during the RI period (Figs. 10a, c). However, the primary rainband in DIS weakens significantly after 0600 UTC 7 August and shows no reinvigoration during the RI period (Fig. 10b), which is consistent with the reduced VWS (Fig. 9b). Other than the VWS magnitude, the distinct outer-rainband intensities among the TCs may also result from a local positive feedback between convection, TC primary circulation and air?sea flux. Namely, the more intense outer rainbands in CTL and BOG release ample diabatic heating that enhances the outer primary circulation, which increases the surface heat flux (Figs. 10d-f) and in turn fosters the convection of the outer rainband.
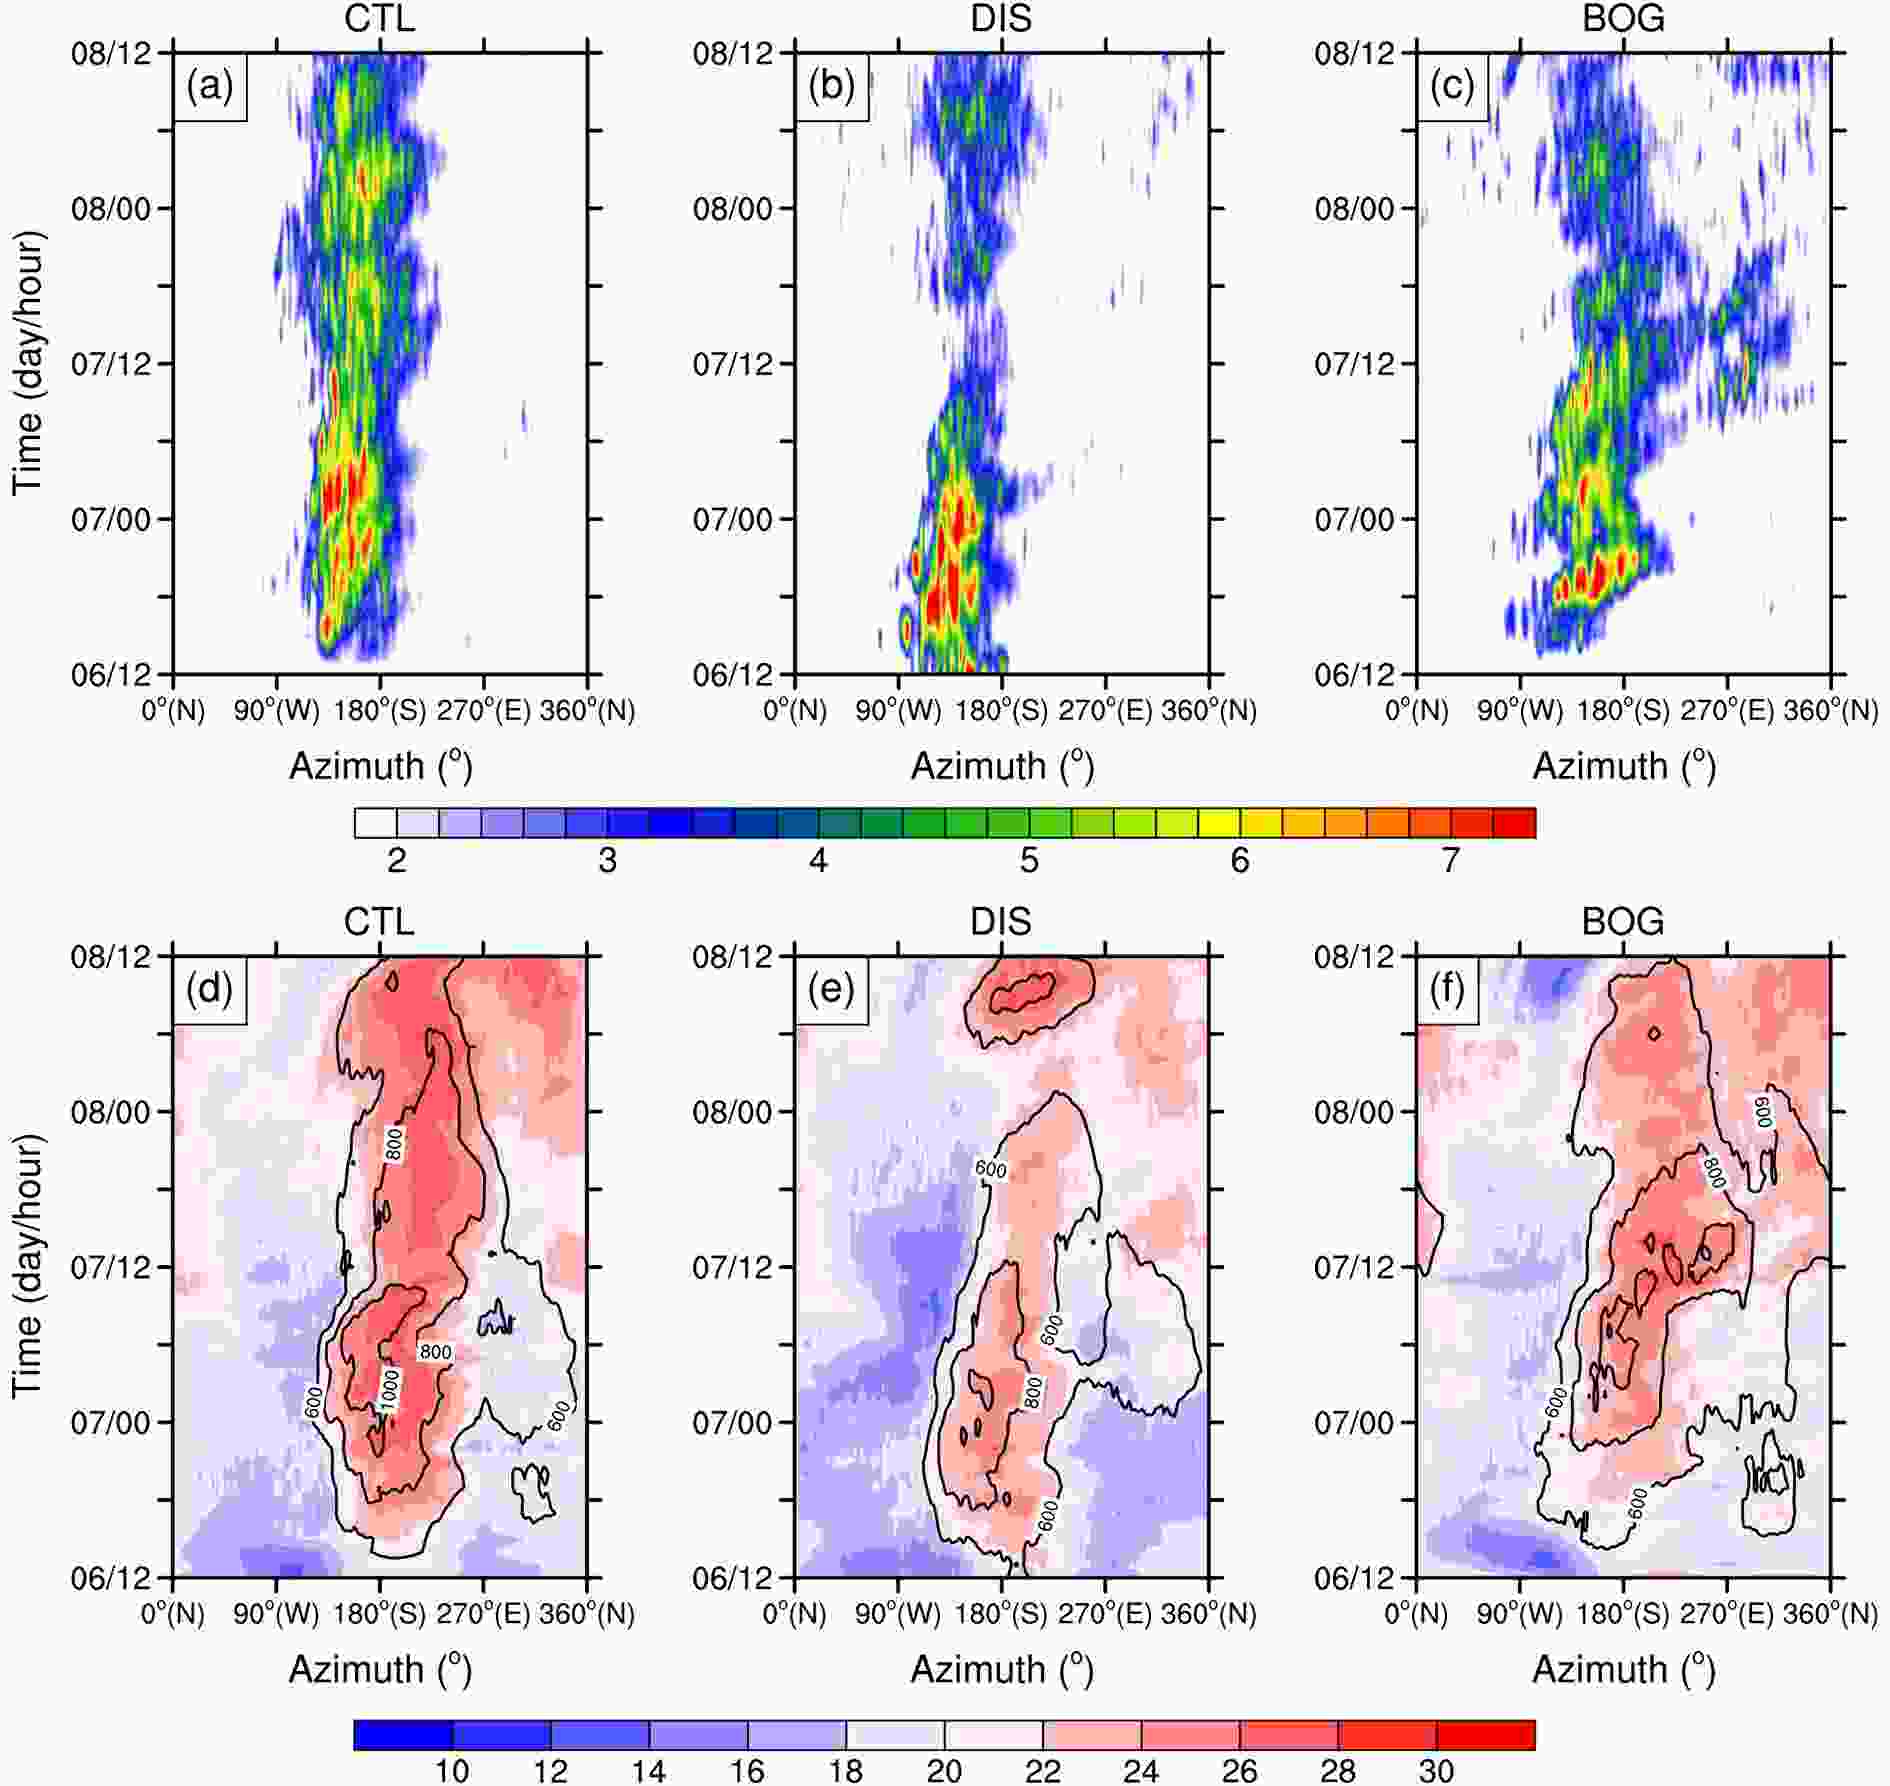 Figure10. Time?azimuth cross sections of (a?c) the rainwater mixing ratio (10?4 kg kg?1) vertically averaged between the heights of 3 and 6 km, and radially averaged between the radii of 100 270 km, and (d?f) the 10-m wind speed (shading, m s?1) and the surface heat flux (contours, W m?2; only values > 600 W m?2 are shown) averaged between the radii of 100 and 270 km, in (a, d) CTL, (b, e) DIS and (c, f) BOG.
Previous studies (Powell, 1990; Wang, 2009; Xu and Wang, 2010; Sun et al., 2014; Chen et al., 2018a) have suggested that the outer spiral rainbands can inhibit TC intensification, since it acts as a barrier to block the mass and moisture convergence into the eyewall and thus decreases the eyewall updrafts. Hence, the slower TC intensification in CTL and BOG is partially associated with the stronger asymmetric primary rainband in the TC outer region. This mechanism can be viewed as an indirect impact of VWS, since the discrepancy in the outer rainband intensities stems from the VWS strength in different simulations.
2
5.3. Inner-core convection
Convective activities in the TC inner-core region are critical to the maintenance and intensification of a TC. The convective bursts (CBs), a type of extremely intense and deep convection, are regarded to be responsible for RI occurrence (e.g., Chen and Zhang, 2013; Rogers et al., 2013; Wang and Wang, 2014). Generally, CBs can lead to considerable latent heat release in the inner-core region, which increases the potential energy of the vortex and intensifies the balanced tangential winds efficiently (Schubert and Hack, 1982; Pendergrass and Willoughby, 2009). Recent observational studies (Rogers et al., 2013; Wadler et al., 2018) have shown that TCs are more likely to intensify rapidly when there are more CBs near and inside of the RMW where the inertial stability is high.The number of CBs in the TC inner-core region in each simulation is shown in Figs. 11a and b. Here, we identify the CBs based on two different criteria, from Wang and Wang (2014) and Rogers (2010) (CBs defined as the grid points where the vertical velocity is greater than 7.5 m s?1 at 11 km and the averaged velocity between 700?300 hPa is greater than 5 m s?1, respectively), to avoid the uncertainty of using a single definition of CB. Note that comparable results are yielded using the two criteria. Consistent with Wang and Wang (2014), the number of CBs in the inner-core region shows a significant increase associated with the onset of RI and a sharp decrease after RI. During the RI period, the number of CBs is highest in DIS and maintains a peak for a longer period than those in CTL and BOG (Figs. 11a and b). The radial distributions of CBs in the three simulations are shown in Fig. 11c. For all three TCs, most of the CBs are situated within the annulus of 1?1.5 times the RMW. Of note is that the DIS TC has a higher frequency of CBs inside 1.25 times the RMW than the CTL TC and the BOG TC. This distribution of CBs results in stronger latent heating release at and inside the RMW during the RI in DIS compared to those in CTL and BOG. Furthermore, the DIS TC has a higher inertial stability in the inner-core region throughout the simulation (Fig. 11d), indicating a more efficient conversion from the diabatic heating to kinetic energy, favorable for the enhancement of secondary circulation (Schubert and Hack, 1982; Vigh and Schubert, 2009).
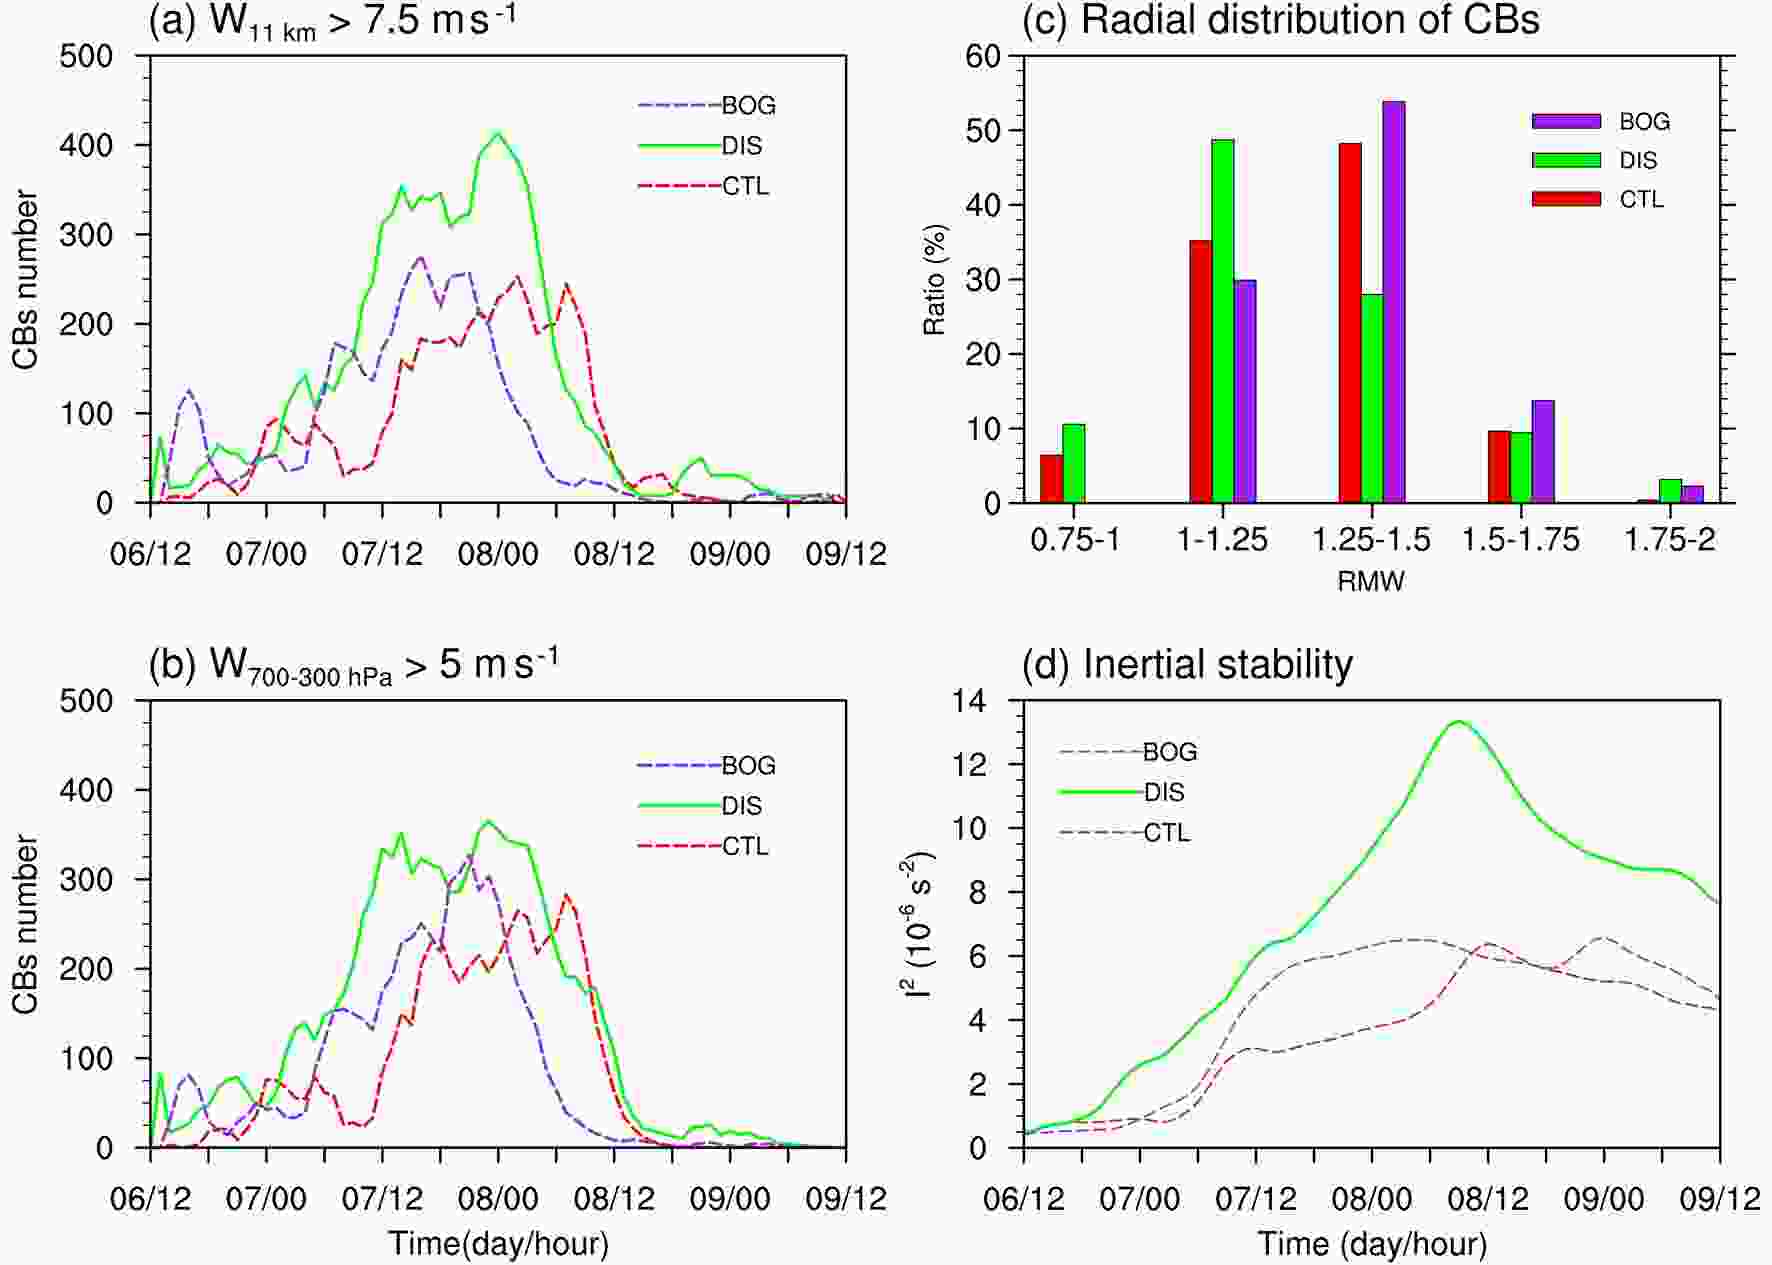 Figure11. Time series of the number of CBs within the 60-km radius identified as the grid points where (a) the vertical velocity is greater than 7.5 m s?1 at the height of 12 km and (b) the averaged velocity between 700?300 hPa is greater than 5 m s?1. (c) Ratio (%) of CBs to the total CB number within twice the RMW as a function of the radial location normalized by the 2-km RMW averaged between 1200 UTC 7 and 0600 UTC 8 August. (d) Time series of the inertial stability (10?6 s?2) averaged within the lowest 3 km and the 60-km radius.
Numerous studies (Chen and Zhang, 2013; Wang and Wang, 2014; Ge et al., 2015; Chang and Wu, 2017) have suggested that the compensating subsidence associated with the detrainment of CBs can induce an upper-level warm core, which lowers the surface pressure in the TC center and induces RI. Consistently, we also found a stronger upper-level warm core in DIS than that in CTL and BOG (not shown). However, this mechanism has been recently questioned by Smith and Montgomery (2015), since it provides no dynamical explanations for the mass depletion in the TC center and the intensification of maximum tangential wind during the formation of an upper-level warm core. Therefore, more dynamical examinations are required in future to justify the effect of the upper-level warm core in RI.
Since TC intensification is driven by the total diabatic heating in the inner-core region, it is necessary to compare the diabatic heating from CBs with that from other types of precipitation. Using the precipitation partitioning algorithm of Rogers (2010), the precipitation is divided into three regimes—namely, the convective component, the stratiform component and a supplementary component that satisfies neither the convective or stratiform criteria. Because the convective updrafts do not necessarily meet the CB criterion, the convective grids are further classified as the CB and moderate-to-weak convection. This classification agrees with Chang and Wu (2017). The diabatic heating associated with each type of precipitation is shown in Fig. 12. Note that the stratiform and supplementary components are combined into one group, labeled “other” (Figs. 12c, f and i), since their contribution is relatively small.
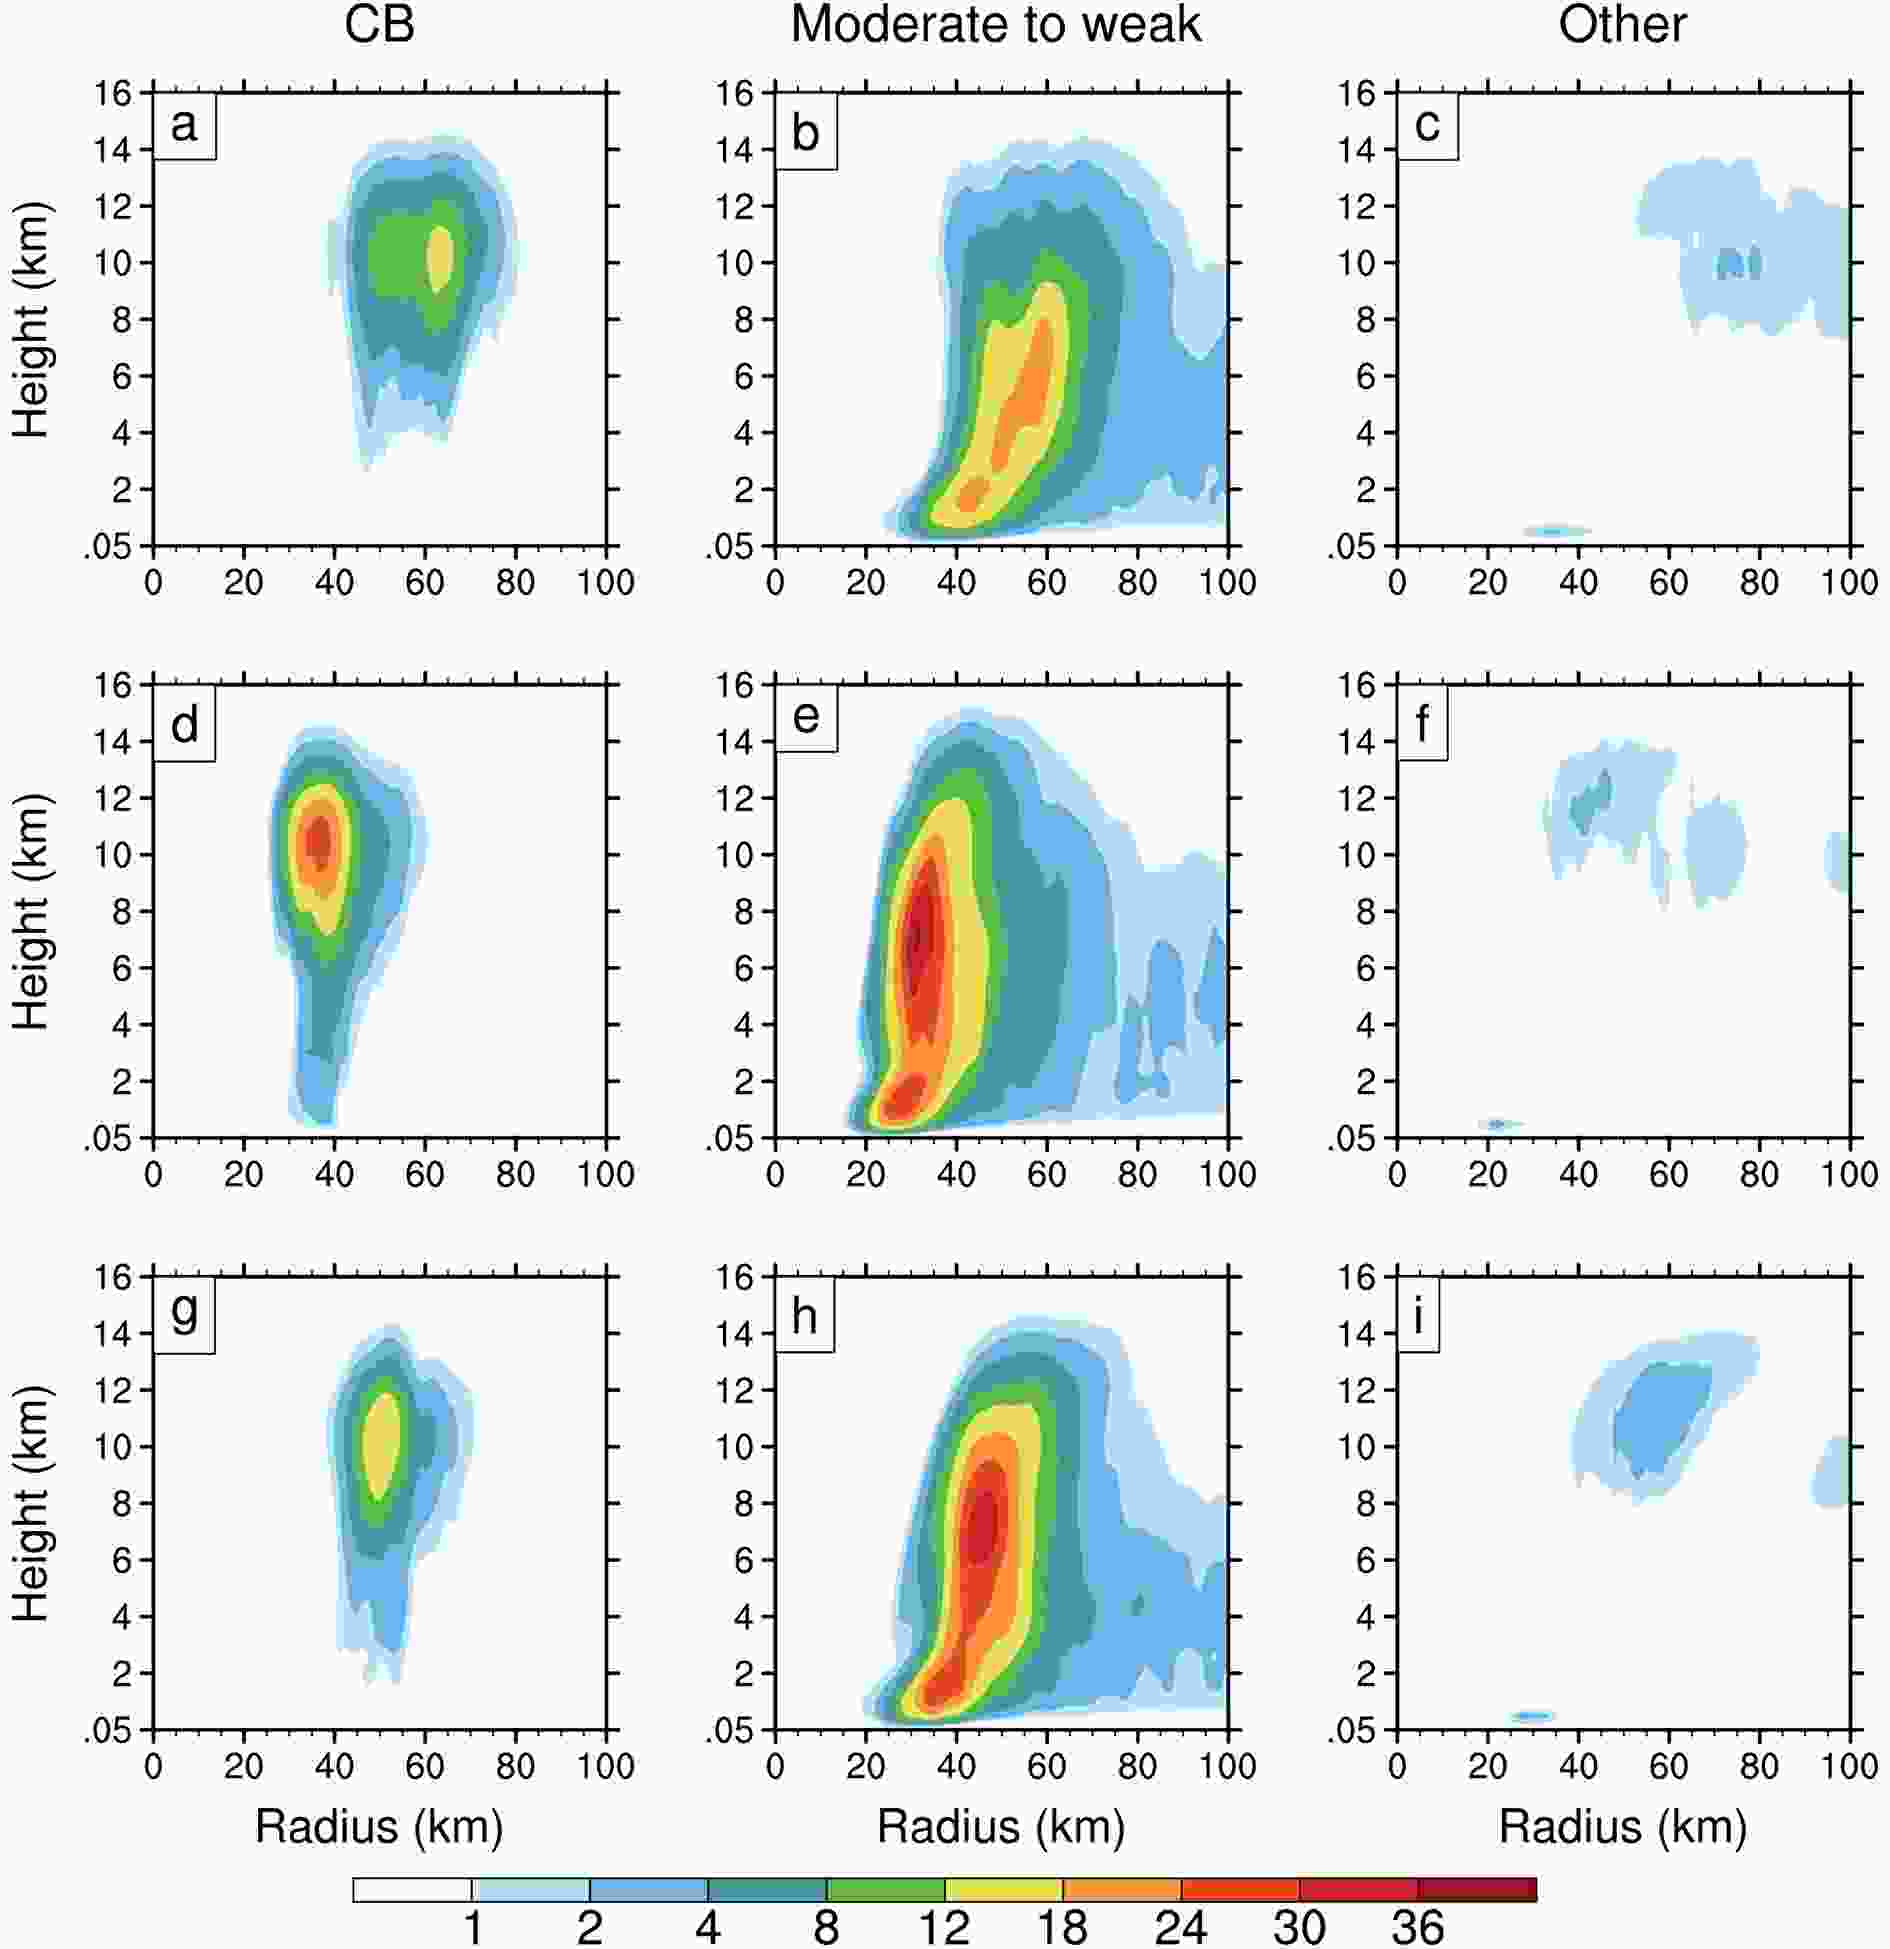 Figure12. Radius?height cross sections of the azimuthal-mean diabatic heating rate (K h?1) averaged between 1200 UTC 7 and 0600 UTC 8 August, contributed by (a, d, g) CBs, (b, e, h) moderate-to-weak convection, and (c, f, i) other types of precipitation, for (a?c) CTL, (d?f) DIS and (g?i) BOG.
The diabatic heating of the CBs and moderate-to-weak convection shows distinct patterns. Specifically, the distribution of the CBs heating is nearly upright with an upper-tropospheric maximum (Figs. 12a, d and g), while the diabatic heating of moderate-to-weak convection tilts outward with height, with the maxima in the mid-troposphere between 6 and 9 km (Figs. 12b, e and h). Despite a small areal coverage, the CBs release diabatic heating that accounts for 40%?60% of the total heating in the upper troposphere. In the mid-to-lower troposphere, however, the main heat source comes from the moderate-to-weak convection. Therefore, the CBs and moderate-to-weak convection may both make an important contribution to RI.
The relative importance of different precipitation regimes in RI has been investigated in previous studies. Chang and Wu (2017) suggested that the diabatic heating of weak-to-moderate convection is the major heating source enhancing the secondary circulation that triggers RI, while CBs play a supporting role. Using the balanced Sawyer?Eliassen diagnostic, Chen et al. (2018b) also found a dominant role of the diabatic heating of midlevel and deep convection in driving the earlier RI onset of TCs over warmer SST, and the CBs only contribute a small part of the heating source. On the other hand, however, Harnos and Nesbitt (2016) showed that CBs are the primary heating and vertical mass and vapor flux contributors within RMW both preceding and during the RI of simulated TCs. Note that the definitions of the convective regimes are different among these studies, which partly leads to discrepancies between the results.
Consistent with Chang and Wu (2017) and Chen et al. (2018b), the CBs in Lekima occupy a smaller portion of the total heating source than the moderate-to-weak convection, indicating a smaller contribution to the balanced secondary circulation. However, the effect of CBs cannot be generalized by the axisymmetric secondary circulation since CBs are highly asymmetric in nature and impact the local dynamic and thermodynamic parameters significantly. For instance, the more top-heavy heating profile of CBs (Figs. 12a, d and g) can facilitate PV generation over a deeper vertical layer (Harnos and Nesbitt, 2016). The ensuing axisymmetrization of these strong PV perturbations acts to amplify the primary circulation. Hence, a more comprehensive examination accounting for both axisymmetric and asymmetric dynamics is required in further studies to separate the relative contributions of different precipitation regimes to RI.
Given the potential modulation of outer-core wind strength on TC intensification, one may wonder if the performance of the bogussing scheme in RI simulation can be improved by adjusting the Rankine vortex parameter α. To address this question, two sensitivity experiments, with α being ?0.75 and ?1.1, are conducted, termed BOG0.75 and BOG1.1, respectively. As shown in Fig. 13a, the tangential wind profiles at an altitude of 2 km in BOG are very similar to those in DIS, while BOG1.1 (BOG0.75) has smaller (larger) outer wind speeds than DIS. Note that pronounced differences in TC structure still exist between the BOG and DIS experiments, since no attempt was made to match the tangential wind of the two experiments at the mid-to-upper level or construct a secondary circulation for BOG. As discussed in section 5a, the lack of a secondary circulation in the bogus vortex is an important factor limiting the simulation of RI.
 Figure13. (a) Radial profile of the 1-km azimuthal-mean tangential wind speed (m s?1) for DIS and three bogussing-scheme simulations. (b)?(c) as in (a), but for the time evolution of maximum 10-m wind speed (m s?1) and minimum SLP (hPa). The vertical lines in (b)?(c) denote the RI onsets in corresponding simulations.
The evolution of VMAX and MSLP of the three bogussing-scheme experiments are shown in Figs. 13b and c. As expected, the simulated TC tends to have an earlier RI onset and intensifies more rapidly when the tangential wind outside of the RMW decreases faster with radius, indicating the configuration of the parameter α, in addition to the RMW and maximum wind speed, can also impact RI simulation. When the tangential wind decreases faster outside of the RMW (i.e., BOG1.1), the TC shows a similar RI onset to that in DIS and stronger intensification during the early portion of RI. However, the RI process in BOG1.1 ceases much earlier than that in DIS. Specifically, the TC in BOG1.1 stops intensifying at 2000 UTC 7 August, while the DIS TC keeps intensifying until 0600 UTC 8 August. In short, the above facts indicate that although the adjustments to the parameter α can improve the prediction of RI onset, the resultant inaccurate wind structure may eventually lead to considerable intensity errors. In other words, the discrepancies between the DIS and BOG simulations, which partially resulted from the lack of a secondary circulation in BOG, cannot be simply compensated by changing the out-core wind profile.
Further analysis indicates that the different RI onsets and intensification rates can be attributed to the simulated TC structures and inner-core convection, which is closely related to the TC vortex structure in the initial condition. The initial TC vortex in DIS has a stronger and more compact secondary circulation than those in CTL and BOG. This favors the mass and moisture convergence in the inner-core region, leading to the deep convection located closer to the TC center in DIS than in CTL and BOG. The convective heating helps to spin up the inner-core tangential wind and trigger a quick RMW contraction for the DIS TC. The compact and intense inner-core circulation provides a favorable structural configuration for the earlier RI onset in DIS since the enhanced inertial stability increases not only the heating efficiency but also the resistance to the detrimental effect of midlevel ventilation.
Moreover, the evolution of TC structure under moderate VWS is also important to the RI onset timing and subsequent intensification. The shear-induced asymmetric convective band and midlevel vortex rotate fast cyclonically relative to the lower-level TC center from the downshear side to the upshear side in DIS owing to the stronger inner-core primary circulation. Accordingly, the DIS TC structure becomes vertically aligned and symmetric earlier than the CTL TC and the BOG TC, consistent with its earlier RI onset. The structural evolution of simulated TCs further impacts the change in the environmental VWS. The decreasing trend of VWS during the RI of Lekima is captured well in DIS but underestimated in CTL and BOG. As a result, the stronger VWS acts to prevent the TC structure from full vertical alignment and contribute to the active asymmetric primary outer rainband in the downshear-left quadrant, both of which are unfavorable for TC intensification.
Finally, during the RI period, the DIS TC has more CBs than those in CTL and BOG, and the CBs in DIS reside preferentially within 1.25 times the RMW where large inertial stability favors a higher efficiency in converting potential energy to kinetic energy. Further examinations show that the moderate-to-weak convection also contributes considerably to the total diabatic heating in the inner-core region and is important for the persistent RI in DIS.
To summarize, our results suggest that the DI scheme can generate a more realistic initial vortex that improves the prediction of not only the inner-core process but also the large-scale environmental parameter (i.e., VWS), which are all important to the intensity forecast. Sensitivity experiments initialized with different Rankine vortex parameter α further indicate the discrepancies between the DIS and BOG simulations cannot be simply compensated by adjusting the out-core wind profile, since the inaccurate wind structure may eventually lead to considerable intensity errors. It should be mentioned that the results in this paper are obtained from a series of deterministic simulations and are by no means sufficient. More experiments with different initial times and TC cases should be conducted in future studies to validate the present results.
Acknowledgements. This study was supported by the National Natural Science Foundation of China (Grant Nos. 41775063 and 41975071). The authors thank the two anonymous reviewers for their valuable comments that helped improve the quality of the manuscript.
