HTML
--> --> --> The Taal Volcano in Luzon is one of the most active and dangerous volcanoes of the Philippines. A recent eruption occurred on 12 January 2020 (Fig. 1a), and this volcano is still active with the occurrence of volcanic earthquakes. The eruption has become a deep concern worldwide, not only for its damage on local society, but also for potential hazardous consequences on the EarthЁЏs climate and environment. Figure1. Observed El Ni?o and enhanced polar vortex?induced Eurasian warming after three large tropical eruptions. (a) Eruption cloud of the Taal Volcano taken from an airplane on 12 January 2020 (Photo credit: Faxin CHEN). (b) Composite 50-hPa geopotential height anomaly in JRA-55 (upper panel) and surface air temperature anomaly in GISTEMP in the first boreal winter following the 1963 Agung, 1982 El ChichЈЎn, and 1991 Pinatubo eruptions [updated from Xing et al. (2020)]. Stippling indicates temperature anomalies significant at the 95% confidence level. The magenta arrow denotes stratospheric westerly anomalies around 70ЁуN, and the gray arrow gives the potential linkage between the stratosphere and surface.
Volcanic eruptions affect climate through injecting sulfur dioxide (SO2) into the stratosphere (Robock, 2000). The volcanic sulfate aerosols formed through the reaction between SO2 and hydroxide or water vapor exhibit a typical e-folding time of about 12?14 months. A large eruption that injects sulfate aerosols into the stratosphere can perturb global climate by scattering incoming solar radiation, resulting in global surface cooling that may last for two to three years after the eruption owing to the delayed ocean response (Sear et al., 1987; Robock, 2000). Tropical eruptions tend to slow down the global hydrological cycle (Trenberth and Dai, 2007; Iles and Hegerl, 2014), leading to a weakened global monsoon system (Man and Zhou, 2014; Liu et al., 2016; Stevenson et al., 2016). The semi-arid region, however, tends to get wetter owing to the monsoon?desert coupling mechanism (Zuo et al., 2019).
Big volcano eruptionsЁЏ climate impacts can last for decades through a positive sea-ice/albedo feedback, even though the volcanic aerosols in the stratosphere remain only for about a year (Schneider et al., 2009; Zanchettin et al., 2011; Slawinska and Robock, 2018). Expanded Arctic sea-ice cover existed for a decade after the latest three large tropical eruptions, although the sea ice is sensitive to pre-eruption temperature (GagnЈІ et al., 2017). One of the largest eruptions during the current Holocene Epoch, the 1258 Samalas eruption, together with three small ensuing eruptions, are speculated to have triggered the Little Ice Age through positive sea-ice/ocean feedbacks during a cooling summer (Miller et al., 2012). The phase of the Atlantic Multidecadal Oscillation can be affected by large volcanic eruptions (Otter? et al., 2010). Background conditions, i.e., the initial climate state and additional external forcings, may influence the decadal responses of oceanic heat transport and sea ice in the North Atlantic to large tropical eruptions (Zanchettin et al., 2011, 2013). However, in work by Bethke et al. (2017), historical volcanic eruptions could not counteract the long-term global warming trend induced by anthropogenic greenhouse gases under the future emissions scenario based on a general circulation model (GCM) simulation.
Nevertheless, volcanic eruption-induced global cooling suggests a useful strategy against global warming (Niemeier and Tilmes, 2017). Stratospheric aerosol geoengineering (SAG), also known as ЁАsolar radiation managementЁБ in the Geoengineering Model Intercomparison Project (GeoMIP), is an analogue of large volcanic eruptions in terms of impacts on global climate, and an artificial supplementary method that could mitigate anthropogenic global warming through increasing the planetary albedo (Kravitz et al., 2015; Niemeier and Tilmes, 2017). The goal to hold temperatures at 1.5ЁуC or 2.0ЁуC higher than the level of 1850?1900 can be reached with SAG, which partially balances a future high emissions scenario with CESM2 (WACCM6) (Tilmes et al., 2019). Apart from the high economic costs and technological requirements for SAG, one more obstacle is that its direct and indirect effects on the hydrological cycle remain inconsistent. For the same global temperature change, volcanic eruption-induced global precipitation changes are stronger than those resulted from greenhouse gases (Liu et al., 2018c). Although precipitation and evaporation are reduced by applying SAG (Tilmes et al., 2013), it is inspiring that wetlands, as the ratio of precipitation and evaporation, can be increased over major American land regions where people reside (Xu et al., 2020).
Five large tropical eruptions have occurred since instrumental observations began to become available 150 years ago (Sato et al., 1993; Gao et al., 2008), i.e., the 1883 Krakatau, 1902 Santa Maria, 1963 Agung, 1982 El ChichЈЎn, and 1991 Pinatubo eruptions (Table 1). Contrary to the global volcanic cooling trend in the first three years following these large tropical volcanic eruptions, an average 0.1 K global mean surface temperature rebound happened in the first post-eruption boreal winter (Xing et al., 2020). Such a global temperature rebound of the first Northern Hemisphere (NH) winter results from the atmospheric responses to the blockage of shortwave radiation, which induces an El Ni?o-like warming and a Eurasian warming caused by an enhanced polar vortex (Fig. 1b).
| Eruption | Date | Longitude/Latitude | SO2 mass (Tg) | VEI |
| Krakatau | 26?27 Aug 1883 | 6.1ЁуS, 105.4ЁуE | 22 | 6 |
| Santa Maria | 24?25 Oct 1902 | 14.8ЁуN, 91.6ЁуW | 4 | 5 |
| Agung | 17 Mar, 16 May 1963 | 8.3ЁуS, 115.5ЁуE | 17 | 5 |
| El ChichЈЎn | 3?4 Apr 1982 | 17.4ЁуN, 93.2ЁуW | 14 | 5 |
| Pinatubo | 15 Jun 1991 | 15.1ЁуN, 120.4ЁуE | 30 | 6 |
| Taal | 12 Jan 2020 | 14.0ЁуN, 120.6ЁуE | 0.019 | 3 (conjecture) |
Table1. Information on the 2020 Taal eruption and the five strongest tropical eruptions over the past 150 years. The eruption date, location, aerosol loading, and Volcanic Explosivity Index (VEI) of each eruption are given. The SO2 mass was obtained from Gao et al. (2008). For the 2020 Taal eruption, the accumulated SO2 mass from 12?31 January was calculated by the Philippine Institute of Volcanology and Seismology (https://www.phivolcs.dost.gov.ph/index.php/taal-volcano-bulletin-menu/). The VEI of the Taal eruption is inferred from historical SO2 loading and the eruption height.
El Ni?o events were observed in the first boreal winters after these large tropical eruptions, except for the 1883 Krakatau eruption (Khodri et al., 2017). Due to the small sample size, the statistical significance cannot be established, and thus these El Ni?o events may also be attributable to internal variability (Self et al., 1997; Robock, 2000). However, long-term reconstruction analysis has suggested a hypothesis that large tropical eruptions can increase the probability of El Ni?o occurrence (Adams et al., 2003; McGregor and Timmermann, 2011; Liu et al., 2018a). Liu et al. (2018b) found that, over the last millennium, about 81% of tropical volcanic eruptions were followed by an El Ni?o-like sea surface temperature (SST) anomaly during the first post-eruption NH winter if the ocean before eruption had been in a neutral or La Ni?a condition. The 2019/20 winter did not witness a strong El Ni?o condition since not all the oceanic Ni?o indexes exceeded 0.5ЁуC for five consecutive three-month periods. Therefore, there is an 83% (25/30) probability that an El Ni?o-like warming will occur in the 2020/21 winter if the Taal Volcano continues to eject large amounts of SO2 into the stratosphere (Fig. 2a).
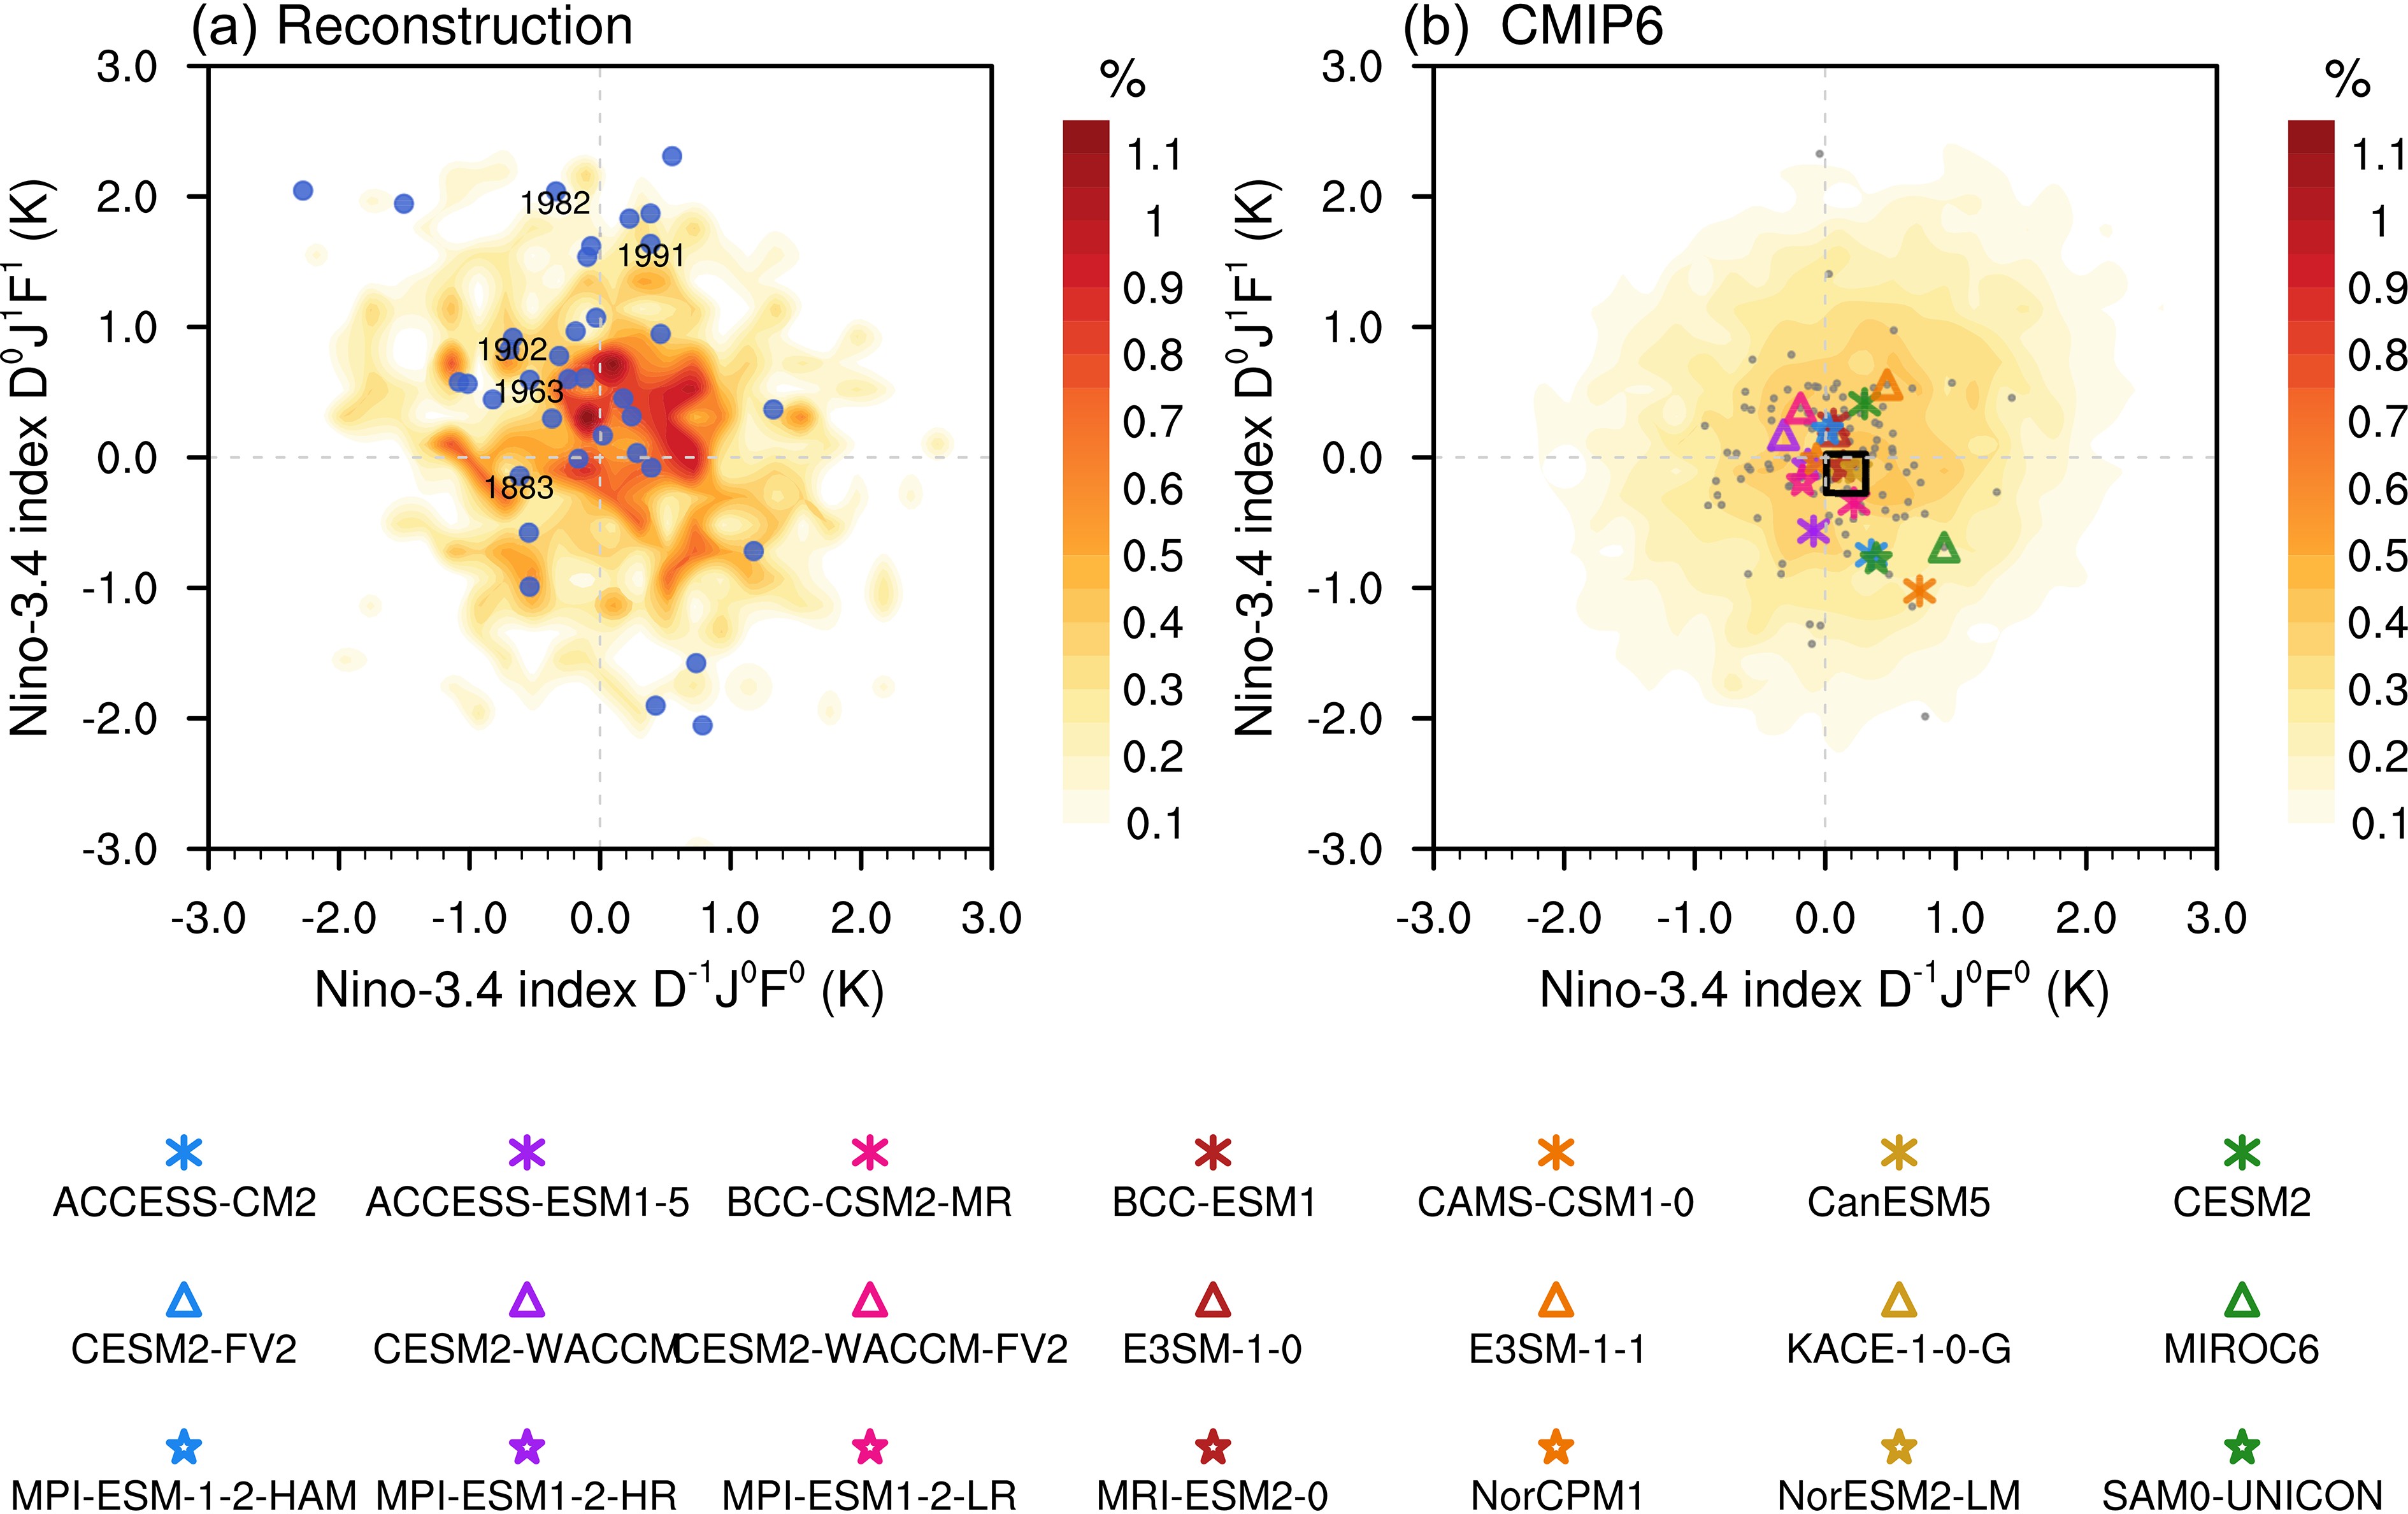 Figure2. Relationship between ENSO responses to tropical eruptions and initial ocean conditions. Scatterplots of Ni?o3.4 index anomalies (dots) during the winter before eruption versus the first winter after eruption in (a) reconstructed ENSO index for tropical eruptions over the past 1100 years, and in (b) CMIP6 for the five tropical eruptions since 1870. Shading indicates the density distribution of the internal mode of ENSO relative to the total sample number. As for the reconstructions, the recent large tropical eruptions since 1870 were selected based on Gao et al. (2008), and the remaining eruptions were based on Sigl et al. (2015). For the simulations, colored symbols denote the average of these five tropical eruptions for the ensemble mean of each model, and the black square is their multi-model mean.
There are uncertainties in the prediction of the effects of volcanic eruptions on the El Ni?o occurrence with models. Numerical experiments of some individual models have reproduced the El Ni?o occurrence. The tropical eruption-induced El Ni?o in these models is related to several possible mechanisms: the ocean dynamic thermostat mechanism (Ohba et al., 2013; Predybaylo et al., 2017), the equatorward migration of the Intertropical Convergence Zone caused by reduced evaporation over cloudless subtropical regions (Lim et al., 2016), the land?ocean thermal contrast-induced westerly anomaly (Predybaylo et al., 2017), and the westerly response to suppressed West African monsoon and Warm Pool precipitation (Khodri et al., 2017; Chai et al., 2020). Another two factors may also affect the simulation of El Ni?o-like responses after tropical eruptions: the initial ocean condition and eruption strength. It is hard to replicate an El Ni?o when the initial ocean condition is already at an El Ni?o peak phase before the eruption (Liu et al., 2018b). Besides, the volcanic eruption has to be strong enough to excite an El Ni?o (Emile-Geay et al., 2008; Lim et al., 2016).
However, in contrast to the results obtained from experiments with the individual models, most models participating in phase 5 of the Coupled Model Intercomparison Project (CMIP5) (Xing et al., 2020), phase 3 of the Paleoclimate Modelling Intercomparison Project (Chai et al., 2020Ђй), and CMIP6 (Fig. 2b) fail to produce an El Ni?o response in the first post-eruption winter. After tropical volcanic eruptions, the Ni?o3.4 SST warming cannot be reproduced against the uniform global volcanic cooling. In some models, however, a positive SST anomaly gradient in the equatorial Pacific with a positive sea surface height anomaly over the Ni?o3.4 region is simulated (Ding et al., 2014; Maher et al., 2015; Wang et al., 2018). This discrepancy demonstrates that there are limitations in the simulation of air?sea interaction in some models (Watanabe et al., 2011), and suggests the representation of local and remote signals in different El Ni?o?Southern Oscillation (ENSO) reconstructions (Li et al., 2011; Dee et al., 2020).
Volcanic eruptions can also affect the Eurasian winter temperature. A maximum 3ЁуC surface temperature increase was observed over the Eurasian continent in the first winter following the 1991 Pinatubo eruption, which was associated with the global temperature rebound immediately after a volcanic eruption (Robock and Mao, 1992; Robock, 2002). Although this 1991/92 winter warming has been argued to have been caused by internal variability (Polvani et al., 2019), a Eurasian warming was also observed in the first NH winter after the other three tropical volcanic eruptions (Xing et al., 2020). This type of European warming was verified to have occurred after 15 major tropical eruptions in a 500-year multi-proxy reconstruction (Fischer et al., 2007).
The tropical volcanic eruption?Eurasian warming teleconnection is related to stratosphere?troposphere interaction. A tropical volcanic eruption can warm up the lower tropical stratosphere directly since the aerosol clouds absorb incoming near-infrared radiation and upwelling longwave radiation. Ozone in the polar region is depleted by volcanic aerosols by influencing stratospheric ozone photochemistry processes. Since stratospheric ozone absorbs solar radiation, ozone depletion will decrease temperatures in the polar region (Stenchikov et al., 2002). As shown in Fig. 3a, this low-latitude stratospheric warming and polar cooling increase the meridional temperature gradient over the NH, resulting in a strengthened polar vortex in the NH winter (Robock, 2000). This enhanced polar vortex, associated with a positive westerly anomaly, tends to warm up Eurasia by trapping tropospheric wave energy through reflection of planetary waves (Perlwitz and Graf, 1995; Butler et al., 2014). Most of the CMIP5 (Xing et al., 2020) and CMIP6 models (Fig. 3a) are able to simulate this low-latitude stratospheric warming induced by shortwave radiation absorption. The enhanced polar vortex in the models, however, is too weak compared to reanalysis (Fig. 3b), posing a challenge for the current simulation of stratospheric teleconnection.
 Figure3. Stratospheric responses to tropical volcanic eruptions in CMIP6. Composites of (a) zonally averaged temperature anomalies (shading) as a function of latitude and height, and (b) 50-hPa geopotential height anomalies (shading) in the first NH winter following the five tropical eruptions for the multi-model mean of the 21 CMIP6 models. The ensemble mean of each model is also shown in (b). Stippling denotes anomalies significant at the 95% confidence level.
Current GCMs are able to reproduce the direct responses to large tropical eruptions (Trenberth and Dai, 2007; Iles and Hegerl, 2014; Man and Zhou, 2014; Liu et al., 2016; Stevenson et al., 2016), but they still have difficulty simulating the delayed responses, which is determined by their performance in replicating internal variability (Ding et al., 2014; Maher et al., 2015; Wang et al., 2018; Liu et al., 2018a, 2018b; Xing et al., 2020).
The climate effects of the Taal Volcano eruption will depend on the magnitude of the eruption, especially on the amount of SO2 ejected into the stratosphere to form volcanic aerosols. The Volcanic Explosivity Index (VEI)ЁЊa scale that represents the explosivity of an eruption eventЁЊconsists of volcanically ejected materials, the height of the ash plume, and the type of eruption (Newhall and Self, 1982). Compared to the five large historical tropical eruptions, the Taal eruption is still too small, and its SO2 amount is about two orders of magnitude smaller than those of the 1982 El ChichЈЎn and 1991 Pinatubo eruptions (Table 1), which means that the climate response to the current magnitude of the Taal eruption would be insignificant.
The Taal Volcano is still in an active phase, and the Philippine Institute of Volcanology and Seismology has sent out an alert over the Taal Volcano to warn that more explosive eruptions could happen. Since the 2019/20 winter was not in a strong El Ni?o condition, there is an 83% probability that an El Ni?o-like warming will occur in the 2020/21 winter if the magnitude of the continued Taal Volcano eruption or any other tropical volcanic eruption reaches a critical level where the VEI is greater than 3. Eurasian warming due to an enhanced polar vortex is also likely.
| Institution | Institution ID | Model | Ensemble members |
| Commonwealth Scientific and Industrial Research Organisation, Aspendale, Australian Research Council Centre of Excellence for Climate System Science | CSIRO-ARCCSS | ACCESS-CM2 ACCESS-ESM1-5 | 1 1 |
| Beijing Climate Center | BCC | BCC-CSM2-MR | 3 |
| BCC-ESM1 | 3 | ||
| Chinese Academy of Meteorological Sciences | CAMS | CAMS-CSM1-0 | 2 |
| Canadian Centre for Climate Modelling and Analysis | CCCma | CanESM5 | 25 |
| National Center for Atmospheric Research | NCAR | CESM2 | 11 |
| CESM2-FV2 | 1 | ||
| CESM2-WACCM | 3 | ||
| CESM2-WACCM-FV2 | 1 | ||
| Lawrence Livermore National Laboratory, Livermore; Argonne National Laboratory, Argonne; Brookhaven National Laboratory; Los Alamos National Laboratory; Lawrence Berkeley National Laboratory; Oak Ridge National Laboratory; Pacific Northwest National Laboratory; Sandia National Laboratories | E3SM-Project | E3SM-1-0 | 5 |
| E3SM-1-1 | 1 | ||
| National Institute of Meteorological Sciences/Korea Meteorological Administration | NIMS-KMA | KACE-1-0-G | 3 |
| Japan Agency for Marine-Earth Science and Technology, Atmosphere and Ocean Research Institute, National Institute for Environmental Studies, and RIKEN Center for Computational Science | MIROC | MIROC6 | 10 |
| Max Planck Institute for Meteorology | MPI-M | MPI-ESM-1-2-HAM | 2 |
| MPI-ESM1-2-HR | 10 | ||
| MPI-ESM1-2-LR | 10 | ||
| Meteorological Research Institute | MRI | MRI-ESM2-0 | 5 |
| Center for International Climate and Environmental Research, Norwegian Meteorological Institute, Nansen Environmental and Remote Sensing Center, Norwegian Institute for Air Research, University of Bergen, University of Oslo and Uni Research | NCC | NorCPM1 | 30 |
| NorESM2-LM | 3 | ||
| Seoul National University | SNU | SAM0-UNICON | 1 |
Table2. Institution name, ID, and number of ensemble members of the CMIP6 models used in this study.
The effect of anthropogenic forcing was reduced through removing the linear trend of each variable. To separate volcanically forced climate responses from the climatological mean, the monthly mean of the five years preceding the eruptions was removed. The Ni?o3.4 index used to represent El Ni?o events was calculated by the area mean over the Ni?o3.4 region (5ЁуS?5ЁуN, 170Ёу?120ЁуW). December?January?February was defined as boreal winter.
Acknowledgements. This work was primarily supported by the National Natural Science Foundation of China (Grant Nos. 41975107 and 41971108). We would like to thank Mr. Faxin CHEN for providing the photo shown in Fig. 1a. We acknowledge the World Climate Research ProgrammeЁЏs Working Group on Coupled Modelling, which is responsible for CMIP, and we thank the climate modeling groups for producing and making available their model outputs. This paper is ESMC Contribution No. 306.
