0 引言
【研究意义】冬小麦是我国主要粮食作物之一,协同实现冬小麦高产与养分资源高效是近年来国内外研究的热点。在集约化的农业生产体系中,实现作物高产需要充分的养分投入,但在实际生产中往往存在养分的不合理施用问题[1,2]。对华北平原1997—2007年的农户调研数据显示,在冬小麦生产中农民习惯施氮量大于300 kg·hm-2,远高于作物实际氮素需求(160 kg·hm-2)[3]。养分的不合理施用尤其是过量投入导致养分利用率低,进而引起了一系列的环境问题[4,5]。在高产体系中养分投入远高于作物养分需求的现象影响了人们对作物养分需求的准确理解,农民容易产生高养分投入才能实现高产的误解。因此,明确高产冬小麦的养分需求特征,对协同实现作物高产与养分资源的高效利用具有重要意义。【前人研究进展】近年来的研究报道表明,小麦的产量和养分需求关系受生长环境、基因型和养分管理等的影响[6,7,8,9,10,11]。LIU等[7]通过汇总1985—1995年全国多点的试验结果表明,生产1 t小麦籽粒的氮素、磷素和钾素需求量分别为15.1—50.5 kg(平均值25.8 kg)、2.6—6.8 kg(平均值3.7 kg)和11.5—57.5 kg(平均值23.3 kg),其中小麦籽粒产量的变化范围为0.35—8.73 t·hm-2。党红凯等[12,13,14]在高产条件下对冬小麦养分吸收特征进行了研究。但养分的不足或过量施用都会影响着作物对养分的吸收,养分供应不足时限制作物生长和养分的吸收;而养分的过量投入,则有可能导致作物对养分的奢侈吸收[15]。因此,过量养分投入条件下,作物养分需求可能会被高估,而在养分施用不足的情况下,作物的养分需求可能会被低估。过去关于在适宜养分供应条件下的养分需求特征的研究较少。为准确估计高产冬小麦的养分需求,需要明确在适宜养分供应条件下冬小麦的养分吸收量与产量的关系。【本研究切入点】前人基于特定地点或大样本数据对冬小麦氮磷钾养分需求量与产量关系进行了大量的研究,但在适宜养分投入条件下的研究和总结尚不充分。【拟解决的关键问题】通过多年多点田间试验数据构建华北地区冬小麦氮磷钾养分需求特征大数据,明确高产冬小麦氮磷钾养分需求特征及其与籽粒产量的定量关系,以期为该区高产冬小麦的实时养分管理提供理论依据和技术支撑。1 材料与方法
1.1 数据来源
1.1.1 试验点分布区域与土壤信息 氮磷钾养分需求特征数据均为华北地区多年多点农户和田间试验大样本数据,试验点分布于北京、河南、河北、山东、山西、陕西和江苏。试验点的具体信息这里不单独列出。试验点的土壤类型包括潮土、褐土、棕壤,0—30 cm土层的有机质含量为6.7—23.6 g·kg-1,全氮为0.1—1.3 g·kg-1,速效磷为2.4—49.1 mg·kg-1,速效钾为62—1 203 mg·kg-1,pH为7.7—8.4。试验包括长期定位试验、氮磷钾养分水平试验、播期播量试验和高产攻关试验等,本研究相关的试验设计包含4个处理:空白处理、氮磷钾用量优化处理、氮磷钾施用不足处理(小于优化用量处理)和氮磷钾施用过量处理(大于优化用量处理)。试验点土壤与试验设计等其他信息详见相关报道[16,17,18]。1.1.2 氮素需求特征数据收集 氮素需求特征数据为大样本数据,分为两部分:第一部分数据用来分析冬小麦氮素需求随产量变化特征,数据来源于2000—2011年本课题组及土壤-作物系统综合管理协作网的合作单位在我国北方小麦主产区开展的田间试验。具体的试验地点为北京市东北旺乡、河北省曲周县、山东省惠民县和泰安市、河南省兰考县和温县、山西省的洪洞县和永济市,数据库共包含429组数据。第二部分数据用于分析不同产量水平冬小麦干物质累积与氮素养分吸收动态特征,数据来自于2008—2012年田间试验,试验地点为河北省曲周县中国农业大学曲周实验站,共收集501组试验数据。图1和图2所有氮肥处理均为适宜施氮条件下的处理,氮肥施用总量在54—270 kg N·hm-2,数据包括了所有的施氮处理,氮肥施用总量范围为0—300 kg N·hm-2。所有试验在播种前施用了过磷酸钙(0—150 kg P2O5·hm-2)和氯化钾(0—120 kg K2O·hm-2)。氮肥形态为尿素,分别在播种前和拔节期施用。
 显示原图|下载原图ZIP|生成PPT
图1地上部需氮量与小麦产量的关系(A)和各产量水平下单位籽粒氮素需求(B)
修改自YUE等[
-->Fig. 1Relationship of above-ground N uptake (A) and winter wheat grain yield as well as N uptake per ton wheat grain (B)
Modified according YUE et al.[
-->
 显示原图|下载原图ZIP|生成PPT
图2冬小麦各产量水平下的收获指数(A)、氮收获指数(B)、籽粒氮浓度(C)和秸秆氮浓度(D)
修改自YUE等[
-->Fig. 2Harvest index (A), N harvest index (B), grain N concentration (C) and straw N concentration (D) of the optimal N treatment at maturity of winter wheat for different yield ranges.
Modified according YUE et al. (2012) [
-->
1.1.3 磷素需求特征数据收集 磷素需求特征数据为大样本数据,来自2000—2013年集中收集的1 232组农户和田间试验数据,地点为河北、河南、山东、陕西和江苏。试验点的详细资料这里不详细列出。氮肥分别在播前和拔节期施用,磷肥和钾肥全部在播种前施用,所有磷肥处理均为适宜施磷条件下的处理,施磷量从50 kg P2O5·hm-2到150 kg P2O5·hm-2。为了进一步理解不同生育时期产量和地上部生物量与磷素需求之间的关系,从试验中挑选了178组分别测定了小麦返青期(GS25)、拔节期(GS30)、扬花期(GS60)和成熟期(GS100)的生物量和地上部磷浓度。
1.1.4 钾素需求特征数据收集 钾素需求特征数据为大样本数据,来自2005—2009年收集的田间试验数据,试验地点为河北、山东、陕西和江苏共209组试验数据。试验点的详细资料这里不详细列出。所有试验点钾肥处理均为适宜施钾条件下的处理,施钾量48—150 kg K2O·hm-2。
以上试验点的种植模式为冬小麦-冬小麦,或冬小麦-玉米,或冬小麦-水稻。所有试验点均选用适宜当地种植条件的高产小麦品种,随机区组设计,每个处理重复3—4次。各试验小区面积20—300 m2不等。冬小麦在每年10月上旬到中旬播种,第二年6月中旬收获。在小麦整个生长季节内及时做好田间管理,没有明显的干旱胁迫和病虫草害发生。
1.2 试验点样品采集与分析
1.2.1 氮素需求特征数据样品处理与分析 在冬小麦越冬期(GS23)、拔节期(GS30)、扬花期(GS60)和成熟期(GS100)等关键生育时期,每个小区收割1 m2的小麦地上部植株样品,于烘箱75℃烘干至恒重,称量计算干物质累积量,然后样品粉碎,用凯氏定氮法测定植株氮浓度。成熟期收割6 m2 小麦植株,脱粒,籽粒烘干,并计算籽粒产量(含水量14%)。取部分样品粉碎,用凯氏定氮法测定植株氮素浓度。1.2.2 磷素需求特征数据样品处理与分析 分别在返青期(GS25)、拔节期(GS30)、扬花期(GS60)和成熟期(GS100)选取长势均匀、长0.5 m的两行样方。植株样品放入70℃烘箱烘干称重,取部分样品粉碎用于测定植株磷含量。成熟期收获整个小区项目植株以测定生物量和籽粒产量(含水量13%)。植株用H2SO4和H2O2消化,并用钒钼黄比色法测定磷浓度。
1.2.3 钾素需求特征数据样品处理和分析 小麦植株样品于成熟期选取长势均匀、长0.5 m的两行样方取样。地上部植株放入75℃烘箱中烘干称重以测定生物量,并测定籽粒产量(含水量13%),取部分样品粉碎用于测定植株钾含量。植株用H2SO4和H2O2消化,钾浓度使用火焰光度法(Cole-Parmer 2655-00, Vernon Hills, IL)进行测定。
1.3 数据统计与分析
地上部氮、磷、钾的需求量和籽粒产量的关系用SigmaPlot 10.0软件进行拟合绘图,干物质积累和养分吸收的动态特征由Microsoft office excel 2013进行绘图。2 结果
2.1 高产冬小麦氮素需求特征
2.1.1 冬小麦氮素需求随产量变化的特征 地上部需氮量与小麦籽粒产量呈显著的幂函数相关,地上部需氮量随籽粒产量的提高而增加,89%地上部需氮量的变化归结为籽粒产量的变化(图1-A)。为进一步明确地上部需氮量与产量的关系,将数据按产量水平分为6组(表1):<4.5 t·hm-2、4.5—6.0 t·hm-2、6.0—7.5 t·hm-2、7.5—9.0 t·hm-2、9.0—10.5 t·hm-2和>10.5 t·hm-2。收获指数平均为45.6%,各产量水平下收获指数平均分别为39.2%、43.6%、46.5%、46.4%、47.6%和48.4%,收获指数随产量的提高而增加(图2-A),各产量水平下平均氮收获指数在77.4%左右(图2-B)。籽粒氮浓度平均为21.8 g·kg-1,各产量水平的平均籽粒氮浓度分别为24.1、22.5、22.1、21.3、20.0和20.6 g·kg-1,随着产量水平的提高而降低(图2-C);平均秸秆氮浓度在产量水平<4.5 t·hm-2时为4.7 g·kg-1,产量水平>4.5 t·hm-2时则在5.3 g·kg-1左右(图2-D)。籽粒氮素需求量平均为24.3 kg·t-1,各产量水平下籽粒氮素需求量平均分别为27.1、25.0、24.5、23.8、22.7和22.5 kg·t-1,每吨籽粒氮素需求量随着产量水平的提高而降低(图1-B)。冬小麦每吨籽粒氮素需求量随产量水平增加而降低的趋势可分为3个阶段。第一阶段为从产量水平<4.5 t·hm-2到6.0—7.5 t·hm-2,该阶段内小麦产量的提高是收获指数和地上部生物量共同提高的结果。在此阶段,产量提高67.5%(由4.0 t·hm-2提高到6.7 t·hm-2),而地上部生物量提高40.4%(从8.9 t·hm-2提高到12.5 t·hm-2),收获指数提高18.6%。由于收获指数从39.2%增加到46.5%,同时籽粒氮浓度从24.1 g·kg-1降低到22.1 g·kg-1,导致籽粒氮素需求从27.1 kg·t-1降低到24.5 kg·t-1。第二阶段为产量水平从6.0—7.5 t·hm-2到9.0—10.5 t·hm-2,在此阶段收获指数稳定在47.0%,产量的提高主要是由于地上部生物量的提高。籽粒氮浓度从22.1 g·kg-1降低到20.0 g·kg-1,导致籽粒氮素需求从24.5 kg·t-1降低到22.7 kg·t-1。第三阶段为产量水平从9.0—10.5 t·hm-2到>10.5 t·hm-2,产量的提高主要是由于地上部生物量的提高,而收获指数不变。由于籽粒氮浓度没有太大变化,因此单位籽粒氮素需求也基本没有变化。以上结果表明,地上部需氮量随籽粒产量的提高而增加,但每吨籽粒氮素需求量随着产量水平的提高而降低,这种趋势主要是由收获指数和籽粒氮浓度的变化引起的。Table 1
表1
表1优化施氮处理不同产量水平下的产量数据分布[
Table 1Descriptive statistics of grain yield of the optimal N treatment at different yield ranges [
| 产量范围 Yield ranges(t·hm-2) | 样本量 n | 平均值 Mean | 标准差 SD | 最小值 Min. | 25%位点 25%Q | 中值 Med. | 75%位点 75%Q | 最大值 Max. |
|---|---|---|---|---|---|---|---|---|
| <4.5 | 24 | 4.0 | 0.4 | 3.2 | 3.9 | 4.1 | 4.3 | 4.5 |
| 4.5-6.0 | 103 | 5.3 | 0.4 | 4.5 | 5.0 | 5.3 | 5.7 | 6.0 |
| 6.0-7.5 | 147 | 6.7 | 0.4 | 6.0 | 6.3 | 6.6 | 7.0 | 7.5 |
| 7.5-9.0 | 64 | 8.1 | 0.5 | 7.5 | 7.7 | 8.1 | 8.6 | 8.9 |
| 9.0-10.5 | 66 | 9.8 | 0.4 | 9.0 | 9.6 | 9.9 | 10.2 | 10.5 |
| >10.5 | 25 | 11.0 | 0.3 | 10.5 | 10.8 | 11.1 | 11.3 | 11.8 |
| 全部All | 429 | 7.2 | 1.9 | 3.2 | 5.8 | 6.7 | 8.6 | 11.8 |
新窗口打开
2.1.2 不同产量水平冬小麦干物质累积与氮素养分吸收动态特征 图3总结了<7.0 t·hm-2,7.0—8.5 t·hm-2和>8.5 t·hm-2 3个产量水平下越冬期、拔节期、扬花期和成熟期4个关键生育时期的平均干物质累积与氮素养分吸收动态特征。从播种到拔节期之前,3个产量水平的干物质累积和氮吸收速率无明显差异(图3)。进入拔节期后,不同产量水平下的干物质累积与氮素吸收量的差异逐渐增大,拔节至扬花阶段表现出最大的干物质累积与养分吸收速率(图3)。拔节至扬花阶段,产量水平>8.5 t·hm-2时干物质累积的变化量为9.0 t·hm-2,比7.0—8.5 t·hm-2和<7.0 t·hm-2产量水平时的干物质累积的变化量分别提高26%和70%;产量水平>8.5 t·hm-2时氮素吸收变化量比7.0—8.5 t·hm-2与<7.0 t·hm-2产量水平时的氮素吸收变化量分别提高12.8%(97 vs 86 kg N·hm-2)和79.6%(97 vs 54 kg N·hm-2)(图3-B)。在成熟期,产量水平>8.5 t·hm-2时的氮素吸收总量分别比7.0—8.5 t·hm-2和<7.0 t·hm-2产量水平时的氮素吸收总量提高25.3%(238 vs 190 kg N·hm-2)和81.3%(238 vs 132 kg N·hm-2)。以上结果表明,冬小麦的干物质累积量及累积速率和氮素养分吸收量及吸收速率在拔节期之后开始显著增加,高产水平下冬小麦具有更高的养分吸收量和吸收速率。
 显示原图|下载原图ZIP|生成PPT
图3冬小麦不同产量水平的动态干物质累积(A)与氮素养分吸收(B)
GS23、GS30、GS60与GS100分别代表越冬期、拔节期、扬花期与成熟期
-->Fig. 3Changes in dry matter (A) and N accumulation (B) of winter wheat with three yield ranges.
Re-greening, stem elongation, anthesis and maturity stages are indicated by GS23, GS30, GS60, and GS100, respectively
-->
2.2 高产冬小麦磷素需求特征
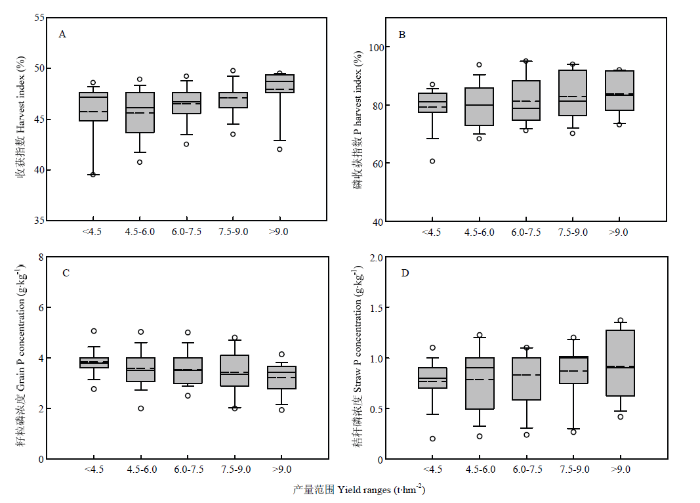
2.2.1 冬小麦磷素需求随产量变化的特征 在适宜施磷条件下,小麦籽粒产量与地上部需磷总量呈显著的幂函数相关(图4-A),地上部86%磷素总吸收量的变化归结为籽粒产量的变化。为进一步明确籽粒产量和磷素需求之间的关系,将所有数据根据产量水平分为5组:<4.5 t·hm-2(n=422,平均产量2.4 t·hm-2),4.5—6.0 t·hm-2(n=243,平均产量5.3 t·hm-2),6.0—7.5 t·hm-2(n=361,平均产量6.7 t·hm-2),7.5—9.0 t·hm-2(n=155,平均产量8.0 t·hm-2)和>9.0 t·hm-2(n=51,平均产量9.9 t·hm-2)。籽粒磷素需求量平均为4.5 kg·t-1,各产量水平下籽粒磷素需求量平均分别为4.7、4.5、4.5、4.4和4.2 kg·t-1(图4-B),每吨籽粒磷素需求量随产量水平的提高而降低,这可能是由收获指数的增加和籽粒磷浓度的降低引起的(图5-A,5-C)。5个产量水平下,收获指数从产量水平<4.5 t·hm-2时的45.7%上升到产量水平>9.0 t·hm-2时的48.3%(图5-A),籽粒磷浓度从产量水平<4.5 t·hm-2时的3.8 g·kg-1降低到产量水平>9.0 t·hm-2时的3.2 g·kg-1(图5-C),而秸秆磷浓度从产量水平<4.5 t·hm-2时的0.8 g·kg-1上升到产量水平>9.0 t·hm-2时的0.9 g·kg-1(图5-D)。上述结果表明,地上部需磷量随籽粒产量的提高而增加,但每吨籽粒磷素需求量随着产量水平的提高而降低,这种趋势主要是由收获指数的增加和籽粒磷浓度的降低引起的。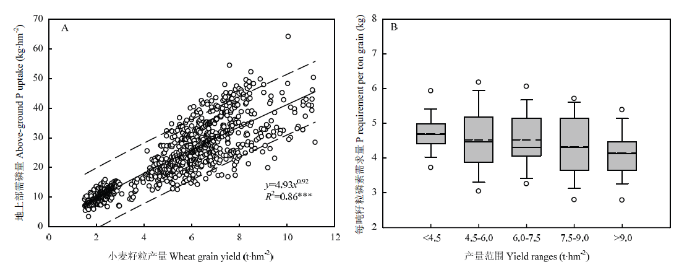 显示原图|下载原图ZIP|生成PPT
图4地上部需磷量与小麦产量的关系(A)和各产量水平下单位籽粒磷素需求(B)
修改自ZHAN等[
-->Fig. 4Relationship of above-ground P uptake (A) and winter wheat grain yield and P uptake per ton wheat grain (B)
Modified according ZHAN et al. [
-->
 显示原图|下载原图ZIP|生成PPT
图5冬小麦各产量水平下的收获指数(A)、磷收获指数(B)、籽粒磷浓度(C)和秸秆磷浓度(D)
修改自ZHAN等[
-->Fig. 5Harvest index (A), P harvest index (B), grain P concentration (C) and straw P concentration (D) of the optimal P treatment at maturity of winter wheat for different yield ranges.
Modified according ZHAN et al.[
-->
2.2.2 不同产量水平下冬小麦干物质累积与磷素养分吸收动态特征 为了探究不同产量水平下冬小麦地上部干物质累积和磷素养分吸收的动态变化特征,从适宜施磷条件下选取178组数据,根据产量水平将其分为4组:<6.0 t·hm-2(n=39), 6.0—7.5 t·hm-2(n=48),7.5—9.0 t·hm-2(n=54)和>9 t·hm-2(n=37)。在冬小麦整个生育期,产量水平>9.0 t·hm-2时的地上部干物质累积和磷素吸收均大于其他3个产量水平(图6)。从播种到返青期,地上部干物质累积在产量水平>9.0 t·hm-2时为0.9 t·hm-2,比其余3个产量水平高4.7%至75.5%。磷素吸收量在产量水平>9.0 t·hm-2时为3.4 kg·hm-2,比其余3个产量水平高6.3%—112.5%。在返青期前,地上部干物质累积量和磷素吸收量在6.0—7.5 t·hm-2、7.5—9.0 t·hm-2和>9.0 t·hm-2 3个产量水平间无明显差异,从返青期开始,地上部干物质累积量和磷吸收量在3个产量水平间开始出现差异。各产量水平在拔节至扬花阶段表现出最大的干物质累积与磷素吸收速率,在此阶段,地上部干物质累积量的变化量在7.5—9.0 t·hm-2和>9.0 t·hm-2时分别为6.2 t·hm-2和7.0 t·hm-2,磷素吸收的变化量分别为13.1和12.7 kg·hm-2。在成熟期,产量水平>9.0 t·hm-2时的干物质累积和磷素吸收量分别为18.9 t·hm-2和34.2 kg·hm-2,分别比其余3个产量水平高29.5%—100.2%和25.6%—97.7%。以上结果表明,冬小麦的干物质累积与磷素养分吸收量在返青期之后开始显著增加,高产水平下冬小麦具有更高的养分吸收量和吸收速率。
 显示原图|下载原图ZIP|生成PPT
图6冬小麦不同产量水平的动态干物质累积(A)与磷素养分吸收(B)
修改自ZHAN等[
-->Fig. 6Changes in dry matter (A) and P accumulation (B) of winter wheat for four yield ranges.
Modified according ZHAN et al.[
-->
2.3 高产冬小麦钾素需求特征
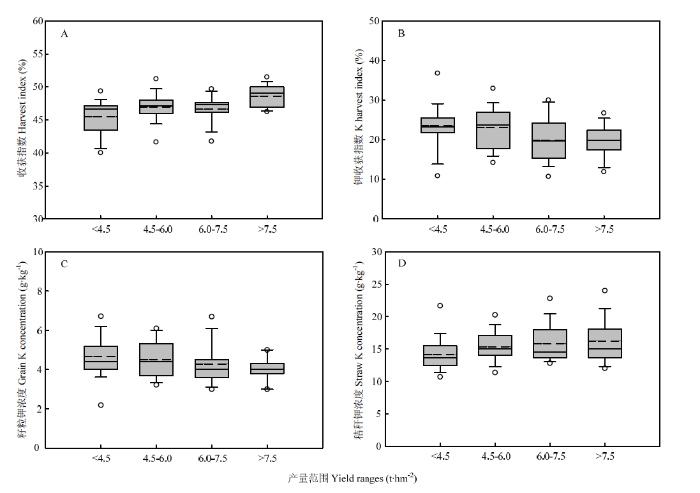
在适宜施钾条件下,小麦籽粒产量与地上部钾素总吸收量呈现出指数函数的关系(图7-A),地上部65%钾素总吸收量的变化归结为籽粒产量的变化。为明确籽粒产量和钾素需求之间的关系,将所有数据根据产量水平分为4组:<4.5 t·hm-2(n=71,平均产量3.0 t·hm-2),4.5—6.0 t·hm-2(n=42,平均产量5.4 t·hm-2),6.0—7.5 t·hm-2(n=39,平均产量6.8 t·hm-2)和>7.5 t·hm-2(n=57,平均产量8.2 t·hm-2)。籽粒钾素需求量平均为21.1 kg·t-1,各产量水平下籽粒钾素需求量的平均值分别为23.8、22.5、21.6和20.2 kg·t-1,每吨籽粒钾素需求量随产量水平的提高而降低(图7-B),这可能是由收获指数的升高和籽粒钾浓度的降低引起的(图8-A,8-C)。收获指数平均为47.0%,随着产量水平的增加,收获指数从产量水平<4.5 t·hm-2时的45.5%增加到产量水平>7.5 t·hm-2时的48.6%(图8-A)。<4.5 t·hm-2,4.5—6.0 t·hm-2,6.0—7.5 t·hm-2和>7.5 t·hm-2 4组产量水平下钾收获指数的平均值分别为23.6%、23.0%、19.8%和20.2%(图8-B);籽粒钾浓度的平均值分别为4.7、4.5、4.3和4.0 g·kg-1,籽粒钾浓度随着产量水平的提高而降低(图8-C)。然而,秸秆钾浓度随着产量水平的提高而升高, 4组产量水平下的秸秆钾浓度平均值分别为14.1、15.4、15.8和16.2 g·kg-1(图8-D)。上述结果表明,地上部需钾量随籽粒产量的提高而增加,但每吨籽粒磷素需求量随着产量水平的提高而降低,这种趋势主要是由收获指数的升高和籽粒钾浓度的降低引起的。 显示原图|下载原图ZIP|生成PPT
图7地上部需钾量与小麦产量的关系(A)和各产量水平下单位籽粒钾素需求(B)
修改自ZHAN等[
-->Fig. 7Relationship of above-ground K uptake (A) and winter wheat grain yield and K uptake per ton wheat grain (B)
Modified according ZHAN et al.[
-->
 显示原图|下载原图ZIP|生成PPT
图8冬小麦各产量水平下的收获指数(A)、钾收获指数(B)、籽粒钾浓度(C)和秸秆钾浓度(D)
修改自ZHAN等[
-->Fig. 8Harvest index (A), K harvest index (B), grain K concentration (C) and straw K concentration (D) of the optimal K treatment at maturity of winter wheat for different yield ranges.
Modified according ZHAN et al.[
-->
3 讨论
单位籽粒养分需求量是指导作物养分管理的一个重要参数。LIU等[7]统计的1985—1995年的田间试验结果显示,籽粒的氮素、磷素和钾素养分需求量分别为15.1—50.5 kg·t-1(平均值为25.8 kg·t-1)、2.6—6.8 kg·t-1(平均值为3.7 kg·t-1)和11.5—57.5 kg·t-1(平均值为23.3 kg·t-1);党红凯等[12]在2004—2006年产量范围为8.8—9.6 t·hm-2的试验结果显示,籽粒的氮素、磷素和钾素的需求量分别为26.3—31.3 kg·t-1、5.5—7.5 kg·t-1和16.6—21.6 kg·t-1;于振文等[19]对1996—1998年黄淮冬小麦区的研究结果显示,产量范围为9.5—9.8 t·hm-2的籽粒的氮素、磷素和钾素的需求量分别为23.7—29.3 kg·t-1、4.1—4.3 kg·t-1和24.0—27.3 kg·t-1,而在产量范围6.3—7.8 t·hm-2报道的籽粒的氮素、磷素和钾素的需求量分别为28.5—34.0 kg·t-1、4.6—4.9 kg·t-1和24.2—25.3 kg·t-1。在本研究中,基于华北地区适宜施氮、施磷和施钾条件下的平均产量分别为7.2、5.2和5.6 t·hm-2,生产籽粒的氮素、磷素和钾素的需求量的变化范围为22.5—27.1 kg·t-1(平均值24.3 kg·t-1)、4.2—4.7 kg·t-1(平均值4.5 kg·t-1)和20.2—23.8 kg·t-1(平均值21.1 kg·t-1)。本研究结果在范围上与上述研究是较为一致的,不同结果的差异可能是由于品种、田间管理、研究区域等的不同造成的[7,19-21]。例如,于振文等[19]和潘庆民等[20]的研究结果表明,产量潜力为9.0 t·hm-2的小麦品种比产量潜力为7.5 t·hm-2的品种具有更高的氮素生产力。LIU等[21]的研究表明,在华北、长江中下游和西北3个麦区,每吨籽粒氮素、磷素和钾素需求量均有一定的差异。本研究表明,华北地区冬小麦每吨籽粒的氮素、磷素和钾素的需求量随着产量的增加而降低,党红凯等[13]和于振文等[19]的研究结果也表现出类似的趋势。但是,也有研究[22,23]显示,随着冬小麦产量的增加每吨籽粒养分需求量呈现出上升的趋势。串丽敏[22]的研究表明,随着产量的增加,冬小麦每吨籽粒的氮素、磷素和钾素的需求量均表现出上升的趋势,车升国等[23]对我国2000年以后不同区域的大量田间试验数据进行了总结分析,结果表明冬小麦单位籽粒需磷量随着产量范围的增加而升高,上述结果与本研究的结果不同。出现这种差异的原因可能是随着产量的增加,养分的吸收利用效率发生变化和小麦植株内的养分在不同器官间的转移分配不同造成的。例如,在车升国等[23]的研究中,随着小麦产量的增加,小麦籽粒磷浓度基本维持在3.1 g·kg-1左右,但是秸秆磷浓度却从0.5 g·kg-1增加到1.2 g·kg-1,每吨籽粒增加的磷素需求量主要是源于秸秆磷浓度的增加。但本研究中,随着产量的增加,籽粒磷浓度从3.8 g·kg-1降低到3.2 g·kg-1,但是秸秆磷浓度仅从0.8 g·kg-1增加到了0.9 g·kg-1。许多研究[9,24-26]表明,品种、水肥管理、栽培措施等都会对小麦的养分吸收与分配产生影响,另外,研究的区域、年代和气候条件等的不同,可能最终导致了不同研究间的差异。
拔节-开花阶段是小麦生长和调控的重要阶段[27],该阶段是小麦干物质累积速率和养分吸收速率最快的阶段,也是决定小麦产量的重要时期[28,29]。YE等[30]的研究表明高产小麦品种的生物量与养分吸收的差异主要出现在拔节期以后,表明该阶段养分管理的重要性。本研究表明干物质累积和氮磷养分吸收速率在此阶段达到最大。党红凯等[14]的研究显示,高产冬小麦钾素的最大吸收速率也在拔节至开花阶段达到峰值。拔节期后,部分分蘖开始消亡,养分需求随着有效茎蘖的快速增长而迅速增加,植株内部穗与茎对养分的竞争增加,此阶段养分资源在各器官的累积与分配显著影响小麦的产量,进而决定了最终产量的高低[31,32]。本研究通过不同产量水平下的干物质累积和养分吸收特征的比较,表明在此阶段高产水平下的冬小麦展现出高的干物质累积与养分需求。因此,在拔节至扬花阶段保证充足的氮磷钾养分供应是实现冬小麦高产的重要措施。
本文在探究华北地区冬小麦养分需求特征时,选择分别在适宜供氮、供磷和供钾的条件下的试验数据进行研究,尽量消除因氮素、磷、钾养分供应不足或过量对作物养分吸收造成的影响。但在实际生产中,作物的生长环境受到水分和土壤性状、气候因素以及管理的综合制约。大样本数据下的结果为华北地区冬小麦的精准养分管理提供了参考,但在生产中仍要根据当地生产情况做出适当调整。
4 结论
适宜施氮、施磷和施钾条件下,冬小麦对氮素、磷素和钾素的需求量与籽粒产量之间存在着显著的相关关系,随着产量水平的提高,华北地区冬小麦氮、磷、钾需求量增加,但单位籽粒氮、磷、钾养分需求量下降,这种趋势主要是由收获指数的升高和籽粒氮、磷、钾浓度的降低造成的。这意味着高产条件下,冬小麦的氮、磷、钾养分的需求并不随产量的提高而等比例增加,这为华北地区高产冬小麦养分管理提供了理论基础。拔节至扬花阶段是冬小麦干物质累积和养分吸收速率最大的阶段,对于不同产量水平的冬小麦,高产水平下冬小麦具有较高的干物质累积和养分吸收速率。The authors have declared that no competing interests exist.
参考文献 原文顺序
文献年度倒序
文中引用次数倒序
被引期刊影响因子
| [1] | . China and other rapidly developing economies face the dual challenge of substantially increasing yields of cereal grains while at the same time reducing the very substantial environmental impacts of intensive agriculture. We used a model-driven integrated soil-crop system management approach to develop a maize production system that achieved mean maize yields of 13.0 t ha6301 on 66 on-farm experimental plots—nearly twice the yield of current farmers' practices—with no increase in N fertilizer use. Such integrated soil-crop system management systems represent a priority for agricultural research and implementation, especially in rapidly growing economies. |
| [2] | [D]. [D]. |
| [3] | . During the first 35 years of the Green Revolution, Chinese grain production doubled, greatly reducing food shortage, but at a high environmental cost. In 2005, China alone accounted for around 38% of the global N fertilizer consumption, but the average on-farm N recovery efficiency for the intensive wheat-maize system was only 16-18%. Current on-farm N use efficiency (NUE) is much lower than in research trials or on-farm in other parts of the world, which is attributed to the overuse of chemical N fertilizer, ignorance of the contribution of N from the environment and the soil, poor synchrony between crop N demand and N supply, failure to bring crop yield potential into full play, and an inability to effectively inhibit N losses. Based on such analyses, some measures to drastically improve NUE in China are suggested, such as managing various N sources to limit the total applied N, spatially and temporally matching rhizospheric N supply with N demand in high-yielding crops, reducing N losses, and simultaneously achieving high-yield and high NUE. Maximizing crop yields using a minimum of N inputs requires an integrated, interdisciplinary cooperation and major scientific and practical breakthroughs involving plant nutrition, soil science, agronomy, and breeding. |
| [4] | . Soil acidification is a major problem in soils of intensive Chinese agricultural systems. We used two nationwide surveys, paired comparisons in numerous individual sites, and several long-term monitoring-field data sets to evaluate changes in soil acidity. Soil pH declined significantly (P < 0.001) from the 1980s to the 2000s in the major Chinese crop-production areas. Processes related to nitrogen cycling released 20 to 221 kilomoles of hydrogen ion (H62) per hectare per year, and base cations uptake contributed a further 15 to 20 kilomoles of H62 per hectare per year to soil acidification in four widespread cropping systems. In comparison, acid deposition (0.4 to 2.0 kilomoles of H62 per hectare per year) made a small contribution to the acidification of agricultural soils across China. |
| [5] | . Nitrogen (N) deposition is an important component in the global N cycle that has induced large impacts on the health and services of terrestrial and aquatic ecosystems worldwide. Anthropogenic reactive N (Nr) emissions to the atmosphere have increased dramatically in China due to rapid agricultural, industrial and urban development. Therefore increasing N deposition in China and its ecological impacts are of great concern since the 1980s. This paper synthesizes the data from various published papers to assess the status of the anthropogenic Nr emissions and N deposition as well as their impacts on different ecosystems, including empirical critical loads for different ecosystems. Research challenges and policy implications on atmospheric N pollution and deposition are also discussed. China urgently needs to establish national networks for N deposition monitoring and cross-site N addition experiments in grasslands, forests and aquatic ecosystems. Critical loads and modeling tools will be further used in Nr regulation. |
| [6] | . 研究分层供水条件下施磷对冬小麦产量和氮、磷、钾养分吸收及其在不同器官分配的影响,为指导旱地施磷提供一定理论和实践依据.以土垫旱耕人为土为供试土壤,进行土柱模拟试验,研究分层供水施磷对冬小麦产量和氮、磷、钾养分吸收及其在不同器官分配的影响.试验设不施磷和施磷于0~30 cm和30~60 cm土层3种处理,每个施磷水平下设整体湿润和上干下湿(0~30 cm土层干旱胁迫,30~60 cm土层湿润)2种水分处理.不同土层水磷处理显著影响冬小麦产量和磷、氮、钾养分吸收及其在不同器官分配.结果表明,与整体湿润处理相比,上干下湿水分处理下冬小麦产量和籽粒氮、磷、钾累积量及分配率均显著增加(P<0.05),其他营养器官养分累积量及分配率则差异不显著.磷肥施用深度对冬小麦产量和不同器官氮、磷、钾养分累积量和分配率的影响与不同土层的土壤水分状况有关.整体湿润条件下,与磷肥表施处理相比,磷肥深施处理产量显著降低(P<0.05),减产7.49%,上干下湿水分条件下,则相反,增产11.2%(P<0.05);整体湿润条件下,与磷肥表施处理处理相比,磷肥深施处理显著降低叶片+茎鞘氮、磷、钾累积量(P<0.05),对分配率的影响差异均不显著,上干下湿水分处理下,与磷肥表施处理相比,磷肥深施处理籽粒氮、磷、钾累积量及分配率均显著增加(P<0.05).本模拟试验结果表明,土壤水分供应不足时,磷肥深施提高冬小麦籽粒氮、磷、钾养分累积量及分配率,促进光合产物向穗部转移,从而有利于形成高产. . 研究分层供水条件下施磷对冬小麦产量和氮、磷、钾养分吸收及其在不同器官分配的影响,为指导旱地施磷提供一定理论和实践依据.以土垫旱耕人为土为供试土壤,进行土柱模拟试验,研究分层供水施磷对冬小麦产量和氮、磷、钾养分吸收及其在不同器官分配的影响.试验设不施磷和施磷于0~30 cm和30~60 cm土层3种处理,每个施磷水平下设整体湿润和上干下湿(0~30 cm土层干旱胁迫,30~60 cm土层湿润)2种水分处理.不同土层水磷处理显著影响冬小麦产量和磷、氮、钾养分吸收及其在不同器官分配.结果表明,与整体湿润处理相比,上干下湿水分处理下冬小麦产量和籽粒氮、磷、钾累积量及分配率均显著增加(P<0.05),其他营养器官养分累积量及分配率则差异不显著.磷肥施用深度对冬小麦产量和不同器官氮、磷、钾养分累积量和分配率的影响与不同土层的土壤水分状况有关.整体湿润条件下,与磷肥表施处理相比,磷肥深施处理产量显著降低(P<0.05),减产7.49%,上干下湿水分条件下,则相反,增产11.2%(P<0.05);整体湿润条件下,与磷肥表施处理处理相比,磷肥深施处理显著降低叶片+茎鞘氮、磷、钾累积量(P<0.05),对分配率的影响差异均不显著,上干下湿水分处理下,与磷肥表施处理相比,磷肥深施处理籽粒氮、磷、钾累积量及分配率均显著增加(P<0.05).本模拟试验结果表明,土壤水分供应不足时,磷肥深施提高冬小麦籽粒氮、磷、钾养分累积量及分配率,促进光合产物向穗部转移,从而有利于形成高产. |
| [7] | . Wheat and maize are two major food crops in China. Conventional fertilizer recommendations result in higher than necessary costs to farmers and increased environmental pollution. It is essential to quantitatively estimate optimal fertilizer requirements to alleviate the problems of the two crops in China. The QUEFTS (QUantitative Evaluation of the Fertility of Tropical Soils) model was used to estimate region-specific nitrogen (N), phosphorus (P) and potassium (K) requirements as well as fertilizer applications needed to realize target yields of wheat and maize. Data of field experiments with different fertilization treatments of various regions in China during the years of 1985–1995 were used to calibrate the QUEFTS model for both wheat and maize. Minimum and maximum internal nutrient efficiencies (kg grain kg 611 ) for the model were estimated at N (25 and 56), P (171 and 367), K (24 and 67) for wheat, and N (21 and 64), P (126 and 384), K (20 and 90) for maize. The model suggested a linear increase of grain yields for scenarios with nutrient contents of 24.6, 3.7 and 23.002kg N, P and K per 100002kg of wheat grain and 25.8, 4.3 and 23.102kg N, P and K per 100002kg of maize grain. These results suggest that the average N: P: K ratio in the plant dry matter is about 6.7: 1: 6.2 for wheat and 6.0: 1: 5.4 for maize. Relationships between internal N, P and K levels and soil properties were established and relationships between the recovery efficiencies of applied fertilizer – N, P and K were found. Running the calibrated QUEFTS model with observed field data produced a good fit between predicted and observed data. It was concluded that the calibrated QUEFTS model could be a useful tool for improving fertilizer recommendations for wheat and maize in China. |
| [8] | . ABSTRACT Durum wheat (Triticum durum Desf.) is widely cultivated in the Mediterranean area where plants generally suffer from waterstress during grain-filling period. This study was conducted to evaluate the influence of N levels and water regimes on N translocation and nitrogen use efficiency for protein (NUEP) in durum wheat grown under Mediterranean conditions. A 2-yr experiment was performed in southern Italy using four cultivars, two water regimes (irrigated and rainfed) and three N levels (0, 60, and 120 kg ha鈥1). Among the cultivars under study, Simeto showed the highest N translocation in both years and, together with Ofanto, also the highest NUEP values, especially in rainfed condition. This highlights their good adaptability to dry southern Italy environment. Nitrogen fertilization caused a general decrease of NUEP and its components in both growing seasons; this was more evident in the first drier year, mainly due to a decrease in N uptake. Under water stress the higher N level caused a decrease in N translocation, N translocation efficiency, and grain N content. The contribution of translocated N to grain N content was 75% in the wetter year and 57% in the drier year, showing that in drought condition preanthesis N assimilation was lower. In conclusion under water stress condition the higher N level (120 kg ha鈥1), despite determining an increase in plant N content, did not imply an increase in grain N content, due to a decrease in N translocation and efficiency. |
| [9] | . The inappropriate application of fertilizer has become a common phenomenon in wheat production systems in China and has led to nutrient imbalances, inefficient use and large losses to the environment. However, defining an appropriate fertilization rate remains the foundation to science-based nutrient management. This paper described a new fertilizer recommendation method for wheat in China based on yield response and agronomic efficiency using datasets from 2000 to 2011. The results showed that the mean yield responses of wheat to N. P and K were 1.7, 1.0 and 0.8 t/ha, respectively. Nitrogen was the nutrient most limiting yield, followed by P and then K. The soil indigenous nutrient supplies were 122.6 kg N/ha, 38.0 kg P/ha, and 120.2 kg K/ha. The mean agronomic efficiencies were 9.4, 10.2 and 6.5 kg/kg for N, P and K, respectively. There was a significant negative exponential relationship between yield response and indigenous nutrient supply, and a significant negative linear correlation between yield response and relative yield. It was also demonstrated a quadratic equation between yield response (x) and agronomic efficiency (y) (P < 0.05). The relationship between yield response (x) and agronomic efficiency (y) for N was y(N) = 0.3729x(N)(2) + 6.1333x(N) + 0.1438 (R-2 = 0.76, n = 601), for P was y(p) = 0.5013x(p)(2) + 8.3209x(p) + 2.3907 (R-2 = 0.65, n = 288), and for K was y(K) = 1.6581x(K)(2) + 9.099x(K) +0.7668 (R-2 = 0.58, n = 379). These equations were all incorporated as part of the Nutrient Expert for Wheat fertilizer recommendation decision support system. The results of multiple field experiments helped to validate the feasibility of the recommendation model and concluded that Nutrient Expert for Wheat could be used as an alternative method to make fertilizer recommendations in China. (C) 2012 Elsevier B.V. All rights reserved. |
| [10] | . Overapplication of N and P and insufficient supply of K are considered primary reasons for restriction of yield improvement in the North China Plain. Optimized nutrient management practices based on soil testing and yield targets have been developed. Other large scale field experiments have indicated that additional improvement for yield and nutrient use benefits is needed. The objective of this study was to evaluate the effects of the optimized nutrient management system on yield, nutrient uptake, nutrient utilization, and profit in the North China provinces of Shanxi, Hebei, Shandong, and Henan. Treatments consisted of a check without fertilizer use (CK); a balanced, optimum nutrient application (OPT); the farmers' practice (FP); and a series of nutrient omission treatments (minus N, P, and K, respectively). The results indicated that the OPT optimized grain yield, nutrient use efficiency, and profitability. Maize (Zea mays L.) yield increased by 12.2% at Shanxi and 18.5% at Hebei, respectively. Inputs ofN and P across the wheat (Triticum aestivum L.) and maize system at the four sites was reduced by 13% (266 kg N ha |
| [11] | . Sustainable potassium (K) management at different soil sites requires understanding the relationships between crop productivity and long-term K fertilizations on a regional or national scale. We analyzed responses of grain yield of wheat ( or maize at 3-6 t ha, 13-26 or 9-17 kg K ha were required to produce 1.0 t wheat or maize. The NP fertilization resulted in the lowest negative partial K balance and accumulated 52 kg K ha year less than the NPK fertilization, which accumulated 28 kg ha year less K than the NPKM fertilization. A re-evaluation of the site-specific fertilization effects on N/K ratio in crop plants and soil K accumulation under current NPK and NPKM fertilization is urgently needed to increase both crop yield and K use efficiency at different agroecological zones across China. |
| [12] | . <p>为明确超高产(9000 kg/hm<sup>2</sup>左右)栽培条件下冬小麦的氮素营养特点,于2004~2005年、2005~2006年2个小麦生长季主要生育时期,取样分析小麦各器官氮的含量,总结出超高产冬小麦氮素的吸收、积累和分配特点。结果表明, 小麦全生育期各器官的氮含量为0.22%~3.55%(干重)。生育前期叶片中氮的含量和积累量最高,生育后期籽粒中氮的含量和积累量最高。小麦生育期间氮的总积累量为232.48~285.18 kg/hm<sup>2</sup>,每生产100 kg籽粒吸收氮2.63~3.13 kg。小麦吸收的氮孕穗期前主要分配在叶片中,一般都在50%以上, 成熟期氮在籽粒中的分配率最高,各品种均在80%以上。成熟期籽粒中积累的氮68.02%~73.31% 来自营养器官中氮的再分配。出苗到起身期、拔节到孕穗期、开花到成熟期都是小麦氮素吸收的重要阶段。根据小麦的氮素吸收积累特点,河北平原冬小麦实现9000 kg/hm<sup>2</sup>的超高产,需要土壤全氮不低于0.75 g/kg,秸秆全量还田后施N 260 kg/hm<sup>2</sup>左右。</p> . <p>为明确超高产(9000 kg/hm<sup>2</sup>左右)栽培条件下冬小麦的氮素营养特点,于2004~2005年、2005~2006年2个小麦生长季主要生育时期,取样分析小麦各器官氮的含量,总结出超高产冬小麦氮素的吸收、积累和分配特点。结果表明, 小麦全生育期各器官的氮含量为0.22%~3.55%(干重)。生育前期叶片中氮的含量和积累量最高,生育后期籽粒中氮的含量和积累量最高。小麦生育期间氮的总积累量为232.48~285.18 kg/hm<sup>2</sup>,每生产100 kg籽粒吸收氮2.63~3.13 kg。小麦吸收的氮孕穗期前主要分配在叶片中,一般都在50%以上, 成熟期氮在籽粒中的分配率最高,各品种均在80%以上。成熟期籽粒中积累的氮68.02%~73.31% 来自营养器官中氮的再分配。出苗到起身期、拔节到孕穗期、开花到成熟期都是小麦氮素吸收的重要阶段。根据小麦的氮素吸收积累特点,河北平原冬小麦实现9000 kg/hm<sup>2</sup>的超高产,需要土壤全氮不低于0.75 g/kg,秸秆全量还田后施N 260 kg/hm<sup>2</sup>左右。</p> |
| [13] | . 为明确超高产栽培条件下(≥9000 kg/hm<sup>2</sup>)冬小麦的磷素营养规律,为合理施肥提供研究依据,于20042006年冬小麦生长期间,通过田间取样,分器官测定磷素含量,研究了超高产冬小麦对磷的吸收、积累和分配特点。结果表明:在产量水平为9000 kg/hm<sup>2</sup>左右的条件下,不同品种各器官中的含磷量及全生育期中磷的总积累量存在一定差异,但一般不显著,显示出不同品种磷素营养特点的共性特征。地上部不同器官的含磷量(P<sub>2</sub>O<sub>5</sub>,下同)为0.25%~2.32%(干重)。不同生育时期含磷量最高的器官随生育进程逐渐更替,生育早期为叶鞘,中期为茎秆和穗,后期为籽粒。不同品种小麦各器官对磷的积累量,生育前期一般以叶片中最高,生育后期以籽粒中最高。小麦吸收的磷在孕穗期前主要分配在叶片中,多数品种在50%以上。成熟期磷在籽粒中的分配率最高,各品种均达到60%以上。在本研究的超高产栽培条件和产量水平下,冬小麦全生育期地上部器官中磷的最高积累量为110.8~151.4 kg/hm<sup>2</sup>,每生产100 kg籽粒吸收磷素1.25~1.66 kg。各品种对磷吸收量最高的阶段,一般都在起身到开花期之间,其次是在冬前的苗期。这表明,冬前和起身到开花期是冬小麦吸收磷的关键时期。根据上述磷的吸收积累特点,在确定施肥方案时,磷肥应以底肥为主,以促进小麦生长和对磷的吸收。 . 为明确超高产栽培条件下(≥9000 kg/hm<sup>2</sup>)冬小麦的磷素营养规律,为合理施肥提供研究依据,于20042006年冬小麦生长期间,通过田间取样,分器官测定磷素含量,研究了超高产冬小麦对磷的吸收、积累和分配特点。结果表明:在产量水平为9000 kg/hm<sup>2</sup>左右的条件下,不同品种各器官中的含磷量及全生育期中磷的总积累量存在一定差异,但一般不显著,显示出不同品种磷素营养特点的共性特征。地上部不同器官的含磷量(P<sub>2</sub>O<sub>5</sub>,下同)为0.25%~2.32%(干重)。不同生育时期含磷量最高的器官随生育进程逐渐更替,生育早期为叶鞘,中期为茎秆和穗,后期为籽粒。不同品种小麦各器官对磷的积累量,生育前期一般以叶片中最高,生育后期以籽粒中最高。小麦吸收的磷在孕穗期前主要分配在叶片中,多数品种在50%以上。成熟期磷在籽粒中的分配率最高,各品种均达到60%以上。在本研究的超高产栽培条件和产量水平下,冬小麦全生育期地上部器官中磷的最高积累量为110.8~151.4 kg/hm<sup>2</sup>,每生产100 kg籽粒吸收磷素1.25~1.66 kg。各品种对磷吸收量最高的阶段,一般都在起身到开花期之间,其次是在冬前的苗期。这表明,冬前和起身到开花期是冬小麦吸收磷的关键时期。根据上述磷的吸收积累特点,在确定施肥方案时,磷肥应以底肥为主,以促进小麦生长和对磷的吸收。 |
| [14] | . <p>为明确超高产(9000 kg/hm2左右)冬小麦的钾营养特点和为确定施钾技术提供理论依据, 20042005年、 20052006年通过田间试验在2个小麦生长季分别种植4个品种,在小麦生长的各生育时期取植株样品,分析不同器官钾的浓度。结果表明,小麦全生育期地上部不同器官中钾(K<sub>2</sub>O)浓度为0.21%~3.84%(干重)。各器官均是在形成初期或早期含钾量最高,之后直到成熟期都在不同程度地下降。各生育时期钾浓度最高的器官随生长中心转移而更替。在所有器官中,开花前叶片中钾的积累量和分配率最高,其中拔节前钾在叶片中的分配率达50%或以上; 开花后茎秆中钾的积累量和分配率最高,成熟期钾在茎秆中的分配率达35.6%~45.3%。同一年份不同品种各器官的钾浓度及全生育期钾的总积累量有一定差异,但差异不显著,表明产量在9000 kg/hm<sup>2</sup>左右的不同品种具有相似的钾素营养特性。小麦植株对钾的总积累量在开花期达到最高值为181.7~230.7 kg/hm<sup>2</sup>,每生产100 kg籽粒需吸收钾2.0~2.6 kg,钾生产效率为35.36~55.58 kg/kg。小麦对钾的吸收以生育中期(起身至开花)最高,前期(出苗至起身)次之,后期(开花至成熟)为负积累。根据本研究小麦钾素的营养特点,在小麦秸秆还田基础上,9000 kg/hm<sup>2</sup>左右超高产小麦的钾肥施用量应不低于K<sub>2</sub>O 90 kg/hm<sup>2</sup>。</p> . <p>为明确超高产(9000 kg/hm2左右)冬小麦的钾营养特点和为确定施钾技术提供理论依据, 20042005年、 20052006年通过田间试验在2个小麦生长季分别种植4个品种,在小麦生长的各生育时期取植株样品,分析不同器官钾的浓度。结果表明,小麦全生育期地上部不同器官中钾(K<sub>2</sub>O)浓度为0.21%~3.84%(干重)。各器官均是在形成初期或早期含钾量最高,之后直到成熟期都在不同程度地下降。各生育时期钾浓度最高的器官随生长中心转移而更替。在所有器官中,开花前叶片中钾的积累量和分配率最高,其中拔节前钾在叶片中的分配率达50%或以上; 开花后茎秆中钾的积累量和分配率最高,成熟期钾在茎秆中的分配率达35.6%~45.3%。同一年份不同品种各器官的钾浓度及全生育期钾的总积累量有一定差异,但差异不显著,表明产量在9000 kg/hm<sup>2</sup>左右的不同品种具有相似的钾素营养特性。小麦植株对钾的总积累量在开花期达到最高值为181.7~230.7 kg/hm<sup>2</sup>,每生产100 kg籽粒需吸收钾2.0~2.6 kg,钾生产效率为35.36~55.58 kg/kg。小麦对钾的吸收以生育中期(起身至开花)最高,前期(出苗至起身)次之,后期(开花至成熟)为负积累。根据本研究小麦钾素的营养特点,在小麦秸秆还田基础上,9000 kg/hm<sup>2</sup>左右超高产小麦的钾肥施用量应不低于K<sub>2</sub>O 90 kg/hm<sup>2</sup>。</p> |
| [15] | . Abstract Available soil N and a cultivar's genetic potential are primary factors determining grain protein concentration (GPC). This study focused on important genotypic and environmental factors that determine GPC and yield potential in common wheat (Triticum aestivum L.) and investigated the use of GPC as a practical indicator of crop N deficiencies for a wide range of cultivars grown in 16 N fertilizer trials in western Canada. Large GPC responses to added N were accompanied by large increases in grain yield, and similar GPC-grain yield relationships were found at maximum grain yield and 90 and 80% of maximum grain yield. Both genotype and environment influenced the upper limit of yield when N was not limiting. The relationship between GPC and grain yield depended on the part of the N fertilizer response curve sampled, and there was a strong negative correlation between cultivar GPC and maximum potential grain yield. The latter observation indicates that the production of high-yielding cultivars with high GPC is more complicated than simply stacking yield genes in a high-GPC genetic background or vice versa. Large differences amongst cultivars also suggested that the critical GPC-grain yield responses must be known for each cultivar before GPC can be used as a practical postharvest indicator of N sufficiency. Growing season weather had a large influence on GPC-grain yield relationships, and GPC at the point of maximum grain yield increased as the potential grain yield of a cultivar was reduced by environmental limitations. These observations indicate that GPC may be a useful postharvest indicator of N deficiencies for crops that are under N stress, but caution must be used when employing GPC to develop management systems that optimize N fertilizer use. |
| [16] | . Abstract Overestimates of N requirements have led to excessive N application and serious environmental pollution in intensively managed agricultural systems. A database comprising 1395 measurements was developed from 2000 to 2011 using 88 on-farm and station experiments conducted in five key winter wheat (Triticum aestivum L.) domains in northern China. The database was created to evaluate the relationship between aboveground N uptake and grain yield with different N treatments and to quantify N requirements per Mg grain at different grain yield levels. Across all sites, wheat grain yield ranged from 1.6 to 11.8 Mg ha(-1). The nitrogen requirement per megagram grain yield (N-req.) increased with N supply from 20.8 kg under the treatment without N fertilizer to 25.7 kg under the excess N treatment. For the optimal N fertilizer treatment, the average N-req. was 24.3 kg and it declined with increasing grain yield. For the yield ranges between 10.5 Mg ha(-1), N-req. changed little due to stability in grain N concentrations and HI. In conclusion, the N requirement of a crop was affected by both the amount of N supplied and the grain yield. |
| [17] | . Abstract Overestimation of the P requirement has been a driving force in the overuse of P fertilization in intensively managed agricultural systems and the resulting extensive environmental pollution. A database comprising 2157 measurements was developed from 2000 to 2013 using 45 on-farm and station trials to evaluate the relationship between aboveground P uptake and grain yield with different P fertilizer (Pf) treatments and to quantify P requirements per megagram of grain at different grain yield levels. Winter wheat (Triticum aestivum L.) yield ranged from 0.9 to 11.7 Mg ha-1. The P requirement per megagram of grain yield (Preq) increased with Pf supply from 4.1 kg under the treatment without Pf to 4.8 kg under the Pf surplus treatment. These results imply that excessive P application generally does not lead to greater P use efficiency and poses a potential environmental threat. Under the optimal Pf (Pf = Opt) treatment, the average Preq was 4.5 kg, and it declined from 4.7 kg in the yield range of 9 Mg ha-1 due to the increasing harvest index (from 45.7 to 48.2%) and the diluting effect of declining grain P concentrations (from 3.8 to 3.2 g kg-1). The largest variation in shoot biomass and P accumulation under Pf = Opt treatment occurred from the stem elongation to anthesis growth stages, suggesting that, in addition to Pf supply, crop management during the early growth season is also important for achieving higher yields. 漏 2015 by the American Society of Agronomy 5585 Guilford Road, Madison, WI 53711 USA All rights reserved. |
| [18] | . |
| [19] | . 根据黄淮麦区的生态特点, 研究了冬小麦超高产(hm2产9000 kg籽粒)栽培的理论与技术. 结果指出, 于土肥水条件良好的高产麦田, 在建立合理群体结构的基础上, 小麦开花至成熟阶段的干物质积累和分配与植株生育后期早衰的矛盾, 是高产(hm2产6000~7500 kg籽粒)向超高产发展的主要限制因素. 揭示了高产条件下小麦的衰老规律, 划分 . 根据黄淮麦区的生态特点, 研究了冬小麦超高产(hm2产9000 kg籽粒)栽培的理论与技术. 结果指出, 于土肥水条件良好的高产麦田, 在建立合理群体结构的基础上, 小麦开花至成熟阶段的干物质积累和分配与植株生育后期早衰的矛盾, 是高产(hm2产6000~7500 kg籽粒)向超高产发展的主要限制因素. 揭示了高产条件下小麦的衰老规律, 划分 |
| [20] | . 与7500 kg/hm2小麦相比较,9000kg/hm2小麦氮素吸收量和氮素生产力显著提高,开花后吸氮强度显著提高;开花期叶片氮素分配量增加但分配比例降低,穗和根系的氮素分配量和分配比例均提高;成熟期籽粒的氮素分配量和分配比例均提高;开花后营养器官的氮素向籽粒转移量增加但转移率差异不显著;籽粒品质改善。 . 与7500 kg/hm2小麦相比较,9000kg/hm2小麦氮素吸收量和氮素生产力显著提高,开花后吸氮强度显著提高;开花期叶片氮素分配量增加但分配比例降低,穗和根系的氮素分配量和分配比例均提高;成熟期籽粒的氮素分配量和分配比例均提高;开花后营养器官的氮素向籽粒转移量增加但转移率差异不显著;籽粒品质改善。 |
| [21] | . Abstract Great advances in food production have been made in China, but the continuous increase of nutrient inputs has caused a series of environmental problems. Nutrient management for crops must be improved. Yield gaps, indigenous nutrient supplies, and nutrient use efficiencies (NUEs) must be assessed to design management strategies for further yield increase. In this study, data from 1022 field experiments with wheat (Triticum aestivum L.) conducted between 2000 and 2008 in north central China, the middle and lower reaches of the Yangtze River, and northwest China were analyzed. Treatments in these experiments consisted of a check without fertilizer use, an optimum nutrient application, the farmers' practice, and a series of nutrient omission treatments. The results showed that gaps between attainable yields and yields in experimental plots with farmers' practices averaged 0.76 Mg ha(-1). Indigenous nutrient supplies of N, P, and K averaged 133.0, 30.2, and 131.7 kg ha(-1), respectively, in the regions studied. On a national scale and under optimum fertilization, agronomic efficiency of N, P, and K were 9.8, 19.2, and 7.2 kg kg(-1), while recovery efficiencies were 37.9, 19.0, and 27.0%, respectively. Compared with values obtained 10 yr previous, agronomic efficiencies and recovery efficiencies determined between 2000 and 2008 were lower but also lower than world averages. Successive inputs of large amounts of nutrients significantly increased the indigenous nutrient supply and therefore are contributing to lower NUE because recommendations for N, P, and K have not been adjusted downward in China. |
| [22] | [D]. [D]. |
| [23] | . 【目的】掌握小麦磷素的吸收特征及区域差异性有利于指导小麦合理施肥,提高磷肥肥效,维持小麦增产稳产。本文旨在探讨我国小麦磷素吸收特征的区域差异性及对产量的响应。【方法】本文收集了2000年后我国黄淮海冬麦区、西北冬春兼播麦区和长江中下游麦区小麦田间试验的文献数据,统计分析了小麦产量、地上部磷吸收、籽粒磷含量、秸秆磷含量、100 kg籽粒需磷量等参数的区域异质性,并计算了小麦不同产量水平下100 kg籽粒需磷量、籽粒磷含量和秸秆磷含量的变化特征。【结果】我国田间试验的小麦平均产量为6.18 t/hm-2(n=5424),变异系数为33.1%;籽粒、秸秆磷含量全国平均分别为0.32%(n=1072)、0.08%(n=864),变异系数分别为34.3%、75.0%;地上部、籽粒和秸秆吸磷量全国平均分别为26.4 kg/hm-2(n=1370)、17.0 kg/hm-2(n=679)、5.4kg/hm-2(n=650),变异系数分别为58.6%、55.1%、94.8%。除籽粒磷含量外,小麦产量、地上部磷吸收量、籽粒磷吸收量、秸秆磷吸收量和秸秆磷含量均以黄淮海麦区最高,长江中下游冬麦区次之,西北冬春麦区最低。生产100 kg籽粒需磷量全国平均为0.46 kg(n=1546),变异系数37.0%,其中以黄淮海冬麦区最高,为0.50 kg(n=813),长江中下游冬麦区和西北冬春麦区分别为0.44 kg(n=195)和0.41 kg(n=538)。随小麦产量水平的提高,生产100 kg小麦籽粒需磷量呈增加趋势,〈4.50 t/hm2、4.50 6.50 t/hm-2、6.50 8.50 t/hm2、〉8.50 t/hm-2产量范围生产100 kg籽粒需磷量分别为0.41 kg、0.43 kg、0.50 kg、0.52 kg;籽粒磷含量基本维持一定水平,分别为0.32%、0.31%、0.31%、0.33%,秸秆磷含量呈增加趋势,分别为0.05%、0.07%、0.11%、0.12%。【结论】我国小麦产量、籽粒磷含量、秸秆磷含量、籽粒磷吸收量、秸秆磷吸收量、地上部吸磷总量和生产100 kg籽粒需磷量波动范围大,变异性较高,存在明显 . 【目的】掌握小麦磷素的吸收特征及区域差异性有利于指导小麦合理施肥,提高磷肥肥效,维持小麦增产稳产。本文旨在探讨我国小麦磷素吸收特征的区域差异性及对产量的响应。【方法】本文收集了2000年后我国黄淮海冬麦区、西北冬春兼播麦区和长江中下游麦区小麦田间试验的文献数据,统计分析了小麦产量、地上部磷吸收、籽粒磷含量、秸秆磷含量、100 kg籽粒需磷量等参数的区域异质性,并计算了小麦不同产量水平下100 kg籽粒需磷量、籽粒磷含量和秸秆磷含量的变化特征。【结果】我国田间试验的小麦平均产量为6.18 t/hm-2(n=5424),变异系数为33.1%;籽粒、秸秆磷含量全国平均分别为0.32%(n=1072)、0.08%(n=864),变异系数分别为34.3%、75.0%;地上部、籽粒和秸秆吸磷量全国平均分别为26.4 kg/hm-2(n=1370)、17.0 kg/hm-2(n=679)、5.4kg/hm-2(n=650),变异系数分别为58.6%、55.1%、94.8%。除籽粒磷含量外,小麦产量、地上部磷吸收量、籽粒磷吸收量、秸秆磷吸收量和秸秆磷含量均以黄淮海麦区最高,长江中下游冬麦区次之,西北冬春麦区最低。生产100 kg籽粒需磷量全国平均为0.46 kg(n=1546),变异系数37.0%,其中以黄淮海冬麦区最高,为0.50 kg(n=813),长江中下游冬麦区和西北冬春麦区分别为0.44 kg(n=195)和0.41 kg(n=538)。随小麦产量水平的提高,生产100 kg小麦籽粒需磷量呈增加趋势,〈4.50 t/hm2、4.50 6.50 t/hm-2、6.50 8.50 t/hm2、〉8.50 t/hm-2产量范围生产100 kg籽粒需磷量分别为0.41 kg、0.43 kg、0.50 kg、0.52 kg;籽粒磷含量基本维持一定水平,分别为0.32%、0.31%、0.31%、0.33%,秸秆磷含量呈增加趋势,分别为0.05%、0.07%、0.11%、0.12%。【结论】我国小麦产量、籽粒磷含量、秸秆磷含量、籽粒磷吸收量、秸秆磷吸收量、地上部吸磷总量和生产100 kg籽粒需磷量波动范围大,变异性较高,存在明显 |
| [24] | . <p><span >以泰山</span><span >23</span><span >和济麦</span><span >22</span><span >为试验品种,通过连续</span><span >2</span><span >年的田间试验,对单产高达</span><span >10 000 kg hm</span><sup><span >-</span><span >2</span></sup><span >的小麦进行了施氮量和氮素吸收转运和分配特性的研究。在</span><span >2006</span><span >—</span><span >2007</span><span >年生长季,随着施氮量的增加,小麦籽粒产量先增加后降低,施纯氮</span><span >240</span><span > kg hm</span><sup><span >-</span><span >2 </span></sup><span >(N240)</span><span >和</span><span >270</span><span > kg hm</span><sup><span >-</span><span >2</span></sup><span >(N270)</span><span >处理的产量分别达</span><span >9 954.73 kg hm</span><sup><span >-</span><span >2</span></sup><span >和</span><span >10 647.02 kg hm</span><sup><span >-</span><span >2</span></sup><span >,比不施氮肥处理</span><span >(N0)</span><span >分别增加</span><span >11.20%</span><span >和</span><span >18.93%</span><span >。与</span><span >N0</span><span >处理相比,施氮处理显著增加了小麦植株氮素积累量、</span><span >籽粒氮素积累量和开花后营养器官氮素向籽粒的转运量;随着施氮量的增加,成熟期小麦植株氮素积累量呈先增后降趋势,以</span><span >N270</span><span >处理最高;开花后营养器官氮素向小麦籽粒转运量和转运率先升后降,转运量以</span><span >N270</span><span >处理最大,为</span><span >213.78 </span><span >kg hm</span><sup><span >-</span><span >2</span></sup><span >;而转运率以</span><span >N240</span><span >处理最高,为</span><span >67.98%</span><span >。随施氮量的增加,小麦成熟期各器官干物质积累量、花后营养器官干物质再分配量和再分配率先增后降,均以</span><span >N270</span><span >处理最高;</span><span >开花后干物质积累对籽粒的贡献率亦呈先增后降的趋势,以</span><span >N240</span><span >处理最高</span><span >。</span><span >2005</span><span >—</span><span >2006</span><span >年的试验结果呈相同变化趋势。在本试验条件下,小麦产量水平达</span><span >10 000 kg hm</span><sup><span >-</span><span >2</span></sup><span >时的适宜施氮量为</span><span >240~270 </span><span >kg hm</span><sup><span >-</span><span >2</span></sup><span >,可供生产中参考。</span></p> . <p><span >以泰山</span><span >23</span><span >和济麦</span><span >22</span><span >为试验品种,通过连续</span><span >2</span><span >年的田间试验,对单产高达</span><span >10 000 kg hm</span><sup><span >-</span><span >2</span></sup><span >的小麦进行了施氮量和氮素吸收转运和分配特性的研究。在</span><span >2006</span><span >—</span><span >2007</span><span >年生长季,随着施氮量的增加,小麦籽粒产量先增加后降低,施纯氮</span><span >240</span><span > kg hm</span><sup><span >-</span><span >2 </span></sup><span >(N240)</span><span >和</span><span >270</span><span > kg hm</span><sup><span >-</span><span >2</span></sup><span >(N270)</span><span >处理的产量分别达</span><span >9 954.73 kg hm</span><sup><span >-</span><span >2</span></sup><span >和</span><span >10 647.02 kg hm</span><sup><span >-</span><span >2</span></sup><span >,比不施氮肥处理</span><span >(N0)</span><span >分别增加</span><span >11.20%</span><span >和</span><span >18.93%</span><span >。与</span><span >N0</span><span >处理相比,施氮处理显著增加了小麦植株氮素积累量、</span><span >籽粒氮素积累量和开花后营养器官氮素向籽粒的转运量;随着施氮量的增加,成熟期小麦植株氮素积累量呈先增后降趋势,以</span><span >N270</span><span >处理最高;开花后营养器官氮素向小麦籽粒转运量和转运率先升后降,转运量以</span><span >N270</span><span >处理最大,为</span><span >213.78 </span><span >kg hm</span><sup><span >-</span><span >2</span></sup><span >;而转运率以</span><span >N240</span><span >处理最高,为</span><span >67.98%</span><span >。随施氮量的增加,小麦成熟期各器官干物质积累量、花后营养器官干物质再分配量和再分配率先增后降,均以</span><span >N270</span><span >处理最高;</span><span >开花后干物质积累对籽粒的贡献率亦呈先增后降的趋势,以</span><span >N240</span><span >处理最高</span><span >。</span><span >2005</span><span >—</span><span >2006</span><span >年的试验结果呈相同变化趋势。在本试验条件下,小麦产量水平达</span><span >10 000 kg hm</span><sup><span >-</span><span >2</span></sup><span >时的适宜施氮量为</span><span >240~270 </span><span >kg hm</span><sup><span >-</span><span >2</span></sup><span >,可供生产中参考。</span></p> |
| [25] | . A pot culture experiment was conducted to study the difference among 3 wheat varieties in characteristics of potassium uptake and potassium nutrition efficiency under 2 potassium levels condition. Relative yield in check treatment (EI) and potassium efficiency in increasing biomass or grain yield (KE) were adopted to evaluate the potassium nutrition efficiency of three wheat varieties under potassium deficiency and sufficiency condition, respectively. The EI value of high potassium efficiency (HKE) wheat variety was higher than low potassium efficiency (LKE) variety, and the former could endure low soil available potassium to produce more yields, but the latter had larger KE value and higher increase rate of grain yield by application of potassium fertilizer. The potassium content of HKE wheat functional leaves (3 d-4th leaf from top of plant) was higher than the LKE wheat, and the HKE wheat variation in potassium content between functional leaf and heart-1st leaf was larger than the LKE.The results also showed that the variation among wheat varieties in potassium nutrition efficiency was not due to the total potassium amount accumulated by plant, but to the distribution and movement of potassium in plant. |
| [26] | . 以鄂东南典型冷浸田为对象,通过磷钾调控措施研究冷浸田适宜磷钾用量以及不同磷钾用量对水稻产量和养分吸收的影响。结果表明,施肥可以极大提高水稻产量, 其中NPK、NP2K、NPK1 、NPK+Zn和NPK2处理的产量比CK或XG高20%-30%左右。在NPK基础上增施锌肥、硅肥和钾肥增产达到显著水平,降低磷肥用量则明显降低水稻产量,而降低钾肥用量对产量影响不大。连续两年种植水稻使土壤碱解氮、速效磷、速效钾呈现出缓慢降低趋势,增施磷、钾肥对浸稻田速效磷、钾含量影响不大。施肥处理籽粒和茎部钾含量明显高于CK;施肥处理籽粒氮累积量显著高于CK和XG处理。相对于NPK、CK、XG处理,NP2K(2011年)和 NPK2(2012年)处理可显著提高籽粒磷累积, 施肥处理籽粒钾累积显著或极显著高于CK处理(2012年)。综合考虑,在鄂东南低丘区冷浸田施肥量以N:P2O5:K2O= 180:90-108:120-144 kg?hm-2为宜,同时配合使用锌肥和硅肥。 . 以鄂东南典型冷浸田为对象,通过磷钾调控措施研究冷浸田适宜磷钾用量以及不同磷钾用量对水稻产量和养分吸收的影响。结果表明,施肥可以极大提高水稻产量, 其中NPK、NP2K、NPK1 、NPK+Zn和NPK2处理的产量比CK或XG高20%-30%左右。在NPK基础上增施锌肥、硅肥和钾肥增产达到显著水平,降低磷肥用量则明显降低水稻产量,而降低钾肥用量对产量影响不大。连续两年种植水稻使土壤碱解氮、速效磷、速效钾呈现出缓慢降低趋势,增施磷、钾肥对浸稻田速效磷、钾含量影响不大。施肥处理籽粒和茎部钾含量明显高于CK;施肥处理籽粒氮累积量显著高于CK和XG处理。相对于NPK、CK、XG处理,NP2K(2011年)和 NPK2(2012年)处理可显著提高籽粒磷累积, 施肥处理籽粒钾累积显著或极显著高于CK处理(2012年)。综合考虑,在鄂东南低丘区冷浸田施肥量以N:P2O5:K2O= 180:90-108:120-144 kg?hm-2为宜,同时配合使用锌肥和硅肥。 |
| [27] | . Understanding the time-course of dry matter (DM) and nitrogen (N) accumulation in terms of yield–trait relationships is essential to simultaneously increase grain yield and synchronize N demand and N supply. We collected 413 data points from 11 field experiments to address patterns of DM and N accumulation with time in relation to grain yield and management of winter wheat in China. Detailed growth analysis was conducted at the Zadok growth stages (GS) 25 (regreening), GS30 (stem elongation), GS60 (anthesis), and GS100 (maturity) in all experiments, including DM and N accumulation. Grain yield averaged 7.3 Mg ha611, ranging from 2.1 to 11.2 Mg ha611. The percent N accumulation was consistent prior to DM accumulation, while both DM and N accumulation increased continuously with growing time. Both the highest and fastest DM and N accumulations were observed from stem elongation to the anthesis stage. Significant correlations between grain yield and DM and N accumulation were found at each of the four growth stages, although no positive relationship was observed between grain yield and harvest index or N harvest index. The yield increase from 7–9 Mg ha611to >9 Mg ha611was mainly attributed to increased DM and N accumulation from stem elongation to anthesis. Although applying more N fertilizer increased N accumulation during this stage, DM accumulation was not improved, indicating that N fertilizer management and related agronomic management should be intensified synchronously across the wheat growing season to simultaneously achieve high yields and match N demand and N supply. |
| [28] | . In the trial on fine sandy loam in North Dakota plots were dressed with 45 lb N as NH4NO3 per acre with or without 43 lb P as superphosphate, 26 lb before flowering and the rest with the N before sowing. Dry matter, percentage and yield of N and P in whole plants and in parts were estimated. Concentrations of both N and P were higher with fertilising. In whole plants percentage N decreased from... |
| [29] | . Food security is becoming a crucial concern worldwide. In this study, we focus on wheat – a staple crop in China – as a model to review its history, status quo and future scenarios, with regard to key production technologies and management practices for wheat production and associated food security issues since the new era in China: the post-1949 era. First, the dominant technologies and management practices over the past 6065years are reviewed. Secondly, we outline several key innovative technologies and their theoretical bases over the last decade, including (i) prohibiting excessively early senescence at a later growth stage to maintain viable leaves with higher photosynthetic capacity, (ii) postponing top dressing nitrogen application to balance carbon and nitrogen nutrition, and (iii) achieving both high yield and better grain quality mainly by increasing soil productivity and balancing the ratio of nutrient elements. Finally, concerns such as water shortages and excessive application of chemical fertilizers are presented. Nevertheless, under high negative conditions, including global warming, rapid population growth, decreasing amounts of arable land, increasing competition with cash crops and severe environmental pollution, we conclude that domestic food production will be able to meet Chinese demand in the mid to long term, because increasingly innovative technologies and improved management practices have been and may continue to be applied appropriately. 08 2013 Society of Chemical Industry |
| [30] | . New insights into changes in physiological processes associated with genetic gains in yield potential are essential for improved understanding of yield-limiting factors. Our field study was conducted at two sites with three N levels and 15 modern wheat ( Triticum aestivum L.) varieties. The goal was to evaluate yield components, time courses of dry matter production, and N accumulation among different yield categories, and to determine physiological processes associated with yield–trait relationships. Close correlations were observed between yield and dry matter production after the stem elongation stage, particularly post-anthesis. Similar close correlations were observed between grain yield and N accumulation over the whole growing season, except for the re-greening stage. No positive correlation was found between yield and harvest index. Differences in dry matter production among different yield categories began at anthesis; differences in N accumulation emerged even earlier. We conclude that consistent increases in dry matter production (especially post-anthesis) and N accumulation are crucial for further improvements in wheat yield–trait relationships. |
| [31] | . In barley no studies have attempted to pinpoint the critical period for grain number determination, and it is frequently stated that the critical period is similar to that of wheat. However, there are important differences between the species and among barley genotypes (i.e. two- and six-rowed types) suggesting that this assumption requires testing. The objectives of this paper were (i) to determine the critical period for grain number determination in two- and six-rowed barleys, and (ii) to identify which yield components were more sensitive to changes in incident radiation during that period. Two field experiments were conducted using two pairs of near isogenic lines differing only in the spike type. Shading was imposed at different periods throughout the crop cycle (from 60 days before heading to 15 days after) to reduce incident solar radiation approximately 70%. The critical period for grain number determination tended to be slightly earlier in two- (ca. between 40 and 10 days before heading) than in six-rowed barleys (ca. between 30 days before heading until that stage). In terms of the external phenology, the beginning of the critical period for setting grains was 10 days after the beginning of stem elongation, and 10 days before flag leaf appearance in two- and six-rowed lines, respectively. Changes in the number of grains per unit area were correlated with crop growth rate during the critical period for yield determination. |
| [32] | . Summary Yield potential can be expressed as a product of light interception, radiation use efficiency (RUE), and the partitioning of biomass to grain yield, or harvest index (HI). Traits related to early or late light interception have not been shown to be associated with genetic improvement of spring wheat yield in favourable environments. It is, however, well established that yield improvement is largely a result of increased HI, although the most recent studies comparing genetic progress in HI over time in spring wheat indicate that it has not made any additional progress since the mid 1980s. These observations suggest that future genetic progress in yield will most likely be achieved by focusing on constraints to RUE. Considering the possibility that RUE may be influenced indirectly by sink limitation, it is apparent that biomass may be increased by increasing grain number, for example. Experiments with high yielding spring wheat lines containing the alien translocation 7DL.7Ag showed increased grains m-2 (15%), yield (12%), and biomass (9%) compared with controls. The translocation was also associated with a larger investment in spike mass at anthesis (15%), more grains/spike (10%), and increased flag-leaf photosynthetic rate during grain-filling (20%). The data suggest that increased biomass in 7DL.7Ag lines was due to significantly increased RUE post-anthesis, as a result of a larger kernel number (sink) that increased the demand for photosynthesis during grain-filling. The hypothesis that increased photosynthesis and RUE may respond directly to a larger number of grains/spike was tested experimentally by imposing a light treatment during boot stage. The treatment was associated with a small increase (5%) in the proportion of biomass invested in spike mass at anthesis, reflected by on average three extra grains/spike at maturity. The treatment was associated with 25% more yield and 22% more biomass than controls, while carbon assimilation rate measured on flag-leaves during grainfilling was 10% higher than controls. The results suggest that RUE can be increased indirectly by increasing sink strength and that the current yield limiting process in spring wheat is the determination of kernel number. Experimental data are presented on how spike fertility may be increased through breeding, for example by introgression of the multi-ovary trait to increase grain number per spikelet. In addition, results of analysis of the physiological bases of genotype 脳 year interaction in high yield environments are presented in the context of how such information can provide a focus for genetic studies of sink limitation. |
