马艳丽1,张鹏1,朱洁玉1,姜健锋2
(1.哈尔滨工业大学 交通科学与工程学院,哈尔滨 150090; 2.黑龙江省公路勘察设计院, 哈尔滨 150080)
摘要:
为定量分析交通流中车辆间的交互影响,开展了主干路车辆交互速度变化模型研究,通过类比势能场理论中的引力和斥力,界定了势能场影响区域的概念,将目标车运行时与周围车辆的吸引和排斥作用归结为势能场影响区域交互面积的变化,提出考虑势能场影响区域的车辆交互分析方法,建立了目标车速度变化量与势能场影响区域交互面积的线性模型. 采用P3-DT北斗高精度定位测向机采集车辆坐标和速度,标定模型参数. 用该模型计算目标车速度变化量,并与实测数据进行对比. 结果表明:模型计算值与实际值之间的误差小于15%,车道变换时间越短,目标车与目标车道后方车辆间的交互作用越明显,后车的减速操作越迅速,验证了模型的有效性. 该模型将传统微观交通流分析中的车速与车辆间距两大因素归一为势能场影响区域交互面积,可为微观交通流中的多车交互研究提供方法,并为自动驾驶车辆提供速度控制策略.
关键词: 交通工程 微观交通分析 势能场 车速变化 车辆间距
DOI:10.11918/201904266
分类号:U491
文献标识码:A
基金项目:国家重点研发计划(2017YFC0803901); 黑龙江省公路勘察设计院科技项目(2018006)
Vehicle interaction velocity-changing model in the region affected by potential field
MA Yanli1,ZHANG Peng1,ZHU Jieyu1,JIANG Jianfeng2
(1. School of Transportation Science and Engineering, Harbin Institute of Technology, Harbin 150090, China; 2. Heilongjiang Provincial Highway Survey and Design Institute, Harbin 150080, China)
Abstract:
To quantitatively analyze the interaction between vehicles in traffic flow, the vehicle interaction velocity-changing model of arterial road was studied. The concept of potential field influence region was defined through the analogy of gravitation and repulsion in the potential field theory. The attraction and repulsion between the target vehicle and the surrounding vehicles were attributed to the changes of the interaction area affected by the potential field. A vehicle interaction analysis method considering the influence area of potential field was proposed, and a linear model of the interaction area between target vehicle velocity variation and potential field was established. Vehicle coordinates and speed data collected by the P3-DT BeiDou high-precision positioning direction finder were used to calibrate model parameters. The speed changes of the target vehicle were calculated by the proposed method and compared with the measured data. Results show that the error values between the calculation results and the measured data were less than 15%. When the lane-changing time became shorter, the interaction between the lane-changing vehicle and the rear vehicle on the target lane was stronger, and the deceleration of the rear vehicle was operated more quickly, which verifies the validity of the model. The model normalizes the vehicle speed and spacing in traditional microscopic traffic flow analysis into the interaction area of potential field, which can provide method for the study of multi-vehicle interactions in microscopic traffic flow and speed control strategy for automatic driving vehicles.
Key words: traffic engineering microscopic traffic analysis potential field vehicle speed changing vehicle spacing
马艳丽, 张鹏, 朱洁玉, 姜健锋. 势能场影响区域车辆交互速度变化模型[J]. 哈尔滨工业大学学报, 2020, 52(9): 51-56. DOI: 10.11918/201904266.

MA Yanli, ZHANG Peng, ZHU Jieyu, JIANG Jianfeng. Vehicle interaction velocity-changing model in the region affected by potential field[J]. Journal of Harbin Institute of Technology, 2020, 52(9): 51-56. DOI: 10.11918/201904266.

基金项目 国家重点研发计划(2017YFC0803901);黑龙江省公路勘察设计院科技项目(2018006) 作者简介 马艳丽(1974—),女,副教授,硕士生导师 通信作者 马艳丽,mayanli@hit.edu.cn 文章历史 收稿日期: 2019-04-25
Abstract Full text Figures/Tables PDF
势能场影响区域车辆交互速度变化模型
马艳丽1

 , 张鹏1, 朱洁玉1, 姜健锋2
 1. 哈尔滨工业大学 交通科学与工程学院, 哈尔滨 150090;
2. 黑龙江省公路勘察设计院, 哈尔滨 150080
收稿日期: 2019-04-25
基金项目: 国家重点研发计划(2017YFC0803901);黑龙江省公路勘察设计院科技项目(2018006)
作者简介: 马艳丽(1974—),女,副教授,硕士生导师
通信作者: 马艳丽,mayanli@hit.edu.cn
摘要: 为定量分析交通流中车辆间的交互影响,开展了主干路车辆交互速度变化模型研究,通过类比势能场理论中的引力和斥力,界定了势能场影响区域的概念,将目标车运行时与周围车辆的吸引和排斥作用归结为势能场影响区域交互面积的变化,提出考虑势能场影响区域的车辆交互分析方法,建立了目标车速度变化量与势能场影响区域交互面积的线性模型.采用P3-DT北斗高精度定位测向机采集车辆坐标和速度,标定模型参数.用该模型计算目标车速度变化量,并与实测数据进行对比.结果表明:模型计算值与实际值之间的误差小于15%,车道变换时间越短,目标车与目标车道后方车辆间的交互作用越明显,后车的减速操作越迅速,验证了模型的有效性.该模型将传统微观交通流分析中的车速与车辆间距两大因素归一为势能场影响区域交互面积,可为微观交通流中的多车交互研究提供方法,并为自动驾驶车辆提供速度控制策略.
关键词: 交通工程 微观交通分析 势能场 车速变化 车辆间距
Vehicle interaction velocity-changing model in the region affected by potential field
MA Yanli1

 , ZHANG Peng1, ZHU Jieyu1, JIANG Jianfeng2
 1. School of Transportation Science and Engineering, Harbin Institute of Technology, Harbin 150090, China;
2. Heilongjiang Provincial Highway Survey and Design Institute, Harbin 150080, China
Abstract: To quantitatively analyze the interaction between vehicles in traffic flow, the vehicle interaction velocity-changing model of arterial road was studied. The concept of potential field influence region was defined through the analogy of gravitation and repulsion in the potential field theory. The attraction and repulsion between the target vehicle and the surrounding vehicles were attributed to the changes of the interaction area affected by the potential field. A vehicle interaction analysis method considering the influence area of potential field was proposed, and a linear model of the interaction area between target vehicle velocity variation and potential field was established. Vehicle coordinates and speed data collected by the P3-DT BeiDou high-precision positioning direction finder were used to calibrate model parameters. The speed changes of the target vehicle were calculated by the proposed method and compared with the measured data. Results show that the error values between the calculation results and the measured data were less than 15%. When the lane-changing time became shorter, the interaction between the lane-changing vehicle and the rear vehicle on the target lane was stronger, and the deceleration of the rear vehicle was operated more quickly, which verifies the validity of the model. The model normalizes the vehicle speed and spacing in traditional microscopic traffic flow analysis into the interaction area of potential field, which can provide method for the study of multi-vehicle interactions in microscopic traffic flow and speed control strategy for automatic driving vehicles.
Keywords: traffic engineering microscopic traffic analysis potential field vehicle speed changing vehicle spacing
分析车辆间的相互影响,揭示车辆运行速度的变化规律,对提高车辆行驶效率、降低交通拥堵等具有重要的理论与现实意义.微观交通分析主要分两类,一类从动力学角度,研究跟驰车加速度,文献[1]从只考虑车辆间距和前车速度的经典GM跟驰模型到考虑车辆安全间距的速度优化模型,再到考虑前后车正负速度差的全速度差模型;文献[2-3]均基于刺激-反应机理,通过描述跟驰车的加速度来描述交通流运行时车辆之间的影响;文献[4]研究了车辆安全间距对车辆超车变道、加减速的影响;文献[5]以最小安全间距为依据,将双车道作为研究对象,建立了换道模型,对换道车辆和周围车辆间的最小安全距离进行研究.另一类从运动学的角度,追求“效率”和“安全”的平衡而与前车保持期望间距,文献[6-7]基于势能场思想建立微观交通模型,将加减速等行为归纳为“效率”和“安全”两种因素的综合作用;文献[8]建立了动态广义势能场的行人交通模型;文献[9]构建了虚拟三维势能场来评估车辆危险行驶状态;文献[10]考虑周围车辆间距对换道时间的影响,提出了一种基于位能场理论的城市道路B型交织段换道时间模型;文献[11]在考虑风险规避的基础上,提出车辆换道模型,通过车辆的纵向加速度判断换道可能性,为车辆应对各种危险工况的驾驶决策提供理论依据.
上述模型本质上是基于车辆间距和车辆速度而进行的,将车辆看成独立的单位,在一定程度上忽视了交通流的流体特性.本文类比磁体通过磁场产生相互作用的现象,引入势能场影响区域的概念,将车辆间距和车辆速度两种因素归结为势能场影响区域交互面积,将车辆之间的影响看作势能场影响区域交互的结果,构建考虑势能场影响区域的车辆交互速度变化模型.
1 势能场理论及其在交通流中的应用 1.1 势能场理论场属于物理学术语,指代一种空间区域,具有一定性质的物体可以对与其无接触的物体施加一种力.力线通常被用来表示场,说明力的作用方向.力线的密集度表示力的强度大小,即代表了区域场的大小[12].
运用势能场理论分析物体运动状态的基本思想是将机器人在某一空间区域的运动,设计成抽象的人造引力场运动[7].将周围环境对机器人运动状态的影响,量化为人造引力场的参数,将目标点和障碍物对机器人产生的“引力”与“斥力”进行矢量叠加,通过叠加后的合力来确定机器人的移动路径.类比磁体通过磁场产生相互作用的现象,本文构建椭圆形势能场影响区域,当不同车辆的势能场影响区域产生重叠时,车辆之间产生相互作用.
1.2 势能场理论在交通流中的应用两个磁体通过磁场的交互而发生相互作用,相同磁极靠近时产生排斥作用,相异磁极靠近时产生吸引作用[13-14].车辆在道路上行驶时,为了缩短行程时间,通常会缩短与前车的间距,与前车之间表现出“吸引”作用,借用势能场理论中的基本的引力函数[15]为
$U_{\mathrm{atr}}=\frac{1}{2} \varepsilon r^{2}.$ (1)
式中:Uatr表示引力势场的大小,方向与车辆前进方向相同;ε为尺度因子;r为目标车与前车的距离.
同时,车辆在跟随前车行驶的过程中,为了行车安全,驾驶员会与前车保持一定的安全距离.当间距较小时,与前车之间表现出“排斥”作用,斥力场函数[15]为
$U_{\mathrm{rep}}=\left\{\begin{array}{ccc}\frac{1}{2} \eta\left(\frac{1}{r}-\frac{1}{r_{0}}\right)^{2} & , & r<r_{0}; \\ 0 & , & r \geqslant r_{0}.\end{array}\right.$ (2)
式中:Urep表示斥力势场的大小,方向与车辆行驶方向相反;η为尺度因子,与引力势场不同的是,设置r0作为前方车辆的影响半径,超出这个距离,则前车对目标车没有阻碍作用.
2 基于势能场影响区域的车辆交互速度变化模型 2.1 势能场影响区域界定交通流中每辆车在运行时周围均存在一个势能场影响区域,当不同车辆的势能场影响区域相交时,产生相互作用.由于车辆行驶时不允许其周围一定空间内存在障碍物,在车辆周围划定约束区域和势能场影响区域,采用约束区和势能场影响区的形状参数表示车辆的加、减速因素,给出其行驶规则,即:车辆运行时避免约束区重叠,以确保车辆间的安全间距;当势能场影响区域有重叠时,车辆之间产生交互.如图 1所示,将目标车几何中心作为原点,以车辆行驶方向为x轴正方向,垂直于x轴且指向左侧的方向为y轴正方向,建立平面直角坐标系. 图 1中虚线所封闭的椭圆(1)、(2)分别表示约束区和势能场影响区,表达式分别为
Fig. 1
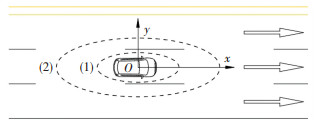 图 1 势能场影响区域示意 Fig. 1 Schematic of potential field influence region
 $\frac{x^{2}}{a_{1}^{2}}+\frac{y^{2}}{b_{1}^{2}}=1, $ (3)
$\frac{x^{2}}{a_{2}^{2}}+\frac{y^{2}}{b_{2}^{2}}=1.$ (4)
式中:a1、b1为约束区形状参数,a1的大小由车辆的纵向最小安全距离确定,b1的大小由车辆的横向最小安全距离确定;a2、b2为势能场影响区形状参数,a2依据跟驰行驶的最小车头时距而定,b2与相邻车道及不相邻车道的交互区域相关.
当车辆间距足够大时,势能场影响区域不重叠,该种情况下车辆为自由行驶,车辆没有交互作用,如图 2(a)所示;当车辆间的距离较小时,势能场影响区会重叠,该种情况下车辆间会进行交互,如图 2(b)所示,驾驶员感受到周围车辆的“压迫”,这种“压迫”取决于势能场影响区域重叠部分的面积.
Fig. 2
 图 2 势能场影响区域 Fig. 2 Potential field influence region
 为方便描述势能场影响区域下的车辆运行规则,定义:i, j为车辆编号,i, j={1, 2, 3, 4, 5, 6, 7, 8}; Si为第i辆车与周围车辆的约束区域的重叠面积,车辆安全正常行驶时Si严格等于零; Si为目标车与前车i的势能场影响区域的交互面积,即图 2(b)中O车与i车的阴影部分面积(为了便于计算和说明,将该面积标准化,即:
2.2 势能场影响区域形状参数确定势能场影响区域的形状参数的标定,如图 3(a)、3(b)所示,a1以跟驰行驶的临界安全间距为依据,设车身长度为5 m,则2a1=5 m+5 m,a1=5 m;参考车辆安全运行需要占用的横向净空,b1取1.5 m;a2以发生跟驰行为的临界车头时距为依据,当车辆运行速度为60 km/h时,临界车头时距和车头间距分别为5 s和83.3 m,则2a2=83.3 m,a2= 41.65 m;非相邻车道的车辆没有交互作用(1、3车道的车辆交互区相切,即2b2=3.5 m×2),b2=3.5 m.
Fig. 3
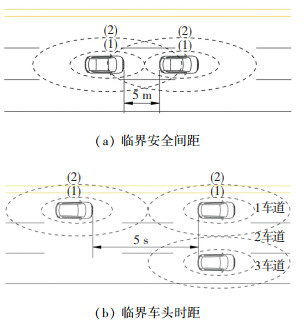 图 3 势能场区域形状参数示意 Fig. 3 Schematic of shape parameter of potential field region
 2.3 车辆交互速度变化模型构建定义约束区域不重叠为车流运行的基本条件,即?i, Si=0.当?i, Si=0时,目标车与周围车之间不产生交互,车流呈自由行驶的状态,以期望速度行驶.当
参考GM刺激-反应跟驰模型的基本原理,跟驰车的加速度与前后车速度差成正比,与前后车间距成反比.此外,道路上行驶的车辆具有提高行驶效率和追求安全行驶两个需求,前者促使车辆缩短与前车的间距,后者促使车辆增加与前车的间距.定义势能场影响区域下目标车的车速变化量为
$\Delta v(t)=c_{1} \cdot\left(S_{i}^{*}-S_{i}\right).$ (5)
式中:速度变化量Δv(t)=v(t+T)-v(t),单位为km/h,表示目标车在下一个时间间隔速度变化;t为时间间隔;c1为修正系数;Si为目标车与前车的势能场影响区域交互面积;Si*为车流稳定行驶时,目标车与前车势能场影响区域交互面积.
当侧面车辆向目标车所在车道变道时,目标车的速度变化量为
$\Delta v(t)=c_{2} \cdot\left(S_{j}^{*}-S_{j}\right).$ (6)
式中:c2为修正系数;Sj为目标车与侧向车势能场影响区域交互面积;Sj*为车流稳定运行时,目标车与侧向车的势能场影响区域交互面积.
3 数据处理及模型参数标定 3.1 数据调查与处理数据调查设备为6套P3-DT北斗高精度定位测向机,调查时间为2019年3月,天气晴朗,无雨雪干扰.调查路段为哈尔滨市长江路约为1.6 km的路段,该路段为双向8车道、设置中央分隔带的主干路;试验时段为平峰期,道路交通量适中,不发生拥堵. 6台试验车排成两列,从起点开始行驶,到终点时掉头,返回起点为一个循环往返行驶,数据采集地点如图 4所示.
Fig. 4
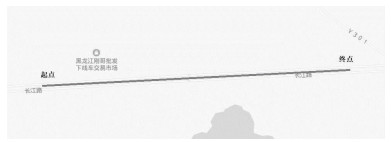 图 4 数据采集地点 Fig. 4 Data collection location
 采集原始数据时每间隔0.2 s进行输出,输出数据包括试验车当前时刻、三维坐标、航向角等,原始数据自动保存后生成.txt文本文档.
提取出6台车的车速和x′坐标、y′坐标,文中所有车速单位均为km/h,坐标的单位均为m,表格中不再单独说明. 1#车对应图 2中的i车,6#车对应图 2中的j车.为了方便计算,将x′、y′坐标按式(7)进行坐标平移,并将平移后的坐标列于表 1中.
表 1
1#车 6#车 1#车 6#车 1#车 6#车
09:57:19.2 33.13 23.09 399.61 319.67 4.50 -12.72
09:57:19.4 33.60 23.32 401.45 320.92 4.86 -12.39
09:57:19.6 33.72 23.53 403.29 322.18 5.22 -12.05
09:57:19.8 34.36 23.36 405.16 323.44 5.56 -11.74
表 1 坐标平移后不同时刻坐标及瞬时速度汇总 Tab. 1 Coordinates and instantaneous velocity at different time after coordinate translation
$\left\{\begin{array}{r}x=x^{\prime}-560\;000, \\ y=y^{\prime}-5\;067\;800.\end{array}\right.$ (7)
3.2 参数标定1) c1的标定.绘制Δv(t)-Si散点图,如图 5所示,由式(5)可知,
Fig. 5
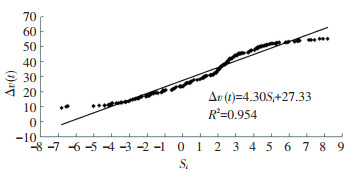 图 5 拟合示意图 Fig. 5 Fitting diagram
 2) c2的标定.根据试验时的记录和y坐标,确定车辆换道发生时刻,提取侧向车换道起始与中间时刻(换道车辆中轴线与道路标线重合时)的目标车辆速度见表 2.
表 2
09:58:07.2 60.64 1 083.13 132.37 54.40 982.01 113.88 12.15
09:58:10.4 57.01 1 134.52 139.83 57.97 1 031.16 123.26 12.13
09:58:29.8 63.47 1 460.00 166.71 56.83 1 338.53 160.94 13.53
11:34:25.8 57.62 1 422.31 185.53 51.67 1 425.76 188.76 14.03
11:34:29.6 53.13 1 363.88 184.69 47.30 1 373.87 186.29 14.19
表 2 换道车及目标车道后车坐标、速度汇总 Tab. 2 Coordinates and speed summary of lane-changing vehicle and rear vehicle on target lane
表 2中,偶数行为换道车辆j和目标车O在起始时刻的速度、平面坐标及势能场影响区域交互面积;奇数行为换道车辆j和目标车O在换道中间时刻的速度、平面坐标及势能场影响区域交互面积.根据表 2求得目标车O在换道起始时刻和中间时刻的速度变化量Δv(t),以及换道中间时刻目标车O与换道车j的势能场影响区域交互面积Sj,绘制目标车速度变化量与交互面积散点图,如图 6所示.
Fig. 6
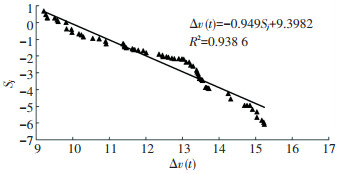 图 6 拟合示意图 Fig. 6 Fitting diagram
 由Δv(t)=c2· (Sj*-Sj)可知,Sj=
4 模型验证提取对照组试验车辆176次换道的车速和x、y坐标,计算目标车的速度变化量,目标车与前车的速度、坐标计算结果见表 3,目标车与侧向车的速度、坐标计算结果见表 4,表中Δvc为计算的速度变化量,Δva为实际的速度变化量.
表 3
(km·h-1) xO/m yO/m vi/
(km·h-1) xi/m yi/m Sj Δvc(t)/
(km·h-1) Δva(t)/
(km·h-1)
08:28:07.2 59.34 1 439.58 1.89 56.32 1 417.27 6.60 — — —
08:28:09.4 57.56 1 443.03 1.67 57.69 1 420.75 6.37 35.8 -1.98 -1.78
08:32:29.8 61.32 1 446.49 1.46 57.67 1 424.22 6.13 — — —
09:10:12.8 55.57 2 448.55 -35.84 50.27 2 482.95 -38.36 — — —
09:10:14.6 52.93 2 446.11 -35.69 44.93 2 480.41 -38.22 37.2 -2.31 -2.64
表 3 目标车与前车速度、坐标计算结果汇总 Tab. 3 Speed and coordinates calculation results of target vehicle and lead vehicle
表 4
(km·h-1) xO/m yO/m vj/
(km·h-1) xj/m yj/m Sj Δvc(t)/
(km·h-1) Δva(t)/
(km·h-1)
08:28:07.2 60.64 1 083.13 132.37 54.40 982.01 113.88 — — —
08:28:09.4 57.01 1 134.52 139.83 57.97 1 031.16 123.26 12.6 -3.38 -3.63
08:32:29.8 63.47 1 460.00 166.71 56.83 1 338.53 160.94 — — —
09:10:12.8 57.62 1 422.31 185.53 51.67 1 425.76 188.76 — — —
09:10:14.6 53.13 1 363.88 184.69 47.30 1 373.87 186.29 13.4 -4.20 -4.49
表 4 目标车与侧向车速度、坐标计算结果汇总 Tab. 4 Speed and coordinates calculation results of target vehicle and side vehicle
表 4中,每两行数据为一对,偶数行为换道起始时刻,奇数行为换道中间时刻.定义速度变化量Δv(t)计算值与实际值的误差为
$d=\frac{\sum\left|\Delta v_{\mathrm{a}}(t)-\Delta v_{\mathrm{c}}(t)\right|}{n \cdot \sum\left|\Delta v_{\mathrm{a}}(t)\right|} \times 100 \%, $ (8)
其中n为实验车辆换道次数.在对照组选定时间段内,跟驰行驶时目标车速度变化量的计算值与实际值的误差为10.4%;侧向车变道时目标车速度变化量的计算值与实际值的误差为11.2%.
对速度变化量的计算值与实际值进行F检验,假设Δv与Si、Δv与Sj无线性关系.构造检验统计量,计算出跟驰行驶时目标车速度变化量的F值为5.93,侧向车变道时目标车速度变化量的F值为8.64,通过查F分布分位数表可知,分位数为0.9、自由度为(1, 176)情况下的拒绝域为{F≥F0.9 (1, 100)=2.73},F值均落在拒绝域内,所以拒绝原假设,回归是显著的.说明建立的模型计算目标车辆速度变化量具有较高的置信度,该模型可有效地分析车辆跟驰行驶及侧向变道时的车速变化量.
5 结论1) 类比势能场理论中引力和斥力,建立了考虑势能场影响区域的车辆交互速度变化模型,定量描述了车辆速度变化规律,并给出跟随前车行驶时及侧向车辆变道时的目标车速度变化公式.
2) 势能场影响区域形状参数与车辆速度相关,车辆速度越大,势能场影响区域越大;目标车速度变化量随势能场影响区域交互面积Si、Sj线性相关,Si偏离Si*越大或Sj偏离Sj*越大,目标车的速度变化量越大;通过参数标定和检验,发现该速度变化模型计算的目标车速度变化量与实际值的误差小于15%,从而验证了模型的有效性.所建模型为微观交通流仿真提供了新方法,同时可为自动驾驶车辆的车速控制策略提供一定的理论依据.
3) 数据采集路段为双向8车道的城市主干路,对于标定的参数并不适用于交通密度较大、车辆之间干扰较大的城市道路.后续研究将对城市主干道、交叉口等区域的车辆交互进行分析,进一步优化模型,提高模型的适用范围.
参考文献
[1] PARYS R V, PIPELEERS G. Online distributed motion planning for multi-vehicle systems[C]// Proceedings of European Control Conference. Naples: IEEE, 2016: 1580
[2] YUAN S C, CHUN S A, SPINELLI B, et al. Traffic evacuation simulation based on multi-level driving decision model[J]. Transportation Research Part C: Emerging Technologies, 2017, 78: 129. DOI:10.1016/j.trc.2017.03.001
[3] 贾洪飞, 隽志才. 基于期望间距的车辆跟驰模型的建立[J]. 中国公路学报, 2000, 13(4): 86.
JIA Hongfei, JUN Zhicai. Development of a car-following model based on desired spacing[J]. China Journal of Highway and Transport, 2000, 13(4): 86. DOI:10.3321/j.issn:1001-7372.2000.04.020
[4] RILETT L R, HUTCHINSON B G, WHITNEY M. Mechanics of the passing maneuver and the impact of large trucks[J]. Transportation Research Part A: Policy and Practice, 1990, 24(6): 121.
[5] 许伦辉, 倪艳明, 罗强, 等. 基于最小安全距离的车辆换道模型研究[J]. 广西师范大学学报(自然科学版), 2011, 29(4): 1.
XU Lunhui, NI Yanming, LUO Qiang, et al. Research on vehicle lane change model based on minimum safe distance[J]. Journal of Guangxi Normal University (Natural Science Edition), 2011, 29(4): 1. DOI:10.3969/j.issn.1001-6600.2011.04.001
[6] LI Li, CHEN Xiqun. Vehicle headway modeling and its inferences in microscopic traffic flow theory:a survey[J]. Transportation Research Part C: Emerging Technologies, 2017, 76: 170. DOI:10.1016/j.trc.2017.01.007
[7] PANDEY G, RAO K R, MOHAN D. Modelling vehicular interactions for heterogeneous traffic flow using cellular automata with position preference[J]. Journal of Modern Transportation, 2017, 25(3): 163.
[8] 何流, 李旭宏, 卢静. 基于动态广义势能场的行人微观模型及仿真[J]. 系统仿真学报, 2014, 26(11): 2558.
HE Liu, LI Xuhong, LU Jing. Microscopic pedestrian modeling and simulation based on dynamic generalized potential field[J]. Journal of System Simulation, 2014, 26(11): 2558.
[9] 冀杰, 彭和, 迟文俊, 等.基于危险势能场的车辆避障驾驶行为决策分析[C]//2015中国汽车工程学会年会.上海: 中国汽车工程学会, 2015: 67
JI Jie, PENG He, CHI Wenjun, et al. Decision making for vehicle collision avoidance based on dangerous potential field[C]//Proceedings of 2015 Annual Meeting of China Automotive Engineering Society. Shanghai: China SAE, 2015: 67
[10] MA Y L, ZHANG P, HU B Y. Active lane-changing model of vehicle in B-type weaving region based on potential energy field theory[J]. Physica A: Statistical Mechanics and its Applications, 2019, 535: 122291. DOI:10.1016/j.physa.2019.122291
[11] KESTING A, TREIBER M, HELBING D. General lane-changing model mobile for car-following models[J]. Transportation Research Record Journal of the Transportation Research Board, 2007, 1999(1): 86. DOI:10.3141/1999-10
[12] BOUNINI F, GINGRAS D, POLLART H, et al. Modified artificial potential field method for online path planning applications[C]//Proceedings of 2017 IEEE Intelligent Vehicles Symposium (Ⅳ). Redondo Beach: IEEE, 2017: 180
[13] MOCHOLí-SALCEDO A, ARROYO-Nú?EZ J H, MILIáN-SáNCHEZ V M, et al. Magnetic field generated by the loops used in traffic control systems[J]. IEEE Transactions on Intelligent Transportation Systems, 2017, 18(8): 1. DOI:10.1109/TITS.2017.2726239
[14] BUDHKAR A K, MAURYA A K. Multiple-leader vehicle-following behavior in heterogeneous weak lane discipline traffic[J]. Transportation in Developing Economies, 2017, 3(2): 20. DOI:10.1007/s40890-017-0049-6
[15] KWAME A B B, RYAD C, YAW A A, et al. An overview of nature-inspired, conventional, and hybrid methods of autonomous vehicle path planning[J]. Journal of Advanced Transportation, 2018, 2018: 1.
