Jinjun Hu, Yongqiang Yang,Yingjun Guan
(Key Laboratory of Earthquake Engineering and Engineering Vibration, Institute of Engineering Mechanics, China Earthquake Administration, Harbin 150080, China)
Abstract:
Ground vibration accelerations caused by the collapse of blasting demolition of urban viaducts was recorded in ordered to analyze the engineering characteristics and effects on the surrounding buildings. Through the analysis of peak ground acceleration, peak frequency, duration and response spectra of the recorded vibrations in different acceleration arrays, some conclusions are drawn: the peak ground acceleration decreases with increasing distance, and the amplitude of vertical component is higher than that of the horizontal components, especially in near source region. The peak frequency of ground acceleration decreases with distance, and in near source region, it is larger than the natural frequency of the surrounding buildings, and thus it will not have much effect on the buildings. The duration of ground acceleration caused by collapse is longer than that caused by blasting itself. The vertical response spectrum is the largest of the three components, and it decreases rapidly in the near source region of about 30 m, but beyond that the distance decreases slowly. The horizontal components are smaller than the local seismic design spectrum, while the vertical component for natural period under 0.15 s exceeds the seismic design spectrum, but the natural periods of general buildings are usually beyond that domain, so this will not have much effect on the nearby buildings.
Key words: urban viaduct blasting demolition ground vibration vibration effect
DOI:10.11916/j.issn.1005-9113.2016.06.003
Clc Number:TU375
Fund:
Jinjun Hu, Yongqiang Yang, Yingjun Guan. Engineering Characteristics of Ground Vibration Caused by Blasting Demolition of Urban Viaducts[J]. Journal of Harbin Institute of Technology, 2016, 23(6): 17-25. DOI: 10.11916/j.issn.1005-9113.2016.06.003.

Fund Sponsored by the National Natural Science Foundation of China (Grant No.51578516 and 51238012), the Basic Research Foundation of Institute of Engineering Mechanics, CEA (Grant No.2011B02), 973 Program (Grant No.2011CB013601) and the Wuhan Blasting Company Corresponding author E-mail: hujinjun@iem.ac.cn Article history Received: 2015-07-03
Contents Abstract Full text Figures/Tables PDF
Engineering Characteristics of Ground Vibration Caused by Blasting Demolition of Urban Viaducts
Jinjun Hu

 , Yongqiang Yang, Yingjun Guan
 Key Laboratory of Earthquake Engineering and Engineering Vibration, Institute of Engineering Mechanics, China Earthquake Administration, Harbin 150080, China
Received: 2015-07-03
fund: Sponsored by the National Natural Science Foundation of China (Grant No.51578516 and 51238012), the Basic Research Foundation of Institute of Engineering Mechanics, CEA (Grant No.2011B02), 973 Program (Grant No.2011CB013601) and the Wuhan Blasting Company
Corresponding author: E-mail: hujinjun@iem.ac.cn
Abstract: Ground vibration accelerations caused by the collapse of blasting demolition of urban viaducts was recorded in ordered to analyze the engineering characteristics and effects on the surrounding buildings. Through the analysis of peak ground acceleration, peak frequency, duration and response spectra of the recorded vibrations in different acceleration arrays, some conclusions are drawn: the peak ground acceleration decreases with increasing distance, and the amplitude of vertical component is higher than that of the horizontal components, especially in near source region. The peak frequency of ground acceleration decreases with distance, and in near source region, it is larger than the natural frequency of the surrounding buildings, and thus it will not have much effect on the buildings. The duration of ground acceleration caused by collapse is longer than that caused by blasting itself. The vertical response spectrum is the largest of the three components, and it decreases rapidly in the near source region of about 30 m, but beyond that the distance decreases slowly. The horizontal components are smaller than the local seismic design spectrum, while the vertical component for natural period under 0.15 s exceeds the seismic design spectrum, but the natural periods of general buildings are usually beyond that domain, so this will not have much effect on the nearby buildings.
Key words: urban viaduct blasting demolition ground vibration vibration effect
1 IntroductionBlasting demolition springs up on the background of clearing remaining constructions after the World WarⅡ. Nowadays, the techniques of blasting demolition have been greatly improved, which supply a choice for the demolition of engineering structures. Due to the advantage of blasting demolition, it is commonly used in some cities in China. Compared with traditional artificial demolition, blasting demolition has its advantages, like short demolishing time, low labor strength, high efficiency and more safety. So far, blasting demolition is widely used throughout the world, especially, it has broad prospects of application in developing countries[1-2].
Although blasting demolition can bring great economic benefit, it can also bring a series of negative effects. Among all the negative effects, the vibration effects is the one which may cause certain damage to surrounding constructions due to the vibration of ground motion caused by the impact of components of structures. At present, the estimation of vibration caused by blasting demolition is by empirical equations or numerical analyses. However, the empirical equations are usually summarized from blasting experiments and practice which has great uncertainty. In recent years, with the rapidly development of monitoring techniques and computer techniques, scholars are paying closer attention to the environment safety, and some strict codes on safety and environment protections have been released. Blasting demolition needs to abandon the way of over relying on experience, and turn to the way of utilizing modern techniques so as to make blasting demolition more scientific, predictable and accurate.
In recent years, some scholars gradually began to focus on the study of blasting vibration. Long et al. studied the signal processing method from blasting vibration[3]. Wei et al. simulated the lasting vibration response in Qingdao undersea tunnels, expecting to provide references for engineering construction and monitoring[4]. Xu and Yao studied the influence of vibration caused by building blasting demolition on structures[5-6]. By comparing the empirical attenuation formulas with the test data of blasting vibration, Zhou pointed out that vibration can be reduced more than 70% if vibration isolation measures were used[7]. The aforementioned studies concentrated more on the vibration caused by blasting itself, however, engineering practices have shown that the ground vibration caused by impact to the ground of blasted structure or components is usually greater than that by blasting itself[8-10], this result can be also seen in the following analysis.
The vibration caused by collapse of blasting demolition is quite different from natural seismic ground motion. As a result, in this paper we use acceleration sensors arrays to measure the ground motion acceleration caused by collapse of blasted urban viaducts, aiming at characterizing the attenuation features of ground vibration with distance, as well as evaluating the vibration influence on existing structures, so as to provide references for making blasting techniques more accurate[11].
2 Blasting Demolition Viaduct and Vibration Measuring Method2.1 Introduction to the Blasting Demolition ViaductThe blasting demolition viaduct located in the downtown of Wuhan, China. The total length to be demolished is about 3 500 m. The viaduct has altogether 181 spans, and it crosses five main roads. Figs. 1 and 2 show parts of the viaduct and the piers to be demolished. The surrounding environments of the viaduct are extremely complicated. It is under the high-voltage wire and on top of the underground gas pipelines. It is surrounded by buildings, and the nearest building is only about 30 m to the viaduct.
Figure 1
 Figure 1 Plan view of the viaduct to be demolished and the three accelerator arrays
 Figure 2
 Figure 2 Side view of the viaduct and the piers to be demolished
 According to the blasting demolition plane, the blasting starts from the middle pier of the viaduct (Fig. 1) , and propagates bilaterally to both ends of the viaduct. All piers get blasted by using drilling blasting; the time delay between every two piers is 310 ms. Scattering fragments of blasting are prevented by covering materials, and steel plate on the ground. Sandbags and used tires are set around the piers as vibration reduction measures to protect pipelines underground.
2.2 Vibration Measuring MethodThe viaduct gets blasted from middle to both ends. Considering the viaduct's symmetry feature, three measuring arrays were set to the north part of the viaduct, right on the east side, so as to monitor and measure the ground vibration accelerations. Detailed schemes are as follows:
1) Considering the long length of the viaduct, tree line arrays were set to record the vibration in different parts of the viaduct, including Arrays 1-3. Each line array includes 5 sets of sensors installed perpendicular to the viaduct axis (as shown in Fig. 1) .
2) In order to investigate the attenuation characteristics of ground vibration with distance, for each line array, the sensors were installed at the site with distance of 15 m, 30 m, 45 m, 75 m and 120 m to the edge of the viaduct deck, respectively. They were named from ①-⑤ accordingly.
3) In order to investigate the difference of ground vibrations in different directions, at each observation point, three sensors were installed in the radial direction (vertical to the viaduct's axis), the tangential direction (parallel to the viaduct's axis), and the vertical direction (as shown in Fig. 3) .
Figure 3
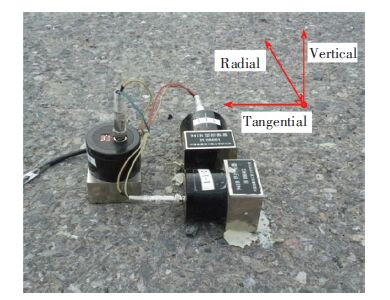 Figure 3 Acceleration sensors at each observation point
 Totally, the whole observation system contains 3 line arrays, and each line array includes 5 observation points, and each observation point includes 3 sensors. So accordingly, 45 acceleration sensors were installed in all.
3 Engineering Characteristics of Ground Vibration AccelerationAll 45 acceleration sensors (Fig. 1) successfully recorded the complete time history of ground vibration caused by blasting and collapse, making altogether 45 records. In order to characterize the ground vibration acceleration attenuation and acceleration cumulative effects, From Figs. 4 and 5, the wave form of recorded accelerations is similar with the natural earthquake ground motions, but the vertical component is larger than the horizontal ones, which is opposite to the characteristics of natural seismic ground motion. This is because the ground motion of natural earthquake is caused mostly by the movement of fault in horizontal direction, while the ground motion is mainly caused by the vertical impact of falling down components of buildings or bridges. Fig. 5 shows a set of measured ground accelerations for different sensors in Array 1, and Fig. 6 shows a set of measured ground accelerations for the same sensors in Array 1-3. From these figures, there shows almost no distinct ground vibrations caused by the blasting itself.
Figure 4
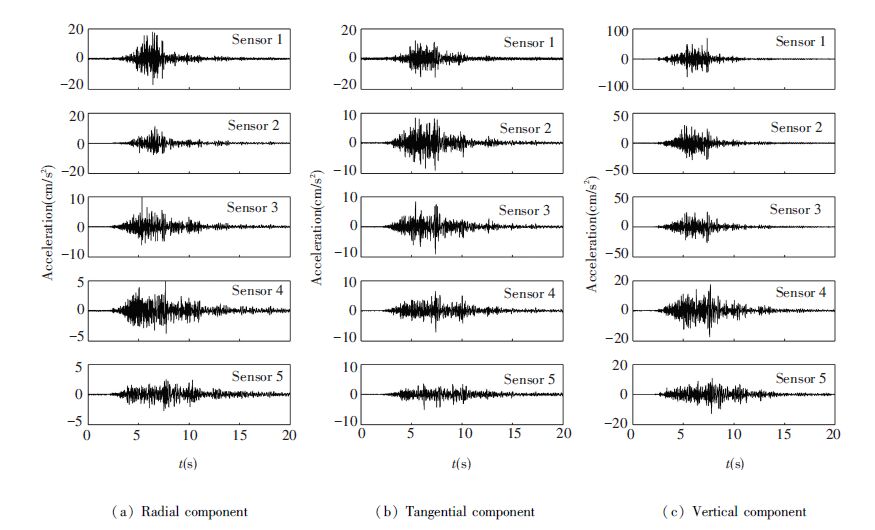 Figure 4 Ground vibration acceleration time histories of all sensors in Array 1
 Figure 5
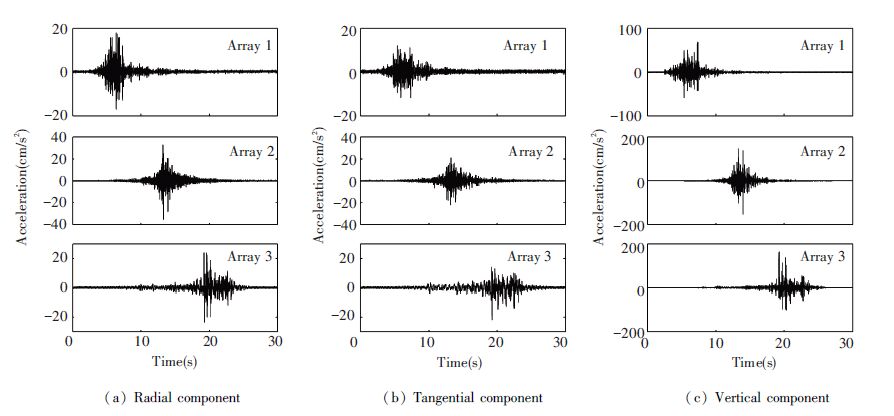 Figure 5 Ground vibration acceleration time histories of sensor 1 in Array 1, Array 2 and Array 3
 3.1 Attenuation of Peak Ground AccelerationPeak ground acceleration is often used to describe the intensity of vibration.It is usually the most important parameter of a ground motion in earthquake engineering. According to the measured recordings, this paper analyzed the attenuation features of peak ground acceleration for the tree line arrays, as shown in Table 1 and Fig. 6. To conclude the results, firstly, by comparing acceleration data of different line array, it can be deduced that the peak acceleration in each line has a similar attenuation law with distance, but the peak value in line array 1 is obviously smaller than that of the other two line arrays, which is due to the blasting process. Specifically, line array 1 is located at the blast starting point where acceleration cumulative effects are the least. Whereas, line array 2 and line array 3 are located at the middle and end of the viaduct, respectively. So they have considerable acceleration cumulative effects. Secondly, by comparing acceleration data in different directions, it can be found that the peak acceleration in the vertical direction is significantly greater than that in the horizontal directions. For instance, in the observation point ① (sensor 1) with a distance of 15 m to the viaduct, the vertical peak ground acceleration is about 4 to 8 times of the horizontal directions. For observation point ⑤ (sensor 5) with a distance of 120 m to the viaduct, the difference turns to be 1.5 to 2. Thirdly, by comparing peak acceleration in two horizontal directions of each array, it can be concluded that the peak acceleration in both radial and tangential directions attenuate very slowly as the distance increases, and there is little difference between these two directions overall. This result can be used in revising the attenuation relationships and the study of controlling method for collapsing vibration[12-16].
表 1
Point ①1.5 mPoint ②3.0 mPoint ③ 4.5 mPoint ④ 7.5 mPoint ⑤ 1.2.0 m
Radial17.810.99.74.82.5
1Tangential11.49.28.86.85.0
Vertical66.428.625.217.412.5
Radial34.215.94.27.04.0
2Tangential17.020.817.613.77.7
Vertical145.467.959.737.018.5
Radial23.813.49.37.74.9
3Tangential21.610.215.49.18.9
Vertical164.576.542.823.212.1
Table 1 Peak ground acceleration of each observation point
3.2 Variation of Peak Frequency with DistanceThe peak frequency of vibration acceleration caused by blasting and structural collapse, also known as predominant frequency, reflects the main frequency characteristic of ground vibration. It is obtained from the Fourier spectrum of ground vibration time histories. Structure with natural frequency equal or similar to the peak frequency of the input ground vibration is subject to sustain a most severe impact, which means that the vibration is most harmful to structure with that natural frequency. Fig. 7 and Table 2 provide the vibration acceleration peak frequency distribution at all directions from all the observation points.
Figure 6
 Figure 6 Attenuation of peak ground accelerations
 表 2
Point ① 1.5 mPoint ② 3.0 mPoint ③ 4.5 mPoint ④ 7.5 mPoint ⑤ 1.2.0 m
Radial12.77.86.06.05.6
1Tangential14.66.36.26.95.6
Vertical14.66.06.16.15.4
Radial31.215.526.09.66.3
2Tangential7.27.57.56.86.3
Vertical11.214.99.310.29.3
Radial4.66.04.82.62.0
3Tangential1.72.03.32.11.8
Vertical4.64.64.64.83.5
Table 2 Peak frequency of each observation point
Concluding the findings, due to the vibration reduction facilities around the piers, the peak frequency in this viaduct blasting collapse vibration is somewhat lower. In array 1, the peak frequencies of all three directions show an exponentially declining tendency with distance, however, in Arrays 2 and 3, there is no such evident tendency and the peak frequency of three directions differ from each other. This difference may attribute to the time delay of blasting. Array 1 located at the initial blasting point, it will sustain a less significant superposition effect than the other two arrays, causing the peak frequency of these two arrays have little clear declining tendency with distance. By comparing the peak frequency of tangential directions in three arrays, the values of array 1 are the greatest, while that of array 2 comes second, and the array 3 is the smallest, which verifies the most evident superposition effects of tangential direction vibration.
In addition, from the above results, it can be inferred that for the first site which is the nearest to the viaduct, it usually has the greatest peak frequency caused by collapses of viaduct, but this value is still smaller than the natural frequency of the surrounding building structures. So it will not cause the significant impact on the nearby building.
Figure 7
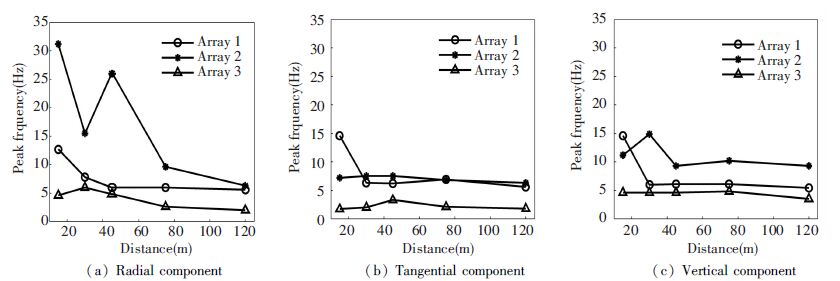 Figure 7 Variation of peak frequency with distance
 3.3 Variation of Vibration Duration with DistanceDuration (lasting time of ground motion) is one of the three essential factors of ground motion parameters in earthquake engineering, which can reflect the ability of potential destruction ability of ground motion. It contributes a lot to the structural damage, and the increase of duration will produce cumulative deformation and damage to the structure[17]. There are various definitions for the duration, among which the significant duration is often used in engineering[18]. It is defined as the time interval between the 5%-95% energy of the ground motion time history (as shown in Eqs.(1) -(3) ).
Supposing a(t) is the time history of ground motion, and the energy for each time is shown as follows:
${{\int }_{t}}^{t}{{a}^{2}}\left( t \right)dt$ (1)
After been normalized
$I\left( t \right)={{\int }_{t}}^{t}{{a}^{2}}\left( t \right)dt/{{\int }_{T}}^{T}{{a}^{2}}\left( t \right)dt~$ (2)
where T is the total duration time of the whole ground motion, so the significant duration Td is defined as:
$Td={{T}_{2}}-{{T}_{1}}~\begin{matrix} I\left( {{T}_{1}} \right)=0.05 \\ I\left( {{T}_{2}} \right)=0.95 \\\end{matrix}$ (3)
where T1 and T2 represents the time for 5% and 95% accumulated energy of ground motion, respectively.
The duration analysis results are shown in Fig. 8 and Table 3. It can be concluded that with the increase of distance, acceleration durations of three directions all become longer, and among all three component, the duration of the radial component and tangential components are both greater than that of the vertical one's. This is because the significant duration is only related to the strong shaking period of the time history. Usually, with increasing distance the amplitude attenuates very fast. The duration of ground acceleration caused by viaduct collapses is longer than that of the explosion and heavy tamping[19-21], while it is comparable to the seismic ground motion duration for a small to moderate magnitude earthquake. And this results from the vibration reduction facilities of sandbags and tires. Although the vibration reduction facility evidently decreases the peak of acceleration, meanwhile, it decreases the peak frequency of ground vibration and increases its duration. However, lower peak frequency and longer duration are adverse to buildings around. This result indicates that it is necessary to take an overall consideration of the impact on both peak and duration when adopting vibration reduction measures.
Figure 8
 Figure 8 Variation of vibration duration with distance
 表 3
Point ① 1.5 mPoint ② 3.0 mPoint ③ 4.5 mPoint ④ 7.5 mPoint ⑤ 1.2.0 m
Radial7.311.110.419.725.5
1Tangential14.210.014.214.414.3
Vertical6.99.310.410.511.0
Radial7.012.46.315.618.9
2Tangential11.313.513.915.618.8
Vertical5.54.17.37.612.7
Radial6.07.79.09.313.3
3Tangential7.38.07.811.09.2
Vertical2.95.17.37.89.2
Table 3 Duration of each observation point
3.4 Characteristics of Response SpectraThe spectra components of ground vibration have great impact on structures. Ground vibration is not simple harmonic vibration, but a vibration with changing amplitude and frequency. For a certain ground vibration, it can be regarded as a combination of various harmonic vibrations with different frequencies. In order to analyze the impact of ground vibration caused by collapse structures, the ground vibration response spectra of the recordings are required. Response spectrum is often used in earthquake engineering, it is defined as the maximum response of the input ground motion for a series of single degree of freedom structures with different natural periods.
Figs. 9-11 show the variation of response spectra with distance for each component of the three arrays. It can be seen that: for the same site, the spectrum of vertical component is the largest, and that of tangential is the smallest; the response spectrum decreases rapidly with increasing distance, especially in the distance of 15 m to 30 m. The predominant period of peak response spectrum is usually lower than 0.2 s. Like the peak acceleration and peak frequency, the superposition effect of response spectrum in the tangential component is clearer than that in the other components. This may attribute to the bloating direction which is parallel to the tangential component. The distance between the two line arrays is about 700 m, considering the time delay of about 0.31 s for each span (about 20 m), thus the interval between the blasting time of the two line arrays is about 10 s. The time delay can be also seen in Fig. 5.
Figure 9
 Figure 9 Response spectra in Array 1
 Figure 10
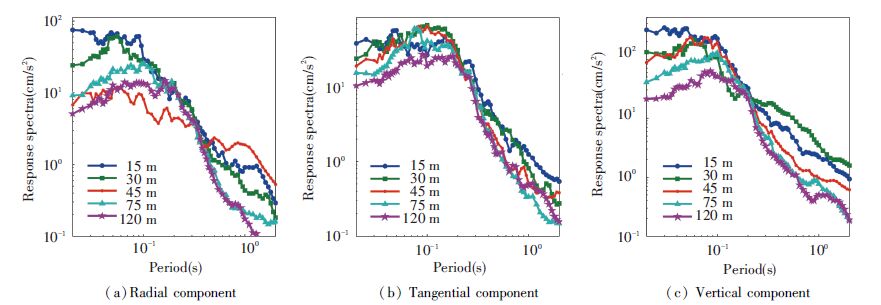 Figure 10 Response spectra in Array 2
 Figure 11
 Figure 11 Response spectra in Array 3
 In order to analyze the impact of ground vibrationon the nearby buildings, comparison between the design spectra of seismic code for buildings and the mean response spectra of each line array are shown in Fig. 12. Conclusions can be drawn as follows: vibration reduction facilities utilized in this project reduce the amplitude of ground vibration. According to the seismic design code, the seismic design peak acceleration for this area is 0.05g. The nearest building is about 30 m away from the viaduct, and at where the peak ground vibration has attenuated to near or smaller than the local seismic design peak acceleration. Also according to the seismic design code, the seismic design spectrum is 0.1g for this place, and the predominant site period ranges from 0.25 s to 0.65 s according to different site classes. If the most unfavorable conditions are taken into account, namely, taking the minimum natural period of structure 0.25 s, the blasting can bring to the structure a maximum response of 0.04g, mere 1/2.5 of the local design spectrum. Therefore, the conclusions above clearly shows that the ground vibration caused by the explosion or collapse will not have significant effect on the long period buildings or structures.
Figure 12
 Figure 12 Comparison between mean response spectra and seismic design spectra
 4 ConclusionsBy analyzing the peak ground vibration, peak frequency, duration and response spectra caused by blasting demolition and collapse, the following conclusions can be drawn:
1) In peakacceleration aspect: for ground vibration caused by collapse, the value of vertical component is the biggest, while that of tangential direction is the smallest. Acceleration attenuates fast in near source distance, but as the distance increases, it attenuations rapidly; and the vertical component has a faster attenuation speed than that of the horizontal components.
2) In peak frequency aspect: the peak frequency of ground vibration attenuates with distance, and in the near-filed it is larger than the natural frequency of normal buildings, so it will not have much effect on the surrounding buildings; and as the distance increases, although the peak frequency becomes close to the natural frequency of buildings, the peak acceleration also decreases, causing very little impact on buildings around.
3) In ground vibration duration aspect: compared with the explosion and heavy tamping, the duration of ground vibration caused by collapse is evidently longer, and it is similar to that of a small to moderate magnitude earthquake. This is related to the adoption of vibration reduction facilities and superposition effects of collapse by multi-segments of viaducts. Vibration reduction facilities significantly decrease the acceleration peaks, but it lowers the peak frequency and increases the duration.
4) In acceleration response spectra aspect: like the feature of the peak vibration acceleration, the response spectrum of the vertical component is the largest, and the tangential one is the smallest; response spectrum decreases as the distance increases, and it decreases the fastest among the distance between 15 m and 30 m, then it decreases slowly; the natural period of the peak response spectrum is very low, normally less than 0.2 s.
5) Comparison between local seismic design spectrum and collapsing ground vibration: the horizontal (radial and tangential) components of the mean response spectra are smaller than the seismic design spectra, and only the vertical component for natural period less than 0.15 s exceeds the design spectra. However, the natural periods of buildings are barely less than 0.15 s, so it will not have significant effect on the surrounding building and long period structures.
References
[1]Xu S L, Zheng X Z, Wang X L, et al. Brief description about current situation of demolition blasting at home and abroad.Blasting, 2003, 20(2): 20-23.(
 0)
0)[2]Wang X G, Yu Y L. Demolition blasting technology faced with the 21 century.Engineering Blasting, 2000, 16(1): 32-35.(
 0)
0)[3]Long L, Xie Q M, Zhong M S, et al. Research on trend removing methods in preprocessing analysis of blasting vibration monitoring signals.Engineering Mechanics, 2012, 29(10): 63-68.(
 0)
0)[4]Yu L Y, Li S C, Xu B S. Study on the effect of blasting vibration for Qingdao twin subsea tunnels.China Civil Engineering Journal, 2010, 43(8): 100-108.(
 0)
0)[5]Xu Z P. Research of Collapse Course and Ground Vibration in Demolishing Building by Blasting.Changsha: Changsha University of Science & Technology, 2004.(
 0)
0)[6]Yao Q. Safety Analysis of Nearby Building Structure under Collapse Vibration Blasting Demolition.Wuhan: Wuhan University of Technology, 2007.(
 0)
0)[7]Zhou J H. Discussion on calculation formula of collapsing vibration velocity caused by blasting demolition.Engineering Blasting, 2009, 15(1): 1-5.(
 0)
0)[8]Wang J P. Analysis of the Influence of Blasting Seismic Wave on Nearby Structures.Wuhan: Wuhan University of Technology, 2005.(
 0)
0)[9]Xue A Z. Blasting Vibration Character and the Study of Influence on Structure.Qingdao: Shandong University of Science and Technology, 2008.(
 0)
0)[10]Zong Q, Wang H B, Zhou S B. Research on monitoring and controlling techniques considering effects of seismic shock.Chinese Journal of Rock Mechanics and Engineering, 2008, 27(5): 938-945.(
 0)
0)[11]Guo Y L, Zuo Y J, Wang D A. Discussion on collapse vibration caused by demolition blasting.Proceedings of the New Development on Engineering Blasting. Beijing, 2007.(
 0)
0)[12]Hernrch J. The Dynamics of Explosion and Its Use.Amsterdam and New York: Elsevier Scientific Publishing Company, 1979.(
 0)
0)[13]Chi E A, Zhang Y P. Analysis on control technology for collapsing vibration generated by building demolition blasting.Journal of Coal Science and Engineering, 2010, 16(3): 262-266.DOI:10.1007/s12404-010-0308-1(
 0)
0)[14]Gutowski T G, Dym C L. Propagation of ground vibration: A review.Journal of Sound and Vibration, 1976, 49(2): 179-193.DOI:10.1016/0022-460X(76)90495-8(
 0)
0)[15]Dong S K, Lee J S. Propagation and attenuation characteristics of various ground vibrations.Soil Dynamics and Earthquake Engineering, 2000, 19: 115-126.DOI:10.1016/S0267-7261(00)00002-6(
 0)
0)[16]Woods R D, Jedele L P. Energy-attenuation from construction vibrations.Vibration Problems in Geotechnical Engineering, ASCE, 1985: 229-246.(
 0)
0)[17]Tiwari A K, Gupta V K. Scaling of ductility and damage-based strength reduction factors for horizontal motions.Earthquake Engineering Structure Dynamics, 2000, 29(7): 969-987.DOI:10.1002/(ISSN)1096-9845(
 0)
0)[18]Justin J K, Jonathan P S. Prediction equations for significant duration of earthquake ground motions considering site and near-source effects.Earthquake Spectra, 2006, 22(4): 985-1013.DOI:10.1193/1.2358175(
 0)
0)[19]Wang W P, Qin X D. Influence distance of high-energy level dynamic compaction to existed building determined by vibration attenuation test.Exploration Engineering-Rock & Soil Drilling and Tunneling, 2010, 37(12): 61-64.(
 0)
0)[20]Li Z. The Study of Relativity between Heavy Tamping Vibration Attenuation and Ground Medium Character.Beijing: China University of Geosciences, 2002.(
 0)
0)[21]Lin J Q. The measuring of explosive acceleration for several problems.Rock and Soil Mechanics, 1984, 5(1): 57-63.(
 0)
0)