 , 许潇锋
, 许潇锋
 , 杨晓玥, 谢丽凤
南京信息工程大学气象灾害预报预警与评估协同创新中心, 中国气象局气溶胶与云降水重点开放实验室, 南京 210044
收稿日期: 2020-03-21; 修回日期: 2020-04-15; 录用日期: 2020-04-15
基金项目: 国家重点研发计划(No.2016YFA0602003,2018YFC1506502)
作者简介: 吴浩(1994-), 女, E-mail:corrinerania@outlook.com
通讯作者(责任作者): 许潇锋, E-mail:xxf@nuist.edu.cn
摘要:利用MERRA-2再分析资料和CALIPSO星载激光雷达产品,分析了1980—2017年青藏高原和塔克拉玛干沙漠上空沙尘气溶胶的分布和传输特征.对比了MERRA-2与AERONET及MISR的气溶胶光学厚度(AOD)产品,其相关系数分别为0.809和0.776.基于MERRA-2资料分析表明,研究区域沙尘光学厚度(DAOD)按春、夏、秋、冬季依次递减.塔克拉玛干沙漠和青藏高原地区DAOD均在5月达最高值.青藏高原北部DAOD比南部高0.06~0.10,两地区的DAOD值差异在5月最高.自2000年开始,塔克拉玛干沙漠和印度恒河平原DAOD高值区强度和影响范围显著增大,对青藏高原的沙尘输送增强,印度沙尘对青藏高原的影响显著增加.CALIPSO观测表明,青藏高原上空的沙尘主要来自塔克拉玛干沙漠,传输量春季最大,秋、冬季最小;部分来自印度恒河平原,传输主要发生在夏、秋季.塔克拉玛干沙尘通过柴达木盆地向青藏高原传输,最远可至30°N,传输高度在4~8 km.冬季青藏高原上空的沙尘主要来自柴达木盆地.塔克拉玛干沙漠和青藏高原的最大气溶胶消光系数廓线分别出现在春季和夏季.塔克拉玛干沙漠和青藏高原地区沙尘层厚度多年平均值分别为1.00和0.82 km.2007—2017年,塔克拉玛干沙尘层厚度呈下降趋势,年下降率为0.018 km.青藏高原沙尘层厚度春季最大,冬季次之,夏季最小;沙尘层厚度年变化趋势不显著.
关键词:沙尘气溶胶光学厚度(AOD)青藏高原塔克拉玛干沙漠区域传输
Three-dimensional distribution and transport characteristics of dust over Tibetan Plateau and surrounding areas
WU Hao
 , XU Xiaofeng
 , YANG Xiaoyue, XIE Lifeng
Collaborative Innovation Center on Forecast and Evaluation of Meteorological Disasters, Key Laboratory for Aerosol-Cloud-Precipitation of China Meteorological Administration, Nanjing University of Information Science&Technology, Nanjing 210044
Received 21 March 2020; received in revised from 15 April 2020; accepted 15 April 2020
Abstract: The distribution and transportation characteristics of dust aerosol over the Tibetan Plateau (TP) and Taklimakan Desert (TD) are analyzed during 1980—2017 using MERRA-2 (second Modern-Era Retrospective analysis for Research and Applications) and CALIPSO (Cloud-Aerosol Lidar and Infrared Pathfinder Satellite Observations) products. The aerosol optical depths (AOD) of MERRA-2 are compared with those of AERONET (Aerosol Robotic Network) in Nam-co site and the corresponding MISR (Multi-angle Imaging Spectro Radiometer) data. The correlation coefficients are 0.809 and 0.776, respectively. The variations of seasonal AOD and dust AOD (DAOD) over the research region are similar, showing the values from high to low are in the order of spring, summer, autumn and winter, respectively. The highest value of DAOD over the TD and the TP both appears in May. The DAOD of the northern TP is 0.06~0.10 higher than that of the southern TP, and the difference of DAOD between northern TP and southern TP shows the highest in May. Since 2000, the strength and area of the high DAOD region over the TD and the Indo-Gangetic Plain (IGP) have increased, which enhanced the transportation of dust from the two source regions. Furthermore, the dust from the IGP shows an increasing impact on the TP. Observations of CALIPSO suggest that the dust over the TP comes mainly from the TD, with the largest dust transport volume in spring and the smallest in autumn and winter, and partly from the IGP, with the transmission occurring mainly in the summer and autumn. The dust moves from the TD to the TP is mainly through the Qaidam Basin in the layer of 4~8 km aloft and could transport as far as 30°N. The dust over the TP in winter mainly comes from frequent sandstorms occurred in the Qaidam Basin. The largest profile of dust extinction coefficient over the TD and the TP appears in spring and summer, respectively. The average dust layer thickness in the TD and TP are 1.00 km and 0.82 km respectively. From 2007 to 2017, the dust layer thickness of the TD decreases significantly, with an annual decline rate of 0.018 km. The dust layer thickness of the TP reaches the first and second maximum in spring and winter, respectively, and the minimum in summer. The annual trend of dust layer thickness over the TP is not significant.
Keywords: dustAODTibetan PlateauTaklimakan Desertregional transport
1 引言(Intoduction)沙尘气溶胶是一种重要的大气气溶胶类型(Huang et al., 2006), 在影响地球辐射平衡和区域气候等方面都起着重要作用(刘贞等, 2016;魏巍等, 2018).它一方面通过吸收和散射太阳辐射直接改变地-气系统的辐射收支;另一方面通过改变云滴和冰晶粒子尺度等云微物理特性及其生命周期来影响辐射平衡(石广玉等, 2008;Chen et al., 2017).中国地区的沙尘主要来自西北地区和内蒙古一带, 其中, 塔克拉玛干沙漠是东亚地区主要的沙尘来源地(延昊等, 2001).同时, 沙尘气溶胶也是青藏高原地区的主要气溶胶类型(Xu et al., 2015;赵竹子, 2015).高原产生的强对流会促进气溶胶垂直输送, 增加对流层和平流层中气溶胶含量(Zhou et al., 2009;Vernier et al., 2015).部分细颗粒物随西风急流被输送到北太平洋上空, 通过沉降加强海洋生物泵效应, 从而对全球气候产生影响(Han et al., 2004).有研究表明, 青藏高原是影响北太平洋气溶胶负荷的最重要的沙尘源之一(Duce et al., 1980;Fang et al., 2004).针对青藏高原上空沙尘气溶胶传输特征的研究(Liu et al., 2008;Chen et al., 2013;Xu et al., 2015)表明, 高原北部的沙尘主要来自塔克拉玛干和戈壁沙漠, 而高原南部的沙尘主要来自印度西北部和巴基斯坦.目前, 青藏高原地区沙尘研究主要采用卫星遥感资料(CALIPSO、MISR、MODIS等的气溶胶产品)结合中尺度模式(WRF-Chem等)模拟结果开展特征分析(Dumka et al., 2010;Lau et al., 2010;Chen et al., 2013;Xu et al., 2014a;Liu et al., 2015).这些研究较好地揭示了高原上空气溶胶的时空分布和传输特征.但卫星遥感气溶胶产品自身存在局限性, 如受云和地表的影响等导致数据缺测.此外, 不同卫星的观测时期、传感器通道数量、时空分辨率及反演原理等不同, 导致不同卫星气溶胶产品难以统一进行综合分析.为了解决上述问题, NASA开发了新一代气溶胶再分析资料—MERRA-2.它综合运用戈达德地球观测系统(Goddard Earth Observing System, GEOS)的资料同化系统(Data Assimilation System, DAS)和GSI(Gridpoint Statistical Interpolation)大气分析方案同化了包括AVHRR、MODIS/Terra、MODIS/Aqua、MISR和AERONET等的气溶胶遥感产品(Gelaro et al., 2017), 建立了一个统一时空分辨率的长期气溶胶资料集, 其时间跨度为1980年至今, 空间分辨率为0.5°×0.625°.中国地区MERRA-2 AOD产品的有效性已经获得了一些验证, 也有一些****(Qin et al., 2018;Sun et al., 2019)利用MERRA-2 AOD产品分析了中国地区气溶胶时空变化特征.
除了水平分布, 气溶胶的垂直结构也是评估气溶胶气候效应的重要参数(Claquin et al., 1998).不同的气溶胶垂直分布会改变大气热力结构, 从而影响辐射平衡.目前, 利用激光雷达探测是研究气溶胶垂直结构的主要遥感手段.其中, CALIPSO搭载的CALIOP云气溶胶激光雷达获得广泛应用, 是研究气溶胶垂直变化的有效途径.与被动遥感探测相比, CALIPSO作为主动式星载激光雷达, 不但具备连续全天候观测能力, 还能获取气溶胶垂直变化特性.青藏高原及其周边广大区域地广人稀, 采用遥感观测是获取其总体特征的最有效手段.高原及其周边区域上空沙尘的垂直及水平输送是影响高原气候的重要因子.有研究指出(Sun et al., 2001;Ge et al., 2015), 由于独特的地形和天气条件, 塔克拉玛干沙漠的沙尘可以被抬升至5~10 km高度, 且可以持续滞空数天, 并向青藏高原远距离输送.此外, 在高空风影响下, 塔克拉玛干和戈壁沙漠的沙尘还会传输至中国东部、韩国、日本及太平洋上空(韩永翔等, 2005;熊洁等, 2013).其中, 冬、春季是塔克拉玛干沙尘输送最大时期(Murayama et al., 2001;Wang et al., 2005).
基于此, 本文利用长时间序列MERRA-2气溶胶产品分析青藏高原及其周边区域(图 1)沙尘气溶胶的长期时空变化特征, 利用CALIPSO的气溶胶廓线产品研究青藏高原上空沙尘的垂直分布及其传输特征, 并对高原及周边地区沙尘层的变化进行初步分析, 最后结合卫星资料和后向轨迹模式追踪了一次沙尘暴过程.
图 1(Fig. 1)
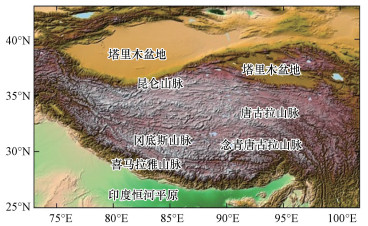 |
| 图 1 研究区域地形(73°~102°E, 25°~43°N) Fig. 1Topography of the study domain (73°~102°E, 25°~43°N) |
2 数据与方法(Data and methods)本文所用资料包括地面和卫星遥感气溶胶产品、MERRA-2气溶胶再分析产品和ERA-Interim气象场资料.
目前, 地面遥感中气溶胶反演精度最高的是利用太阳光度计进行遥感反演.全球气溶胶自动观测网(AERONET)采用法国CIMEL公司生产的CE-318型全自动太阳辐射计测得太阳直射辐射数据并反演得到气溶胶光学厚度(AOD), AERONET反演精准度可以达到0.01~0.02, 因此, AERONET的AOD通常被用作验证遥感数据准确性的参考基准.本文所用AERONET资料为纳木错站(30.773°N, 90.962°E)Level 2.0 AOD月均值数据, 时间为2006年8月—2017年12月.该资料用于MERRA-2 AOD产品的对比验证.
MISR是搭载在Terra卫星上的多角度成像光谱仪.MISR使用指向9个不同角度的传感器同时观测地球反射太阳辐射, 每个角度提供4个窄光谱波段(446、558、672和866 nm)的辐射测量和几何校准图像.凭借多角度优势, MISR可以获得沙漠等高反射地表上空的气溶胶特性(Martonchik et al., 2004).本文利用2001—2016年MISR Level3 AOD月均值数据对同期的MERRA-2 AOD进行对比验证.
CALIPSO上搭载的CALIOP激光雷达可以获取气溶胶垂直分布信息(刘刚等, 2008).作为主动式星载激光雷达, 它可以获取白天和夜间气溶胶的垂直高度、覆盖率及种类信息.CALIPSO将检测到的气溶胶分为7类, 即含沙尘海洋型、污染沙尘型、沙漠沙尘型、清洁大陆型、污染大陆(烟尘)型、海洋型、抬升烟尘型.其气溶胶产品主要有3类:层产品、廓线产品和VFM (Vertical Feature Mask)产品.从VFM产品可以读取沙尘类气溶胶的廓线信息(Kuang et al., 2015).CALIPSO Level 2产品的水平分辨率为5 km, 在0.5~20.2 km和20.2~30.1 km的范围内垂直分辨率分别为60 m和120 m(Proestakis et al., 2018).本研究利用2007—2017年CALIOP Level2 4.20数据集的532 nm气溶胶层产品、VFM产品和气溶胶廓线产品计算并分析青藏高原及其周边地区的沙尘发生频率、垂直分布及其传输特征, 同时分析沙尘层变化特征.
MERRA-2是NASA基于GEOS-5地球观测系统模式(Gelaro et al., 2017)和GSI同化系统开发的新一代再分析数据产品(Kleist et al., 2009;Molod et al., 2015), 它同化了多种卫星遥感资料, 首次发布了气溶胶再分析数据产品.MERRA-2资料始于1980年, 空间分辨率约为0.5°×0.625°, 产品涵盖多种气溶胶类型的特性(Randles et al., 2017), 包括沙尘、硫酸盐、有机碳(OC)、黑碳(BC)和海盐气溶胶等(Colarco et al., 2010).本文采用MERRA-2 550 nm沙尘气溶胶月均值数据分析1980—2017年青藏高原及其周边地区的沙尘气溶胶的时空分布特征.
此外, 本文还利用2007—2017年ECMWF ERA-Interim再分析数据集的月均值数据分析青藏高原及其周边地区的气象场特征.ERA-Interim数据的空间分辨率为1°×1°, 垂直方向从1000~350 hPa分为19个气压层.
混合单粒子拉格朗日综合轨迹模式(HYSPLIT)是一种用于计算和分析大气污染物输送、扩散轨迹、化学转化和沉降过程的专业模型.本文利用HYSPLIT模式对青藏高原一次典型的沙尘天气过程进行后向轨迹分析.
文中利用CALIPSO产品计算沙尘发生频率和沙尘层等参数, 其定义如下:沙尘发生频率f为1°×1°格点内, 某一高度层里识别为沙尘气溶胶廓线数(Ndust)与格点内总气溶胶廓线数(Nall)之比, 即f=Ndust/Nall;沙尘层为每个格点上空只含有沙尘气溶胶(|CAD|≥20)的连续层.
3 结果分析(Results and analysis)3.1 MERRA-2 AOD的验证为了验证MERRA-2再分析资料在青藏高原的可行性, 分别利用AERONET与MISR的气溶胶产品与其进行对比.将2006—2017年AERONET纳木错站与MERRA-2对应格点各70个550 nm AOD月值数据进行了对比, 结果如图 2所示.整体来看, MERRA-2与AERONET的月均AOD的相关系数r为0.809;MERRA-2 AOD总体略高于AERONET, 平均偏差(MBE)为0.017, 两者均方根误差(RMSE)为0.024.在对比MERRA-2和MISR的AOD产品时, 为了保持空间一致性, 先将MERRA-2 AOD插值到MISR的0.5°×0.5°的空间分辨率.图 2b为MERRA-2和MISR月均AOD值的对比情况.两者一致性较好, r为0.776, RMSE为0.147;MERRA-2 AOD略低于MISR, MBE为0.066.总的来看, 与AERONET和MISR相比, MERRA-2月平均AOD与两者均呈现出较好的一致性.
图 2(Fig. 2)
 |
| 图 2 MERRA-2 AOD产品与AERONET纳木错站(a)和MISR AOD产品(b)的对比 Fig. 2Comparison of MERRA-2 AOD with AERONET Nam-co site(a) and MISR AOD(b) |
3.2 沙尘气溶胶光学厚度的变化特征图 3为基于MERRA-2月平均AOD产品计算的1980—2017年青藏高原及周边地区沙尘气溶胶光学厚度(DAOD)月均值的空间分布情况.由图可知, 塔克拉玛干沙漠DAOD始终为最高值区, 印度恒河平原次之, 青藏高原最低.塔克拉玛干沙漠与青藏高原DAOD值具有相似的季节特征, DAOD均值按春、夏、秋、冬依次递减.塔克拉玛干沙漠DAOD最高值(~0.50)出现在5月, 最低值(~0.10)出现在1月.青藏高原全年DAOD值低于0.25, DAOD最高值(~0.25)出现在5月, 最低值(~0.05)出现在12月和1月.青藏高原北部与南部DAOD值差异显著, 春季差异最大, 秋、冬季差异相对较小, 5月差异达到峰值.高原北部DAOD值高于南部地区, 北缘高浓度沙尘气溶胶受盛行风作用向高原主体逐渐扩散, 同时受东西向山脉的阻挡, 使得高原上空DAOD全年呈现由北向南递减的趋势(Liu et al., 2008;Xu et al., 2015).此外, 青藏高原北部和塔克拉玛干沙漠DAOD值均从2月到5月逐渐增大, 6月到次年1月逐渐减小.青藏高原柴达木盆地上空DAOD值全年最高, 这与该区域频繁的沙尘暴有关(Liu et al., 2015).
图 3(Fig. 3)
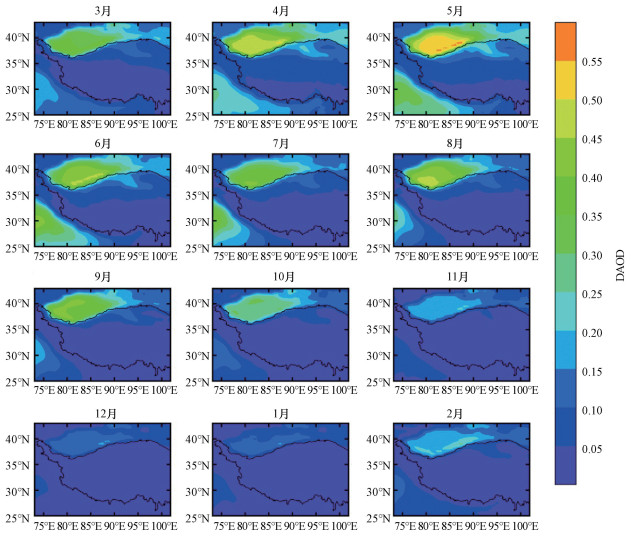 |
| 图 3 1980—2017年青藏高原及周边地区MERRA-2(DAOD)月平均值的空间分布 Fig. 3Monthly distributions of MERRA-2 550 nm dust AOD (DAOD) over the Tibetan Plateau and surrounding areas during 1980—2017 |
沙尘气溶胶光学厚度与总气溶胶光学厚度比值(DAOD/AOD)的月变化如图 4所示.整个研究区域春季沙尘占比最高, 夏季较高, 冬季最低, 其中, 5月沙尘占比最高, 12月最低.塔克拉玛干沙漠的沙尘占比为区域最高, 其次为印度的塔尔沙漠, 青藏高原沙尘占比较低, 恒河平原最低.就青藏高原而言, 高原北部地区沙尘占比显著高于南部, 其中, 柴达木盆地上空沙尘占比最高.总体而言, 青藏高原沙尘占比主要受塔克拉玛干沙漠影响, 其南部部分地区受塔尔沙漠影响.
图 4(Fig. 4)
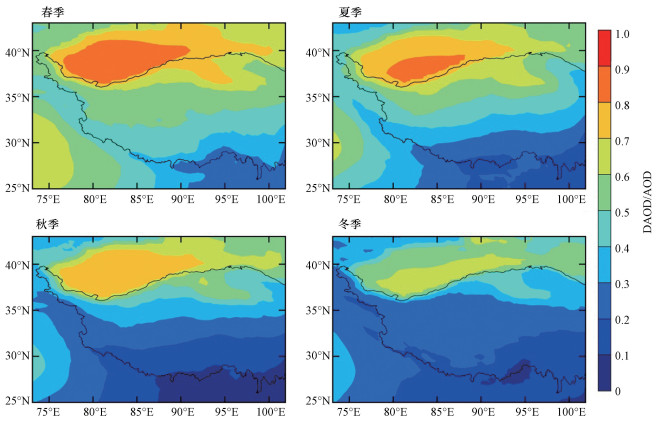 |
| 图 4 1980—2017年青藏高原及周边地区MERRA-2 DAOD/AOD季节变化 Fig. 4Seasonal distributions of the ratio of DAOD and AOD over the Tibetan Plateau and surrounding areas during 1980—2017 |
青藏高原上空的沙尘气溶胶除了存在显著的季节性差异外, 还具有明显的纬向差异.图 5为各纬度带DAOD年均值的逐年变化.由图可知, 青藏高原南部与北部DAOD值差异显著, 藏北地区DAOD值比藏南地区平均高约为0.06~0.10.从源区影响来看, 藏北地区DAOD主要受塔克拉玛干沙尘影响, 藏南地区DAOD受来自印度恒河平原的沙尘影响显著.从年变化趋势来看, 塔克拉玛干沙漠与印度恒河平原DAOD高值区强度和区域范围逐渐增大, 其对高原的影响也逐步加强.其中, 自2000年起印度沙尘对青藏高原的影响尤为显著.
图 5(Fig. 5)
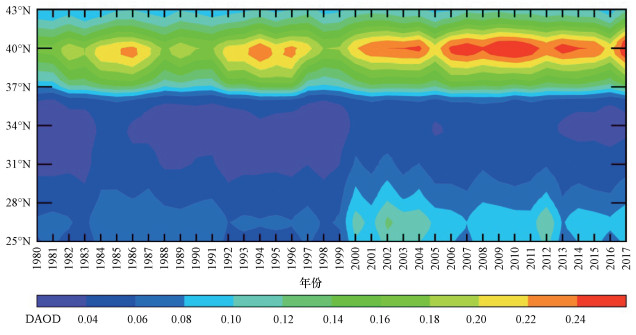 |
| 图 5 1980—2017年研究区域各纬度带平均MERRA-2 DAOD的逐年变化 Fig. 5Interannual variation of the zonal mean value of MERRA-2 550 nm DAOD over the research area from 1980 to 2017 |
3.3 沙尘气溶胶的垂直分布及传输为清晰显示青藏高原上空沙尘垂直分布及其传输特征, 选取了3个经度带进行剖面分析, 分别为A(80°~85°E)、B(85°~90°E)和C(90°~95°E)3个区域.其中, A和C区域分别覆盖了塔克拉玛干沙漠和柴达木盆地的主要区域.图 6为2007—2017年3个经度带各季节沙尘发生频率的垂直剖面图.由图可见, 塔克拉玛干沙漠沙尘发生频率春季最高, 夏、秋季次之, 冬季最低.综合3个经度带区域可见, 青藏高原上空的沙尘主要来自塔克拉玛干沙漠, 部分来自印度塔尔沙漠.沙尘向高原传输的主要通道为4~8 km高度层, 沙尘传输量春季最大, 冬季最小.沙尘传播距离与风场强度密切相关, 同时也受到高原上东西向山脉的阻挡作用.春季, 塔克拉玛干上空沙尘发生频率、抬升高度和传输距离均达到最大值, 沙尘爬升至青藏高原主体并向南输送至30°N.冬季, 虽然塔克拉玛干起沙量较小, 但高原上5~7 km处沙尘发生频率较高, 由图可见此季节的沙尘主要来自柴达木盆地, 这与地面风速较大、流动沙丘增多导致沙尘暴频繁有关(Zhang et al., 2003;Wang et al., 2005).此外, 从其它季节的沙尘频次来看, 柴达木盆地也是沙尘从塔克拉玛干沙漠向高原传输的重要通道.在C区域, 夏、秋、冬季在32°N附近沙尘发生频率均较高(>80%), 这可能与少量沙尘通过峡谷从印度恒河平原传输到青藏高原南部有关.
图 6(Fig. 6)
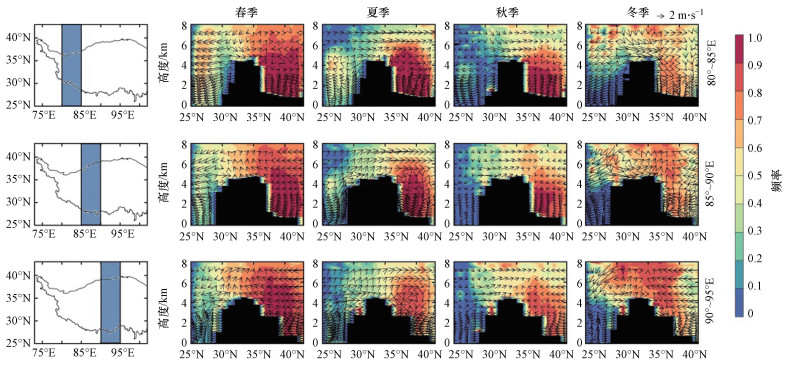 |
| 图 6 2007—2017年研究区域3个经度带(80°~85°E、85°~90°E和90°~95°E)沙尘发生频率和风场的季节剖面图 黑色阴影区域表示海拔高度 Fig. 6The seasonal distributions of the dust ratio and the wind field on three longitudinal transects (80°~85°E, 85°~90°E, 90°~95°E) over the research area during 2007—2017 The black shading area indicates the elevation |
图 7是2007—2017年青藏高原及其周边地区3个经度带(同上)的平均沙尘消光系数 σD)季节分布垂直剖面图.由图可知, 塔克拉玛干沙漠σD在春季达到最大值, 秋、冬季达到最小值.春、夏季从塔克拉玛干沙漠向青藏高原北部的沙尘传输也最多.高原上, 柴达木盆地的σD总体较高, 且春季最高(地面附近达0.2~0.3 km-1), 秋季最低.夏、秋季青藏高原南部30°~33°N处出现了σD高值, 同时期印度恒河平原σD达到最大值, 这与图 5和图 6中显示的印度的沙尘向青藏高原南部传输的现象是一致的.这一结果与Lau等(2006)的研究结果相吻合, 他指出夏季西南季风促进了沙尘由印度恒河平原向高原南部的传输.
图 7(Fig. 7)
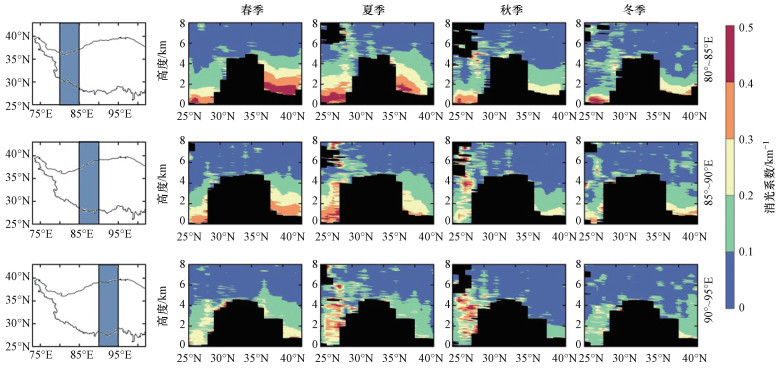 |
| 图 7 2007—2017年研究区域3个经度带(80°~85°E、85°~90°E和90°~95°E)沙尘消光系数的季节剖面图 黑色阴影区域表示海拔高度 Fig. 7The seasonal distributions of dust extinction coefficient at 532 nm on three longitudinal transects (80°~85°E, 85°~90°E, 90°~95°E) over the research area during 2007—2017 |
图 8a和8b分别表示塔克拉玛干沙漠和青藏高原沙尘平均消光系数σD廓线的季节分布.如图 8a所示, 塔克拉玛干沙漠1.5 km以上σD在春季达最高值, 夏季达次高值, 秋季最小;1.5 km以下冬季σD值仅次于春季.春季, 塔克拉玛干沙漠σD在1.5 km处达到最大值0.34 km-1, 随后迅速减小, 在6 km处降低至0.04 km-1.夏季较高的地表温度促进了对流混合(Xu et al., 2014b), 使得沙尘在垂直方向上分布均匀, σD随高度衰减较为缓慢.由图 8b可知, 青藏高原σD值夏季最高;在4.5 km以下呈春季>冬季>秋季, 而4.5 km以上秋季σD值高于冬季和春季.结合图 6、7可知, 冬季柴达木盆地较为频繁的起沙事件及逆温层的存在导致冬季4.5 km以下σD值较高;秋季来自印度恒河平原的沙尘传输至青藏高原南缘, 导致4.5 km以上σD值增大.此外, 高原上春、冬季σD值随高度递减的速率高于夏、秋季.
图 8(Fig. 8)
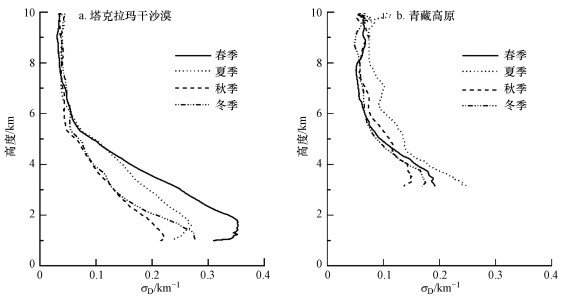 |
| 图 8 2007—2017年塔克拉玛干沙漠(a)和青藏高原(b)的532 nm沙尘消光系数季节平均廓线 Fig. 8Seasonal average profiles of dust extinction coefficient at 532 nm over Taklimakan Desert (a) and Tibetan Plateau(b) |
3.4 沙尘层的时空分布及年际变化图 9为根据CALIPSO VFM产品数据计算的2007—2017年青藏高原及其周边地区沙尘层的层顶高度、层底高度和沙尘层厚度的季节分布情况.由图可知, 塔克拉玛干沙漠全年沙尘层底低于2 km, 层顶高于3 km, 其中, 春季层顶高度最高(>5 km).塔克拉玛干沙漠沙尘层厚度由高到低分别为春季、夏季、秋季和冬季, 年平均约为1 km.青藏高原沙尘层层顶在春、夏季高度均在5 km以上, 其中, 春季高度最高.沙尘层底高度在青藏高原西部高于东部, 其中, 柴达木盆地最低.青藏高原沙尘层厚度在春季达最大值, 冬季为次高值, 夏季呈最小值, 年平均约为0.7 km.总体来看, 塔克拉玛干沙尘层顶高度高于柴达木盆地层底高度, 而柴达木盆地层顶高度高于青藏高原其它地区层底高度, 这表明塔克拉玛干沙尘可通过柴达木盆地传输至青藏高原.
图 9(Fig. 9)
 |
| 图 9 2007—2017年研究区域沙尘层的层顶高度、层底高度和层厚度的季节平均分布 a~d.层顶高度, e~h.层底高度, i~l.厚度;箭头表示地表风场 Fig. 9The top altitude, base altitude and thickness of dust layer for each season over the research area during 2007—2017 a~d. the top altitude, e~h. the base altitude, i~l. the thickness. The arrows represent the surface wind |
图 10为2007—2017年塔克拉玛干沙漠和青藏高原沙尘层厚度的年际变化.由图可知, 塔克拉玛干沙尘层厚度高于青藏高原地区, 多年平均值分别为1.00和0.82 km.从变化趋势来看, 塔克拉玛干沙尘层厚度呈现显著下降趋势, 年下降率为0.018 km, 其趋势通过了信度为0.05的显著性水平检验;青藏高原地区沙尘层厚度虽有弱下降趋势, 但变化趋势未通过检验, 其年均值在0.76~0.89 km之间变化.总的来看, 青藏高原及其周边地区的沙尘层是长期稳定存在的, 其平均厚度约为1 km左右.
图 10(Fig. 10)
 |
| 图 10 2007—2017年塔克拉玛干沙漠、青藏高原沙尘层厚度的逐年变化 Fig. 10Variations of the annual thickness of dust layer over the two areas from 2007 to 2017 |
3.5 沙尘事件个例分析综上可知, 研究区域5月的DAOD值最大, 沙尘发生频率较高, 因此, 本文利用CALIPSO卫星观测资料分析了2017年5月25日研究区域一次沙尘暴中沙尘垂直分布及传输特征.图 11给出了25日研究区域CALIPSO 532 nm气溶胶消光系数(图 11a)和气溶胶种类(图 11b)的垂直分布情况.由图可知, 青藏高原南、北坡均出现大范围气溶胶消光系数高值区域.其中, 北坡存在厚度约5 km的沙尘层, 层顶达6.5 km, 且南北覆盖约5个纬度.南坡也存在以沙尘和污染沙尘为主的厚约5.5 km的混合沙尘层, 层顶高度达6 km.从区域传输来看, 南坡和北坡都向青藏高原输送沙尘类气溶胶, 南侧以污染沙尘为主, 北侧以沙尘为主.
图 11(Fig. 11)
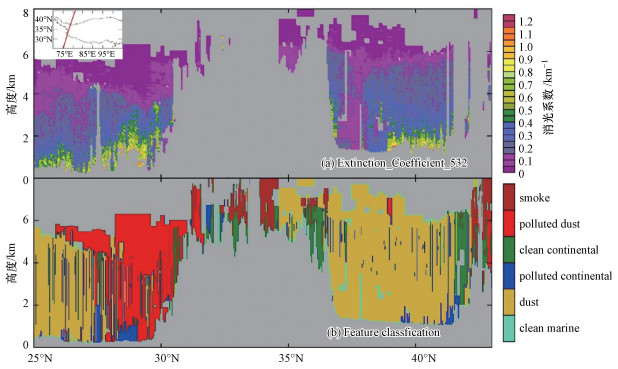 |
| 图 11 2017年5月25日CALIPSO观测到的532 nm气溶胶消光系数(a)和气溶胶种类垂直廓线(b) Fig. 11The observed of 532 nm extinction coefficients(a) and aerosol types(b) by CALIPSO on May 25, 2017 |
为了详细探究此次过程中青藏高原上沙尘气溶胶的来源及其传输路径, 利用HYSPLIT模式进行72 h后向轨迹模拟, 结果如图 12所示.图中5个点分别代表藏北(A, 83°E, 35°N)、柴达木盆地(B, 93°E, 37°N)、藏中(C, 83°E, 32°N)、藏南(D, 85°E, 29°N)、林芝(E, 94.2°E, 29.4°N).由图可知, 青藏高原北坡(A)的气溶胶主要来源于塔克拉玛干沙漠、准格尔盆地的古尔班通古特沙漠及戈壁, 主要传输路径是通过海拔相对较低的柴达木盆地(B)爬上青藏高原.青藏高原中部(C)的气溶胶来源分为两部分, 大部分来自塔克拉玛干沙漠、古尔班通古特沙漠及戈壁, 少部分来自印度恒河平原.青藏高原南坡(D)及林芝地区(E)的气溶胶主要来自印度恒河平原, 传输路径主要依靠雅鲁赞布江峡谷, 少量气溶胶依靠气流抬升至6 km以上的高空, 在盛行风的作用下越过喜马拉雅山脉向青藏高原深处传输.
图 12(Fig. 12)
 |
| 图 12 HYSPLIT-4模式模拟的2017年5月25日青藏高原上5个站点的72 h后向轨迹 红、蓝和绿线分别表示站点上空100、500和1000 m离地高度的后向轨迹线 Fig. 12The 72h backward trajectories of air mass at five typical locations over the Tibet Plateau since May 25, 2017 simulated by Hysplit-4 model The lines of red, blue and green represent the backward trajectories at the above-ground altitudes of 100, 500 and 1000 m, respectively |
4 结论(Conclusions)1) 对比表明, MERRA-2 AOD略高于AERONET, 略低于MISR.
2) 塔克拉玛干沙漠与青藏高原DAOD值具有相似的季节特征, DAOD均值按春、夏、秋、冬依次递减.青藏高原上空DAOD值纬向差异显著, 北部DAOD值比南部高, 春季差异最大.自2000年以来, 塔克拉玛干沙漠和印度恒河平原DAOD高值区强度及区域范围增大, 其中, 印度沙尘对青藏高原的影响尤为显著.
3) 青藏高原上空的沙尘主要来自塔克拉玛干沙漠, 传输量春季最大;部分来自印度恒河平原, 传输主要发生在夏、秋季.柴达木盆地是塔克拉玛干沙漠向青藏高原输送沙尘的重要通道, 传输高度集中在4~8 km.塔克拉玛干沙尘的发生频率和抬升高度在春季均达到最大值, 并且沙尘最远可向南输送至30°N.冬季, 塔克拉玛干沙漠起沙量较小, 青藏高原沙尘主要来自柴达木盆地.夏季, 大量来自塔克拉玛干沙漠和印度恒河平原的沙尘使得高原的沙尘消光系数达最大值.塔克拉玛干沙漠和青藏高原地区沙尘层厚度多年平均值分别为1.00和0.82 km.青藏高原沙尘层厚度春冬季比夏秋季厚.塔克拉玛干沙尘层厚度显著下降, 青藏高原地区沙尘层厚度变化趋势不显著.
4) 对青藏高原2017年5月25日一次典型的沙尘天气过程的分析表明, 青藏高原北坡的沙尘主要来自塔克拉玛干、古尔班通古特及戈壁沙漠;高原南坡的污染沙尘气溶胶主要来自印度恒河平原;高原中部的沙尘大部分来自北坡输送, 少部分来自印度恒河平原.
致谢:感谢NASA Earthdata和AERONET网站、ECMWF网站和NOAA Hysplit提供的数据.
参考文献
| Chen S Y, Huang J P, Zhao C, et al. 2013. Modeling the transport and radiative forcing of Taklimakan dust over the Tibetan Plateau:A case study in the summer of 2006[J]. Journal of Geophysical Research:Atmospheres, 118(2): 797-812. DOI:10.1002/jgrd.50122 |
| Chen S Y, Huang J P, Li J X, et al. 2017. Comparison of dust emissions, transport, and deposition between the Taklimakan Desert and Gobi Desert from 2007 to 2011[J]. Science China Earth Sciences, 60(7): 1338-1355. DOI:10.1007/s11430-016-9051-0 |
| Claquin T, Schulz M, Balkanski Y, et al. 1998. Uncertainties in assessing radiative forcing by mineral dust[J]. Tellus B, 50(5): 491-505. |
| Colarco P, Dasilva A, Chin M, et al. 2010. Online simulations of global aerosol distributions in the NASA GEOS-4 model and comparisons to satellite and ground-based aerosol optical depth[J]. Journal of Geophysical Research:Atmospheres, 115: D14207. DOI:10.1029/2009JD012820 |
| Duce R A, Unni C K, Ray B J, et al. 1980. Long-range atmospheric transport of soil dust from Asia to the Tropical North Pacific:Temporal variability[J]. Science, 209(4464): 1522-1524. DOI:10.1126/science.209.4464.1522 |
| Dumka U C, Moorthy K K, Kumar R, et al. 2010. Characteristics of aerosol black carbon mass concentration over a high altitude location in the Central Himalayas from multi-year measurements[J]. Atmospheric Research, 96(4): 510-521. |
| Fang X M, Han Y X, Ma J H, et al. 2004. Dust storms and loess accumulation on the Tibetan Plateau:A case study of dust event on 4 March 2003 in Lhasa[J]. Chinese Science Bulletin, 49(9): 953-960. DOI:10.1007/BF03184018 |
| Ge J M, Huang J P, Xu C P, et al. 2015. Characteristics of Taklimakan dust emission and distribution:A satellite and reanalysis field perspective[J]. Journal of Geophysical Research Atmospheres, 119(20): 772-783. |
| Gelaro R, Mccarty W, Randles C, et al. 2017. The modern-era retrospective analysis for research and applications, version 2 (MERRA-2)[J]. Journal of Climate, 30(14): 5419-5454. DOI:10.1175/JCLI-D-16-0758.1 |
| Han Y X, Xi X X, Song L C, et al. 2004. Spatio-temporal sand-dust distribution in Qinghai-Tibet Plateau and its climatic significance[J]. Journal Desert Research, 24(5): 72-76. |
| 韩永翔, 赵天良, 宋连春, 等. 2005. 北太平洋地区春季粉尘的空间分布特征-观测及模拟[J]. 中国环境科学, 25(3): 257-261. |
| Huang J P, Lin B, Minnis P, et al. 2006. Satellite-based assessment of possible dust aerosols semi-direct effect on cloud water path over East Asia[J]. Geophysical Research Letters, 33(19): L19802. |
| Kleist D T, Parrish D F, Derber J C, et al. 2009. Introduction of the GSI into the NCEP global data assimilation system[J]. Weather & Forecasting, 24(6): 1691-1705. |
| Kuang Y, Zhao C S, Tao J C, et al. 2015. Diurnal variations of aerosol optical properties in the North China Plain and their influences on the estimates of direct aerosol radiative effect[J]. Atmospheric Chemistry & Physics, 15(10): 5761-5772. |
| Lau K M, Kim M K, Kim K M. 2006. Asian summer monsoon anomalies induced by aerosol direct forcing:the role of the Tibetan Plateau[J]. Climate Dynamics, 26(7/8): 855-864. |
| Lau W K M, Kim M K, Kim K M, et al. 2010. Enhanced surface warming and accelerated snow melt in the Himalayas and Tibetan Plateau induced by absorbing aerosols[J]. Environmental Research Letters, 5(2): 025204. |
| 刘刚, 史伟哲, 尤睿. 2008. 美国云和气溶胶星载激光雷达综述[J]. 航天器工程, 17(1): 78-84. |
| Liu Y, Sato Y, Jia R, et al. 2015. Modeling study on the transport of summer dust and anthropogenic aerosols over the Tibetan Plateau[J]. Atmospheric Chemistry and Physics, 15(21): 12581-12594. DOI:10.5194/acp-15-12581-2015 |
| Liu Z, Guan D, Wei W, et al. 2015. Reduced carbon emission estimates from fossil fuel combustion and cement production in China[J]. Nature, 524(7565): 335-338. |
| Liu Z Y, Liu D, Huang J P, et al. 2008. Airborne dust distributions over the Tibetan Plateau and surrounding areas derived from the first year of CALIPSO lidar observations[J]. Atmospheric Chemistry and Physics, 8(16): 5045-5060. DOI:10.5194/acp-8-5045-2008 |
| 刘贞, 张雪姣, 郑有飞, 等. 2016. 基于CALIPSO对中国春季一次沙尘暴的研究[J]. 环境科学学报, 36(12): 4315-4327. |
| Martonchik J V, Diner D J, Kahn R A, et al. 2004. Comparison of MISR and AERONET aerosol optical depths over desert sites[J]. Geophysical Research Letters, 31(16): 171-184. |
| Molod A, Takacs L, Suarez M, et al. 2015. Development of the GEOS-5 atmospheric general circulation model:evolution from MERRA to MERRA2[J]. Geoscientific Model Development Discussions, 8(5): 1339-1356. DOI:10.5194/gmd-8-1339-2015 |
| Murayama T, Sugimoto N, Uno I, et al. 2001. Ground-based network observation of Asian dust events of April 1998 in east Asia[J]. Journal of Geophysical Research:Atmospheres, 106(D16): 18345-18359. |
| Proestakis E, Amiridis V, Marinou E, et al. 2018. 9-year spatial and temporal evolution of desert dust aerosols over South-East Asia as revealed by CALIOP[J]. Atmospheric Chemistry & Physics, 18: 1337-1362. |
| Qin W M, Liu Y, Wang L C, et al. 2018. Characteristic and driving factors of aerosol optical depth over mainland China during 1980-2017[J]. Remote Sensing, 10(7): 1064. DOI:10.3390/rs10071064 |
| Randles C A, Da Silva A M, Buchard V, et al. 2017. The MERRA-2 aerosol reanalysis, 1980-onward, Part I:System description and data assimilation evaluation[J]. Journal of Climate, 30(17): 6823-6850. |
| 石广玉, 王标, 张华, 等. 2008. 大气气溶胶的辐射与气候效应[J]. 大气科学, 32(4): 826-840. |
| Sun E W, Xu X F, Che H Z, et al. 2019. Variation in MERRA-2 aerosol optical depth and absorption aerosol optical depth over China from 1980 to 2017[J]. Journal of Atmospheric and Solar-Terrestrial Physics, 186: 8-19. DOI:10.1016/j.jastp.2019.01.019 |
| Sun J M, Zhang M Y, Liu T S. 2001. Spatial and temporal characteristics of dust storms in China and its surrounding regions, 1960-1999:Relations to source area and climate[J]. Journal of Geophysical Research Atmospheres, 106(D10): 10325-10333. DOI:10.1029/2000JD900665 |
| Vernier J P, Fairlie T D, Natarajan M, et al. 2015. Increase in upper tropospheric and lower stratospheric aerosol levels and its potential connection with Asian pollution[J]. Journal of Geophysical Research Atmospheres, 120(4): 1608-1619. |
| Wang S G, Wang J Y, Zhou Z J, et al. 2005. Regional characteristics of three kinds of dust storm events in China[J]. Atmospheric Environment, 39(3): 509-520. |
| 魏巍, 皮冬勤, 晏平仲, 等. 2018. 2017年春季华北地区一次典型沙尘重污染天气过程研究[J]. 环境科学学报, 38(1): 14-22. |
| 熊洁, 赵天良, 韩永翔, 等. 2013. 1995-2004年东亚沙尘气溶胶的模拟源汇分布及垂直结构[J]. 中国环境科学, 33(6): 961-968. |
| Xu C, Ma Y M, Panday A, et al. 2014a. Similarities and differences of aerosol optical properties between southern and northern sides of the Himalayas[J]. Atmospheric Chemistry and Physics, 14(6): 3133-3149. DOI:10.5194/acp-14-3133-2014 |
| Xu C, Ma Y M, You C, et al. 2015. The regional distribution characteristics of aerosol optical depth over the Tibetan Plateau[J]. Atmospheric Chemistry and Physics, 15(20): 12065-12078. DOI:10.5194/acp-15-12065-2015 |
| Xu C P, Ge J M, Huang J P, et al. 2014b. Observations of dust aerosol over China based on CALIPSO spaceborne lidar[J]. Journal of Desert Research, 34(5): 1353-1362. |
| 延昊, 王长耀, 牛铮, 等. 2001. 东亚沙尘源地、沙尘输送路径的遥感研究[J]. 地理科学进展, 21(1): 90-94. |
| Zhang X Y, Gong S L, Shen Z X, et al. 2003. Characterization of soil dust aerosol in China and its transport and distribution during 2001 ACE-Asia:1.Network observations[J]. Journal of Geophysical Research:Atmospheres, 108(6): 345-350. |
| 赵竹子.2015.青藏高原大气气溶胶的理化组成及其来源解析[D].西安: 中国科学院研究生院(地球环境研究所).1-107 |
| Zhou X J, Zhao P, Chen J M, et al. 2009. Impacts of thermodynamic processes over the Tibetan Plateau on the Northern Hemispheric climate[J]. Science in China Series D:Earth Sciences, 52(11): 1679-1693. DOI:10.1007/s11430-009-0194-9 |
