 ,11Department of Physics,
 2Department of Physics,
Received:2020-02-28Revised:2020-05-07Accepted:2020-05-25Online:2020-08-05

Abstract
Keywords:
PDF (1055KB)MetadataMetricsRelated articlesExportEndNote|Ris|BibtexFavorite
Cite this article
Vikas , Keshav Walia, R K Verma. Lossy mode resonance-based uniform core tapered fiber optic sensor for sensitivity enhancement. Communications in Theoretical Physics, 2020, 72(9): 095502- doi:10.1088/1572-9494/aba240
1. Introduction
In recent years, lossy mode resonance (LMR) technique has been under ample consideration by researchers as it is more effective and beneficial over the surface plasmon resonance (SPR) technique in many sensing applications [1–3]. The first application of LMR, in the area of sensing, was carried out by Dell Villar et al in 2010 utilizing indium tin oxide (ITO), both experimentally and theoretically [1]. In LMR-based sensors, lossy modes can be excited by using both transverse magnetic (TM) and transverse electric (TE) polarized light unlike SPR-based sensors, in which only TM polarized light can excite surface plasmons. For LMR to occur, the real part of the dielectric constant of a coated lossy material must be a positive value and greater in magnitude than its own imaginary part, as well as the dielectric constant of the surrounding medium. Owing to the capability of exciting several lossy modes, in LMR-based sensors a metal oxide layer of finite thickness is used instead of metals [3, 4]. Additionally, the spectral position of these resonances can be sought just by varying the thickness of the coated lossy material. Also, the sensitivity values can be attuned as a function of the dielectric permittivity and the thickness of the lossy material. The phenomenon of LMR takes place when a waveguide mode is coupled with a lossy mode at a finite value of coated film thickness. The basic need for coupling of these modes is overlying of the mode fields and similar phases. A state of similar phase is attained only if the wave vector (real part) of both the modes, i.e. waveguide mode and lossy mode, exactly matches. As soon as lossy modes cross the cutoff condition, they began to guide in the coated film of metal oxides which leads to multiple LMR generation at specific values of thickness, and a sharp fall in the spectra of transmitted power is detected at these resonance wavelengths. Therefore, unlike SPR, multiple optical resonances can be achieved when the thickness of the coating is increased and all these resonances can be utilized for sensing as well as other applications. In line with the development of sensing devices a lot of research work has been carried out for the enhancement of the sensitivity of the fiber optic sensors, based on the phenomenon of LMR [5–16]. In 2014, Kaur et al studied LMR by using both spectral and angular interrogation methods theoretically and revealed that a dielectric layer having a low refractive index value, placed between a prism and the lossy wave guiding film, enhances the sensitivity of the sensor up to 4000–5000 nm RIU−1 [5]. In the same year, an LMR-supported fiber optic sensor utilizing bilayers of ITO and titanium dioxide (In the current study, we have developed a numerical analysis of an LMR-supported fiber optic sensor by conceptualizing the deposition of a thin metal oxide film on the uniform fiber core sandwiched between two unclad tapered fiber regions. For ITO and AZO, the real part of the dielectric constant is positive and higher in magnitude than its own imaginary part [8, 17]. Therefore, both these materials satisfy the condition of an LMR as explained above. We have chosen the thicknesses 90 nm and 900 nm, respectively, for ITO and AZO materials such that only the first two LMRs are obtained. To show their comparison with SPR, gold (Au) and silver (Ag) were used as the SPR active materials. We have calculated the sensitivity of the proposed fiber optic sensor with taper ratios (TRs). Additionally, the sensitivity values for the first two LMRs are evaluated for ITO and AZO separately and are compared. The study reveals that the LMR sensor with the present fiber optic probe design shows around 3-fold enhancement in the sensitivity when compared with the conventional SPR-based fiber optic probe.
2. Principle and mathematical considerations
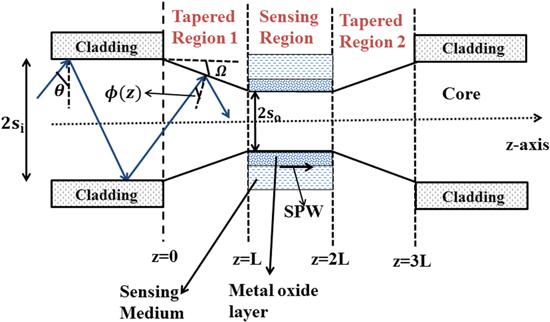
For mathematical modeling, the Kretschmann configuration [18] was realized on a plastic clad silica (PCS) multimode fiber of core diameter 600 μm and numerical aperture 0.22. A very small part of the cladding, about 0.5 cm of length, was removed (usually the central portion) from the optical fiber. The cladding-removed portion around uniform core of the optical fiber can be tapered by using flame brush method [19]. Figure 1 displays a schematic of the proposed fiber optic probe. There are three regions shown in figure 1 viz. sensing region, consisting of a uniform core placed amid two cladding-removed tapered regions 1 and 2. Then, a thin layer of ITO and AZO was deposited over the cladding-removed portion of the uniform fiber core and subsequently the sensing region was kept for the sensitivity measurements [20]. Using a polychromatic source of light (tungsten halogen lamp), light was launched in the fiber core through one end at an angle of incidence ‘θ’, another end of the optical fiber was spectrally interrogated using an Avasoft spectrometer. The spectrometer was further interfaced to a computer to obtain transmission spectrum. Due to the phenomenon of total internal reflection (TIR), light will be propagating inside the fiber core. After this, the guided rays of light propagated through the tapered region and the angle of incidence ‘θ’ gets modified to ‘φ (z)’ which can be calculated as [21]Figure 1.
 New window|Download| PPT slide
Figure 1.Schematic diagram of proposed fiber optic bio-sensing probe with uniform fiber core placed inbetween two tapered fiber regions 227×137 mm (96×96 DPI).
Further, since we have used the wavelength interrogation method the dispersion relation of each layer has to be taken into consideration. The wavelength-dependent silica core refractive index was calculated using the Sellmeier formula as [22]
Therefore, the reflectance for a p-polarized light will be
The required expression for transmitted power in present case of fiber optic probe can be written as
3. Results and discussion
In our simulation, we have taken ITO and AZO as the LMR active materials coated over a uniform fiber core, sandwiched between two cladding-removed identical tapered fiber regions. All the calculations were done with the help of MATLAB software. It is also to be noted that the first tapered region was used to bring the angle of incidence close to the critical angle and the second tapered region allows the rays to regain their initial values. Since our focus is only on the first two LMRs, therefore we have taken the optimum thicknesses of ITO and AZO as 90 nm and 900 nm, respectively, such that only the first two LMRs are attained [13]. Next, we shall consider the effect of changing the surrounding region refractive indices (SRI) on the LMR wavelength. As a number of biological samples are found to be in aqueous form, we have considered SRI near to the refractive index of distilled water i.e. 1.333.3.1. Shift in LMR curves
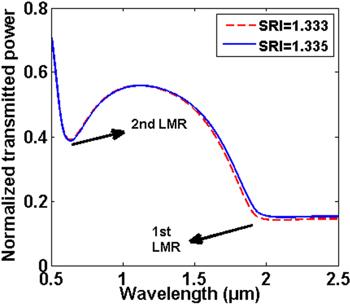
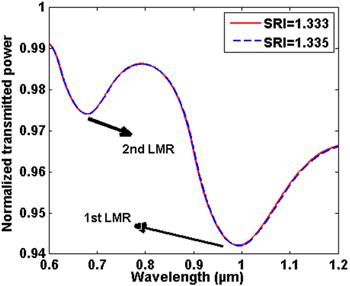
The sensing medium having RI 1.333 was placed around the sensing layer so that the LMR’s spectrum was obtained for ITO and AZO separately. To measure change in the resonance wavelength, the SRI was increased by an amount of 0.002 RIU. The transmission spectra showing the first two LMR curves for ITO and AZO is depicted in figures 2 and 3, respectively. In figure 2, if the SRI is 1.333, then corresponding resonance wavelengths for the first and second LMR were obtained as 2.0818 μm and 0.6319 μm, respectively. But if we increase the SRI to 1.335, then resonance wavelengths shifted to 2.1185 μm and 0.6335 μm, respectively. Similarly, from figure 3, if the SRI is 1.333 then resonance wavelengths corresponding to the first and second LMR are obtained as 0.9927 μm and 0.3500 μm, respectively and shifted to 0.9942 μm and 0.6796 μm if the SRI was increased to 1.335. Thus, it was observed that with an increase in the SRI, the LMR curves show a red shift. This is because if we increase the SRI, the effective index of the multilayer structure also gets changed and hence the resonant excitation of the LMR takes place at some higher value of the wavelength [17]. Also from figures 2 and 3, we inferred that the first LMR for ITO and AZO lies near the IR region whereas the second LMR lies in the visible region. The multiple LMRs can be generated if we further increase the thickness of the coated materials.Figure 2.
 New window|Download| PPT slide
Figure 2.Transmission spectra for ITO deposited over the uniform core of optical fiber at a TR of 1.6.
Figure 3.
 New window|Download| PPT slide
Figure 3.Transmission spectra for AZO deposited over the uniform core of optical fiber at a TR of 2.0.
3.2. Effect of tapering
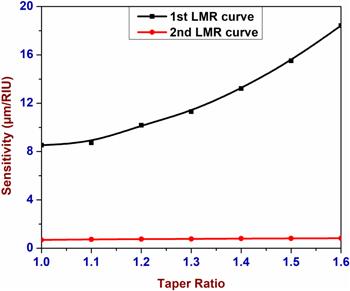
In the case of ITO, if the TR is 1.0 i.e. an untapered fiber core around a uniform core sensing region, sensitivity values of the first and second LMRs are obtained as 8.53 μm RIU−1 and 0.69 μm RIU−1, respectively. It was observed that sensitivity enhances if the TR is increased. Sensitivity values were calculated up to a TR of 1.6 with an increment of 0.1. From table 1, it can be seen that the sensitivity is increased for both the LMRs with an increase in TR. Maximum sensitivity values for the first and second LMRs were obtained as 18.4250 μm RIU−1 and 0.8250 μm RIU−1, respectively at a TR of 1.6 confirming that the first LMR was more sensitive compared to the second LMR. If there is a further increase in the TR, then a distorted LMR spectrum is obtained and sensitivity cannot be calculated. Therefore 1.6 is the optimum value of TR for ITO in sensing applications at this particular thickness. The enhancement in the sensitivity can be explained as follows: using taper region 1, the angle of the incidence of bounded rays into the optical fiber comes closer to the critical angle. This can be obtained by taking the optimum output diameter of taper fiber core due to which entire bounded rays will propagate inside the sensing region. Then, after crossing the sensing area, the rays will enter into tapered region 2, which further converts the angle of bounded rays to their original values in order to get the complete bounded rays at the output end of the optical fiber. If we choose the optimum value of the tapered core diameter, then no ray will escape out and in the sensing region, a major number of rays will propagate with the angle closer to the critical angle. Due to this reason the evanescent wave will penetrate in the sensing layer with a larger penetration depth as a result of which stronger coupling between the evanescent wave and the lossy modes will lead to the higher value of the sensitivity of the proposed fiber optic probe. Figure 4 shows the sensitivity comparison of the first and second LMRs for the present fiber optic probe.Table 1.
Table 1.Values of sensitivities of the first and second LMRs for ITO coated over uniform fiber core with TRs.
| Sensitivity (μm RIU−1) | ||
|---|---|---|
| TR | 1st LMR | 2nd LMR |
| 1.0 | 8.5300 | 0.6900 |
| 1.1 | 8.7250 | 0.7300 |
| 1.2 | 10.1750 | 0.7550 |
| 1.3 | 11.3050 | 0.7700 |
| 1.4 | 13.2100 | 0.7950 |
| 1.5 | 15.5100 | 0.8150 |
| 1.6 | 18.4250 | 0.8250 |
New window|CSV
Figure 4.
 New window|Download| PPT slide
Figure 4.Sensitivity comparison of the first and second LMRs with TRs for ITO.
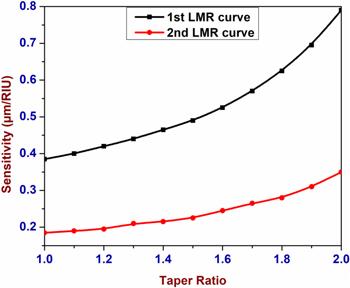
Similarly, for AZO at a TR of 1.0, the sensitivity values for the first and second LMRs are obtained as 0.385 μm RIU−1 and 0.185 μm RIU−1, respectively. The values are increased further by increasing the TR up to 2.0 with an increment of 0.1. From table 2 it can be seen that the maximum values of sensitivity for the first and second LMRs are 0.79 μm RIU−1 and 0.35 μm RIU−1, respectively at a TR of 2.0. Figure 5 shows the sensitivity comparison of the first and second LMRs for the present fiber optic probe with AZO, showing that the first LMR is much more sensitive than the second LMR.
Table 2.
Table 2.Values of sensitivities of the first and second LMRs for AZO coated over uniform fiber core with TRs.
| Sensitivity (μm RIU−1) | ||
|---|---|---|
| TR | 1st LMR | 2nd LMR |
| 1.0 | 0.3850 | 0.1850 |
| 1.1 | 0.4000 | 0.1900 |
| 1.2 | 0.4200 | 0.1950 |
| 1.3 | 0.4400 | 0.2100 |
| 1.4 | 0.4650 | 0.2150 |
| 1.5 | 0.4900 | 0.2250 |
| 1.6 | 0.5250 | 0.2450 |
| 1.7 | 0.5700 | 0.2650 |
| 1.8 | 0.6250 | 0.2800 |
| 1.9 | 0.6950 | 0.3100 |
| 2.0 | 0.7900 | 0.3500 |
New window|CSV
Figure 5.
 New window|Download| PPT slide
Figure 5.Sensitivity comparison of the first and second LMRs with TRs for AZO.
3.3. Comparison with SPR
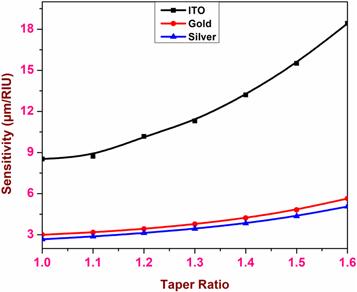
Au and Ag of optimum thicknesses 50 nm have been used here to show the comparison of an LMR sensor with an SPR sensor. Table 3 provides the sensitivity values for Au and Ag when used as the SPR active material in the designed tapered structure. From the results we inferred that with an increase in TR, sensitivity increases up to a TR of 1.6. After this the SPR curves become shallow and its sensitivity value cannot be realized practically. At a TR of 1.6, sensitivity values are 5.6425 μm RIU−1 and 5.0615 μm RIU−1 for Au and Ag, respectively. Figure 6 shows sensitivity comparison of the first LMR of ITO, Au and Ag. From this figure, we can see that the trend of sensitivity is ITO>Au>Ag. Thus, it is established that the LMR sensor with the present fiber optic probe shows a larger value of sensitivity when compared with the conventional fiber optic SPR sensor. Also, the use of a suitable LMR active material with proper thickness is an essential parameter to develop a highly sensitive fiber optic sensing probe.Table 3.
Table 3.Values of sensitivities for Au and Ag coated over uniform fiber core with TRs.
| Sensitivity (μm RIU−1) | ||
|---|---|---|
| TR | For gold (Au) | For silver (Ag) |
| 1.0 | 3.0020 | 2.6725 |
| 1.1 | 3.1730 | 2.8725 |
| 1.2 | 3.4300 | 3.1240 |
| 1.3 | 3.7720 | 3.4395 |
| 1.4 | 4.2195 | 3.8395 |
| 1.5 | 4.8175 | 4.3605 |
| 1.6 | 5.6425 | 5.0615 |
New window|CSV
Figure 6.
 New window|Download| PPT slide
Figure 6.Sensitivity comparison of LMR- and SPR-based optical fiber probes.
4. Conclusion
An LMR-supported tapered fiber optic bio-sensor by depositing a thin layer of metal oxide on a uniform fiber core placed inbetween two unclad tapered fiber regions is modeled and studied theoretically. It is observed that the sensitivity values for both the LMRs increases with an increase in the TR up to a certain value. The results also show that the first LMR is more sensitive than the 2nd LMR for both ITO and AZO and records a 3-fold increment in sensitivity when compared with conventional SPR-based fiber optic sensors. It is therefore concluded that the present probe structure with the given parameters will possess maximum sensitivity and hence is more suitable in bio-sensing applications. Also the study recommends to choose ITO as the LMR active material for making fiber optic sensors with large values of sensitivity.Acknowledgments
One of the authors, Mr Vikas, gratefully acknowledges the Department of Science and Technology (DST), INDIA for providing the INSPIRE fellowship (Registration No.-IF170543).Reference By original order
By published year
By cited within times
By Impact factor
DOI:10.1109/JLT.2009.2036580 [Cited within: 2]
DOI:10.1364/AO.51.004298
DOI:10.1016/j.optlaseng.2017.07.009 [Cited within: 2]
DOI:10.1016/j.yofte.2018.07.003 [Cited within: 1]
DOI:10.1016/j.snb.2014.03.058 [Cited within: 2]
DOI:10.1364/AO.53.003241 [Cited within: 1]
DOI:10.1016/j.snb.2016.03.024 [Cited within: 1]
DOI:10.1016/j.snb.2016.04.015 [Cited within: 2]
DOI:10.1016/j.snb.2016.08.126 [Cited within: 1]
DOI:10.3390/s18010058 [Cited within: 1]
DOI:10.1021/acs.jpcc.7b12549 [Cited within: 1]
DOI:10.1016/j.optlastec.2018.11.041 [Cited within: 1]
DOI:10.1088/1361-6463/aadb0f [Cited within: 1]
DOI:10.1016/j.sna.2019.03.010 [Cited within: 1]
DOI:10.1016/j.apsusc.2019.06.168 [Cited within: 1]
[Cited within: 1]
DOI:10.1063/1.4808206 [Cited within: 3]
DOI:10.1515/zna-1968-1247 [Cited within: 1]
DOI:10.1109/50.134196 [Cited within: 1]
DOI:10.1016/j.ijleo.2018.11.081 [Cited within: 1]
[Cited within: 1]
[Cited within: 1]
DOI:10.1016/j.ijleo.2017.01.055 [Cited within: 1]
[Cited within: 1]
