HTML
--> --> -->The low-lying levels of 71Ga have been investigated previously via Coulomb excitation [15], neutron-inelastic scattering [16], proton stripping [17], and radioactive decay [18, 19]. Information regarding the nuclear properties of the higher-spin states can be acquired from a deep-inelastic reaction [1]. Several theories have been adopted to identify the low-spin states of 71Ga, such as the Coriolis coupling [1], large scale shell [20], and projected shell models [21]. This work aims to extend the available information on excited states in 71Ga and interpret the obtained experimental data via the shell model (SM) calculations, especially the recently observed negative-parity sideband. In this study, the deduced band structures and single-particle states were analyzed using the large scale SM.
2
A.Level scheme of 71Ga
The level scheme of 71Ga has been extended up to excitation energies of 4028.2 and 4165.1 keV for the positive- and negative-parity states, respectively, via the deep-inelastic reaction previously presented in [1]. In this study, approximately 14 and 9 novel  |   |   |   |   |
| 390.5 | 390.5 | 4.3(5) | 0.52(16) |   |
| 487.5 | 487.5 | 100(5) | 0.63(4) |   |
| 511.5 | 121.0 | 2.9(16) | 0.79(24) |   |
| 511.5 | 33.1(48) | 0.86(10) |   | |
| 964.1 | 452.6 | 3.3(14) | 1.15(9) |   |
| 964.1 | 13.2(3) | 1.22(15) |   | |
| 1107.5 | 143.4 | 3.8(31) | 1.26(31) |   |
| 596.0 | 31.7(65) | 1.13(7) |   | |
| 620.0 | 63.9(80) | 0.80(20) |   | |
| 1494.3 | 386.8 | 81.2(2) | 0.59(6) |   |
| 1497.5 | 1010.0 | 23.9(3) | 1.24(9) |   |
| 1941.0 | 976.9 | 6.0(35) | 0.95(13) |   |
| 2069.5 | 962.0 | 11.1(38) | 1.11(10) |   |
| 572.0 | 3.7(31) | 0.57(11) |   | |
| 2083.1 | 588.8 | 39.1(86) | 1.21(8) |   |
| 2683.1 | 613.6 | 1.5(19) | 0.67(14) |   |
| 1185.6 | 11.7(9) | 1.22(10) |   | |
| 2942.1 | 859.0 | 19.0(70) | 1.15(9) |   |
| 3034.0 | 1093.0 | 3.2(24) | 1.13(22) |   |
| 3153.5 | 470.4 | 1.4(48) | 0.70(32) |   |
| 1070.4 | 1.4(14) | 0.55(12) |   | |
| 1084.0 | 5.6(75) | 1.25(21) |   | |
| 3694.6 | 541.1 | 1.1(11) | 0.54(26) |   |
| 1011.5 | 6.9(22) | 1.09(18) |   | |
| 3839.1 | 1156.0 | 2.2(19) | 1.26(32) |   |
| 3909.1 | 875.1 | 1.2(21) | 1.05(33) |   |
| 4028.2 | 1086.1 | 5.6(22) | 1.14(19) |   |
| 4165.1 | 166.0 | <1 |   | |
| 470.5 | 3.6(26) | 1.12(12) |   | |
| 4199.5 | 1046.0 | 1.4(18) | 0.96(24) |   |
| 4873.1 | 964.0 | <1 |   | |
| 5227.9 | 1199.7 | 2.5(32) | 1.11(27) |   |
| 6573.4 | 1345.5 | 1.1(24) | 1.03(32) |   |
| a: Intensity is normalized to the 487.5 keV transition. | ||||
Table1.Excitation energies (
 Figure1. Level scheme of 71Ga established in this study.
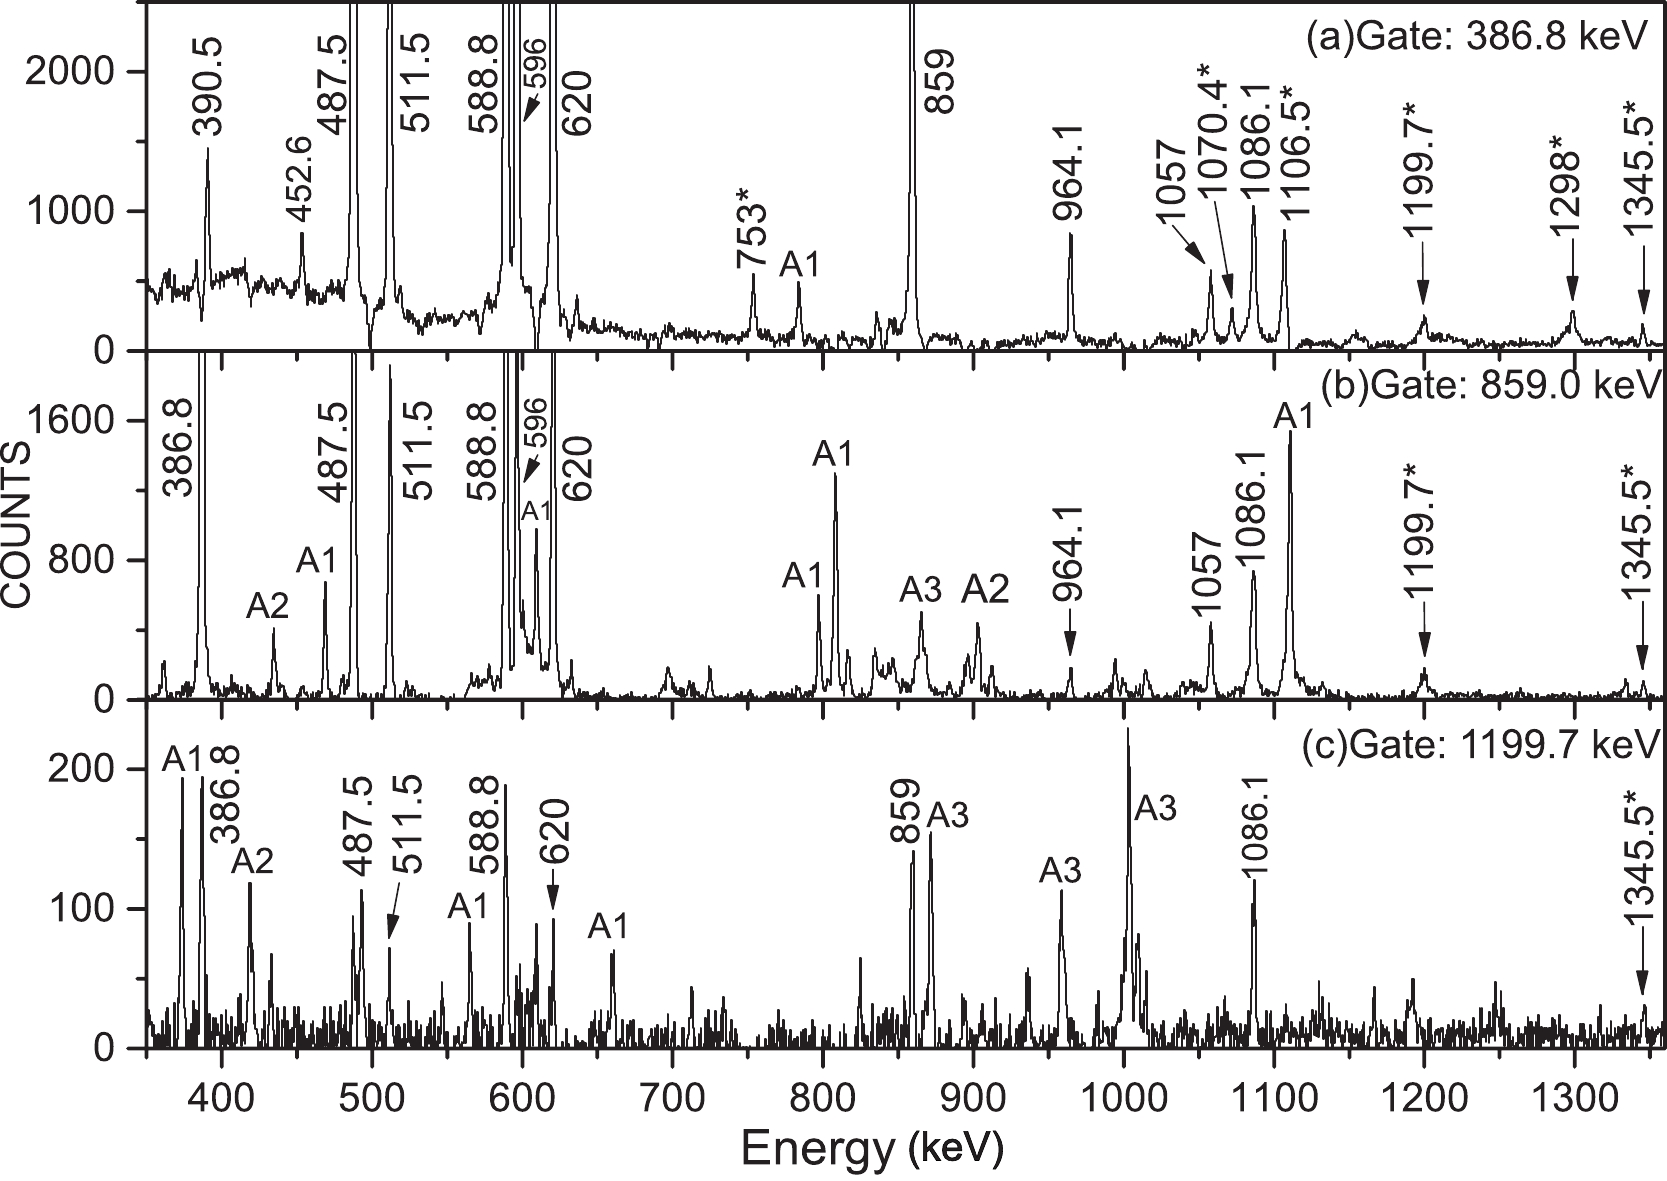
  Figure2. Gating spectra with cuts on (a) 386.8 keV, (b) 859.0 keV, and (c) 1199.7 keV transitions. New transitions are indicated with asterisks. The peaks labeled as A1, A2, and A3 in the spectra originate from the contaminations of 73As [9], 74As [10], and 74Ge [23], respectively.
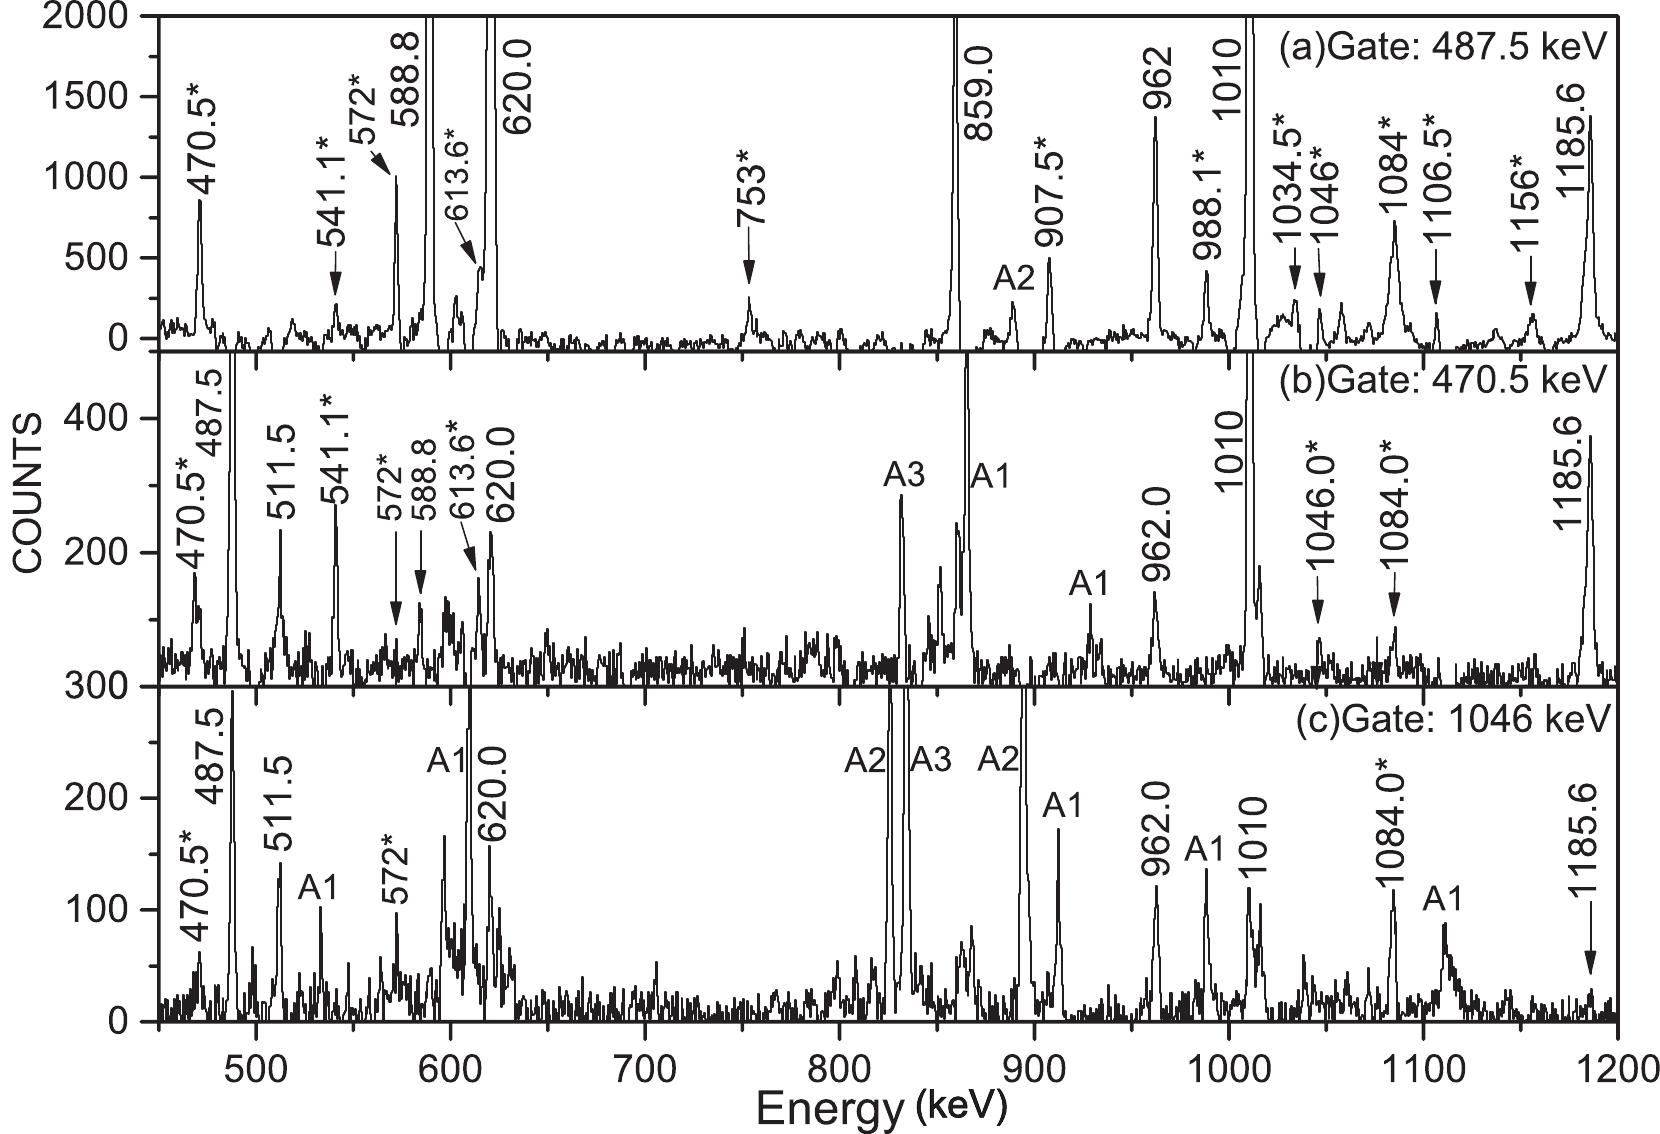
 Figure3. Gating spectra with cuts on (a) 487.5 keV, (b) 470.5 keV, and (c) 1046.0 keV transitions, respectively. New transitions are indicated with asterisks. The peaks labeled as A1, A2, and A3 in the spectra originate from the contaminations of 73As [9], 74As [10], and 74Ge [23], respectively.
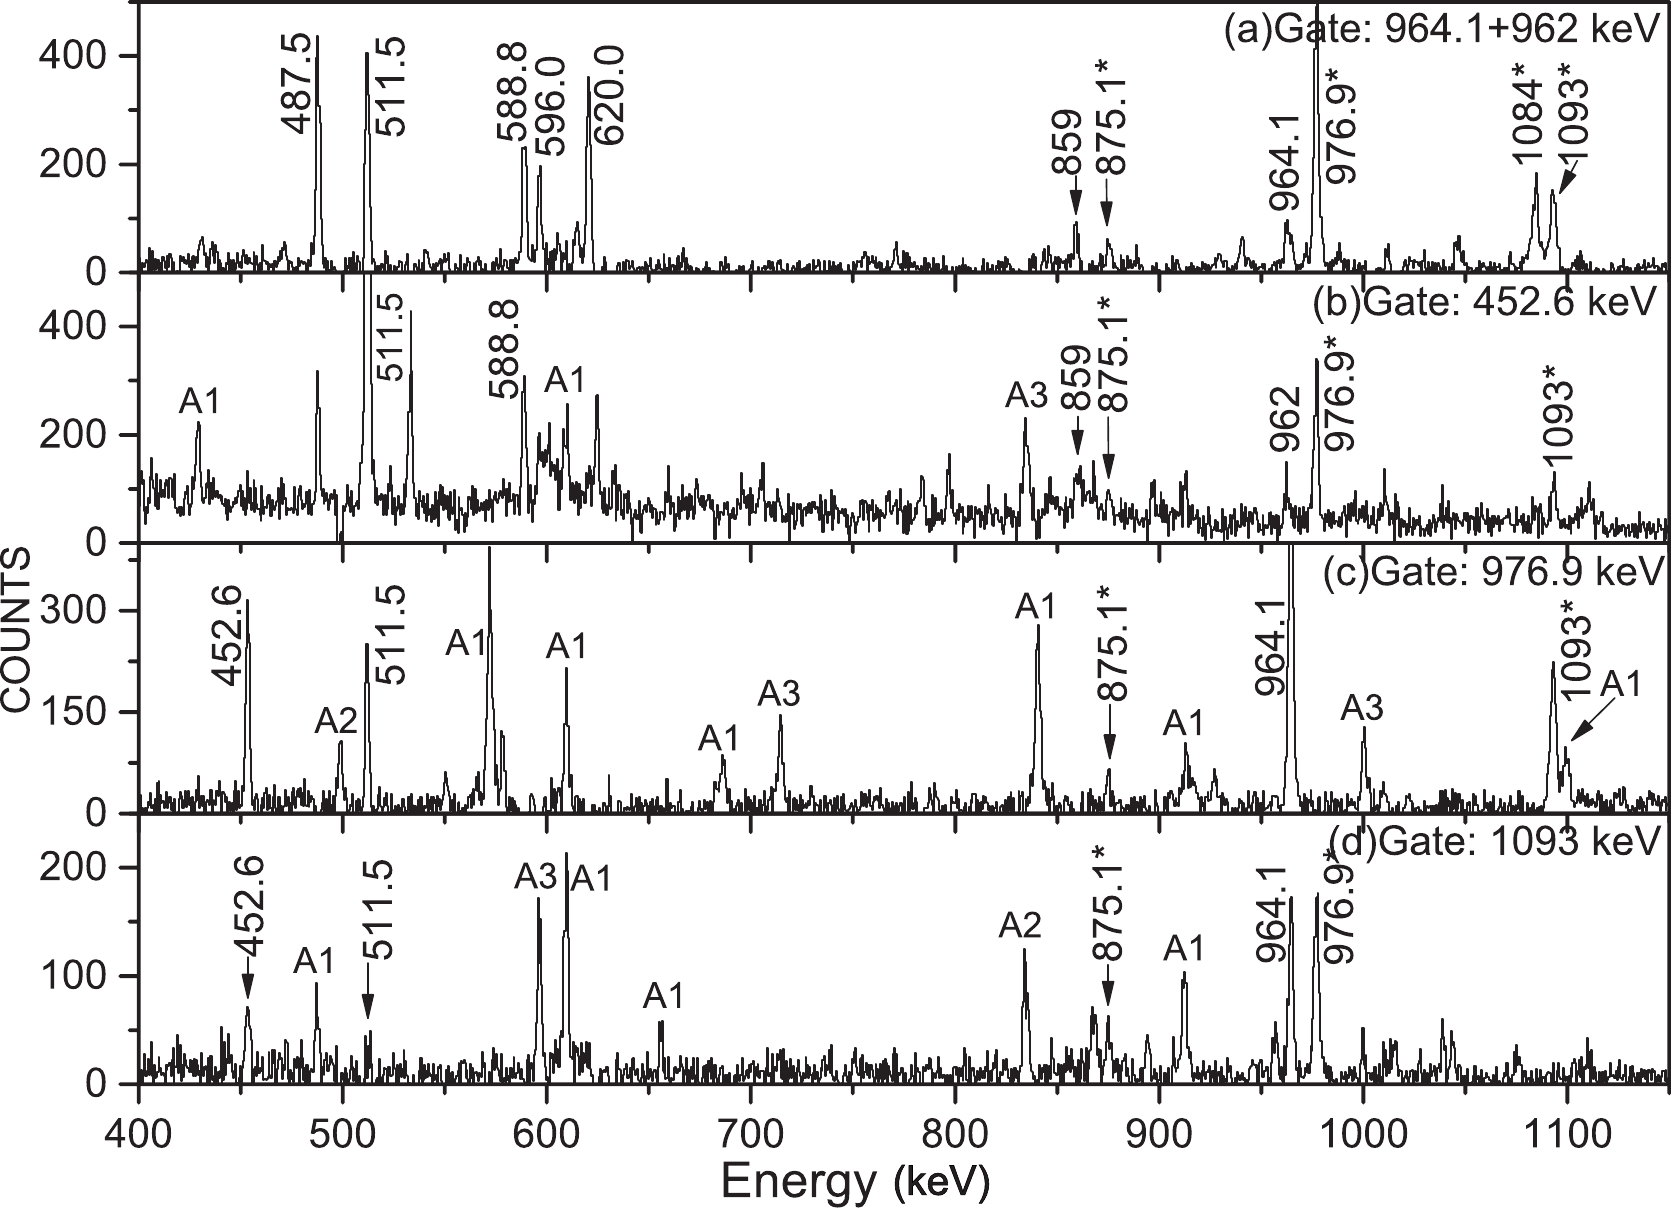
 Figure4. Gating spectra with cuts on (a) 964.1+962.0 keV, (b) 452.6 keV, (c) 976.9 keV, and (d) 1093.0 keV transitions, respectively. New transitions are indicated with asterisks. The peaks labeled as A1, A2, and A3 in the spectra originate from the contaminations of 73As [9], 74As [10], and 74Ge [23], respectively.
2
B.Positive-parity band (a)
A sequence of the positive-parity cascade is presented in Ref. [1], on top of the 9/2+ level. The highest energy state is extended up to 4028.2 keV with a tentative spin assignment (21/2+). In the analysis of this study, coincidence gates positioned at 386.8- and 859.0 keV exhibited clear peaks at 1199.7 and 1345.5 keV, respectively (see Figs. 2(a) and 2(b)). These two2
C.Negative-parity band (b)
The negative-parity band (b) has been established on top of the 9/22
D.Negative-parity sequence (c)
Figs. 4(a,b) illustrate the gating spectra of 964.1 and 452.6 keVThe ground states in
SM calculations with two different valence spaces for 71Ga have been performed to elucidate the results obtained from this study. In the first set,
 Figure5. (color online) Experimental and calculated levels in 71Ga using JUN45, jj44b, and fpg interactions.
  | exp | JUN45 | jj44b | fpg |
  | +2.562(2) | +2.188 | +2.203 | +2.198 |
  | +0.106(3) | +0.192 | ?0.244 | +0.166 |
Table2.Calculated and experimental [2] magnetic (
  |   |   | Wave function   | Partitions (%) |
3/2  | 0 | 0 |   | 29.2% |
  | 13.5% | |||
1/2  | 390.5 | 478 |   | 7.9% |
  | 5.1% | |||
5/2  | 487.5 | 388 |   | 16.5% |
  | 9.1% | |||
  | 7.8% | |||
3/2  | 511.5 | 881 |   | 8.4% |
  | 5.5% | |||
7/2  | 964.1 | 1168 |   | 14.2% |
  | 10.2% | |||
7/2  | 1107.5 | 1592 |   | 14.4% |
  | 9.8% | |||
9/2  | 1497.5 | 1663 |   | 16.2% |
  | 7.9% | |||
  | 4.4% | |||
11/2  | 1941.0 | 2478 |   | 11.8% |
  | 9.5% | |||
11/2  | 2069.5 | 2820 |   | 13.2% |
  | 9.8% | |||
13/2  | 2683.1 | 3042 |   | 15.8% |
  | 7.1% | |||
15/2  | 3034 | 3159 |   | 15.5% |
  | 5.5% | |||
  | 6.1% | |||
15/2  | 3153.5 | 3649 |   | 6.7% |
  | 5.4% | |||
  | 3.3% | |||
17/2  | 3694.6 | 3507 |   | 17.4% |
  | 7.3% | |||
  | 3.8% | |||
15/2  | 3839.1 | 3764 |   | 6.5% |
  | 4.1% | |||
19/2  | 3909.1 | 4128 |   | 16.4% |
  | 7.2% | |||
  | 4.5% | |||
21/2  | 4165.1 | 3947 |   | 22.1% |
  | 11.8% | |||
  | 9.3% | |||
19/2  | 4199.5 | 4346 |   | 15.9% |
  | 6.3% | |||
23/2  | 4873.1 | 4940 |   | 21.7% |
  | 13.8% | |||
  | 4.7% |
Table3.Main partition of wave functions for the negative-parity states of
  |   |   | Wave fuction   | Partitions (%) |
9/2  | 1494 | 2478 |   | 12.5% |
  | 4.4% | |||
13/2  | 2083 | 2894 |   | 46.6% |
  | 4.2% | |||
17/2  | 2942 | 3526 |   | 40.4% |
  | 5.6% | |||
  | 5.1% | |||
21/2  | 4028 | 4979 |   | 14.2% |
  | 13.5% | |||
  | 8.8% | |||
25/2  | 5228 | 5869 |   | 15.1% |
  | 8.2% | |||
  | 8.4% | |||
29/2  | 6573 | 7082 |   | 16.6% |
  | 13.9% | |||
  | 17.6% |
Table4.Main partition of wave functions for positive-parity states of 71Ga within the JUN45 interaction in the
Table 2 presents the moments calculated using
In Fig. 5, these results indicate that the yrast sequence of levels includes 3/2
Similarly, the band (b) is built on 9/2
A novel sequence (c) is built on the 3/2
As illustrated on the right side of Fig. 5, the calculated energies of the positive-parity states, which adopt the 9/2+ level as the reference ground state, agree well with the experimental results. To coincide the levels and configurations for the JUN45 interaction with the observed experimental values, it is assumed that the levels of
From the results for the JUN45 interaction in Table 4, the band head of the 9/2+ state is dominated by
Large-basis SM calculations were performed to interpret the experimental level structures of the 71Ga. The ground state of 3/2


