

HTML
--> --> -->There is a global effort to search for NLDBD with various candidate isotopes using different experimental approaches. For example, 76Ge is widely used in high purity germanium semiconductor detectors [2-4], while 136Xe is usually the target of monolithic liquid detectors [5, 6]. GERDA [2], CUORE [7], and KamLAND-Zen [5] experiments have recently established the most stringent half-life lower limit respectively for 76Ge, 130Te, and 136Xe decaying into the ground state of their daughters. Those limits are on the order of
The PandaX-II detector [8] is a large dual-phase liquid xenon time projection chamber (TPC). The primary scientific goal is to directly detect possible collisions of dark matter candidate particle WIMP (Weakly Interacting Massive Particle) and xenon nuclei [8-10]. However, with a target mass of 580 kg of xenon and a natural isotopic abundance of 8.9%, it contains 51.6 kg of 136Xe and gives us the possibility to search for NLDBD with a reasonably large amount of isotope.
In this paper, we present the NLDBD search results with 403.1 days of data from the PandaX-II experiment. Section 2 will describe the PandaX-II detector and the data taking campaigns in year 2016-2018. In Section 3, we outline the data analysis procedure, with the energy reconstruction and event selections adjusted specifically for the high energy region of interest (ROI). In Section 4 and 5, we establish the background model from Monte-Carlo and fit the energy spectrum to identify possible NLDBD signal. We also discuss in details different contributions to systematic uncertainties. We summarize and give an outlook for NLDBD physics potentials with large liquid xenon detectors in the last section.
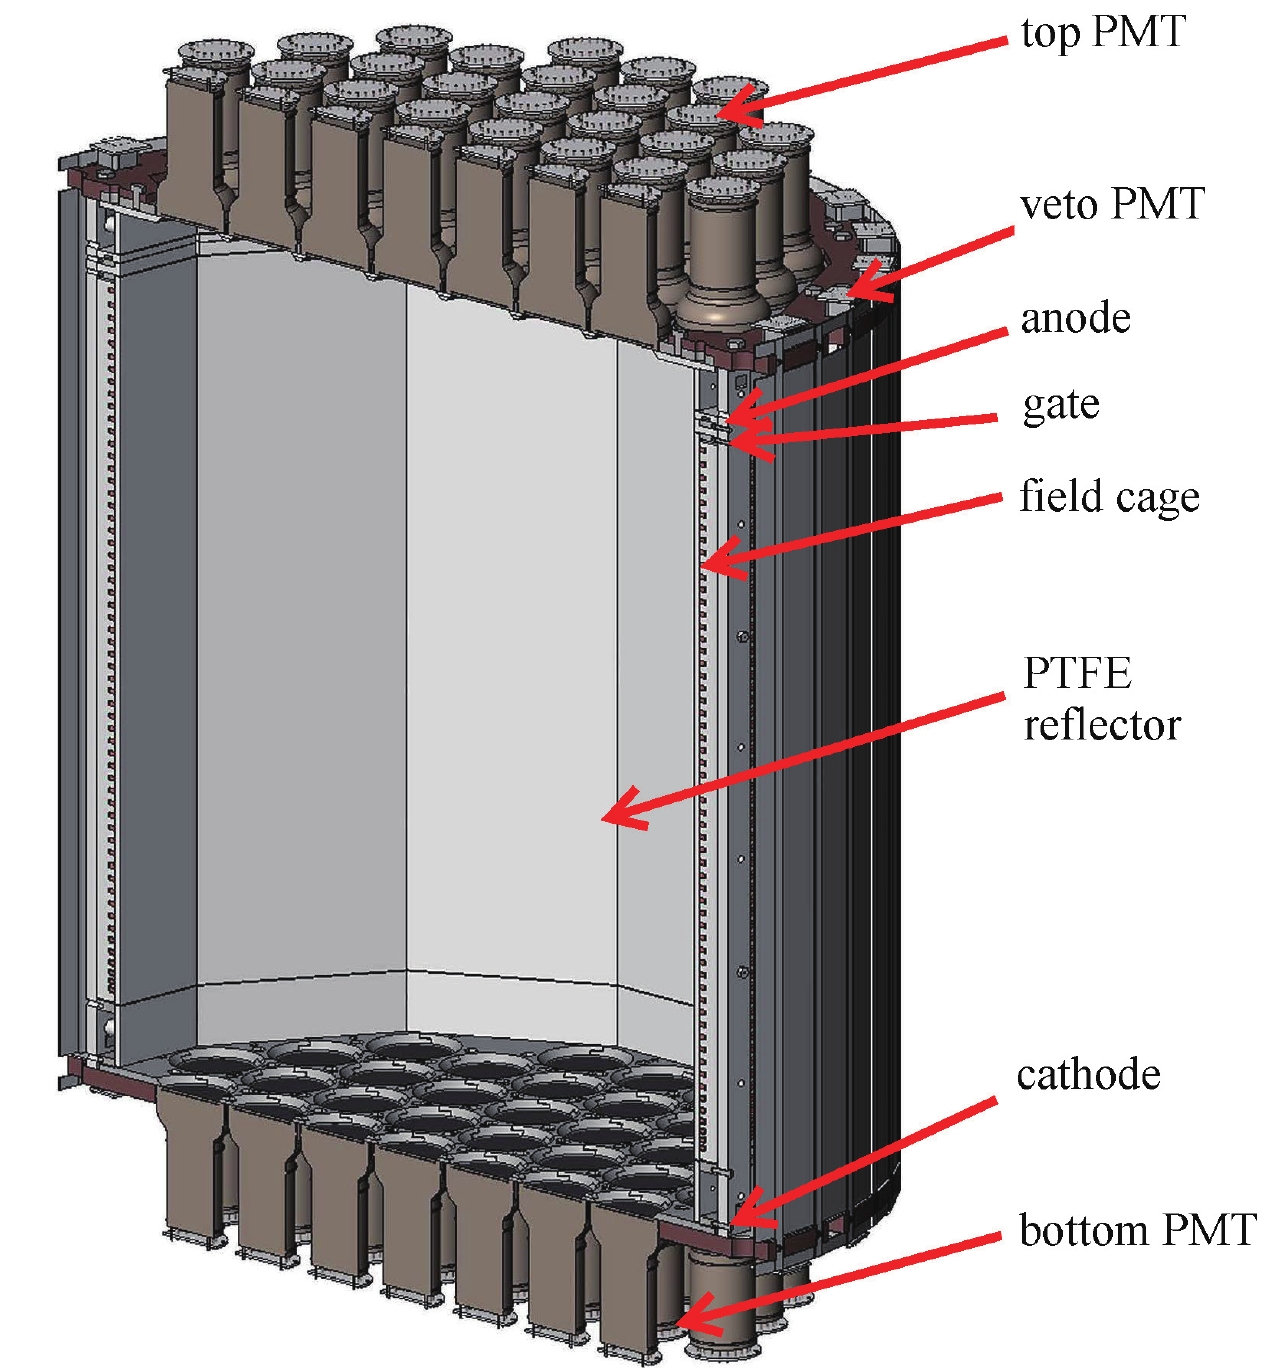 Figure1. (color online) Schematic drawing of the PandaX-II TPC. Key components such as top and bottom PMT arrays, PTFE reflectors, and electrodes are highlighted. The figure is adapted from [8]
Multiple layers of passive shielding outside the TPC include copper, inner polyethylene, lead, and outer polyethylene (see Fig. 2). Bricks or panels of those materials are concatenated into octagonal shape. The gap between the innermost layer and the TPC vessel is flushed by nitrogen gas in order to suppress radon concentration inside. Ambient radiation such as gamma and neutron background, is attenuated effectively with the help of passive shielding.
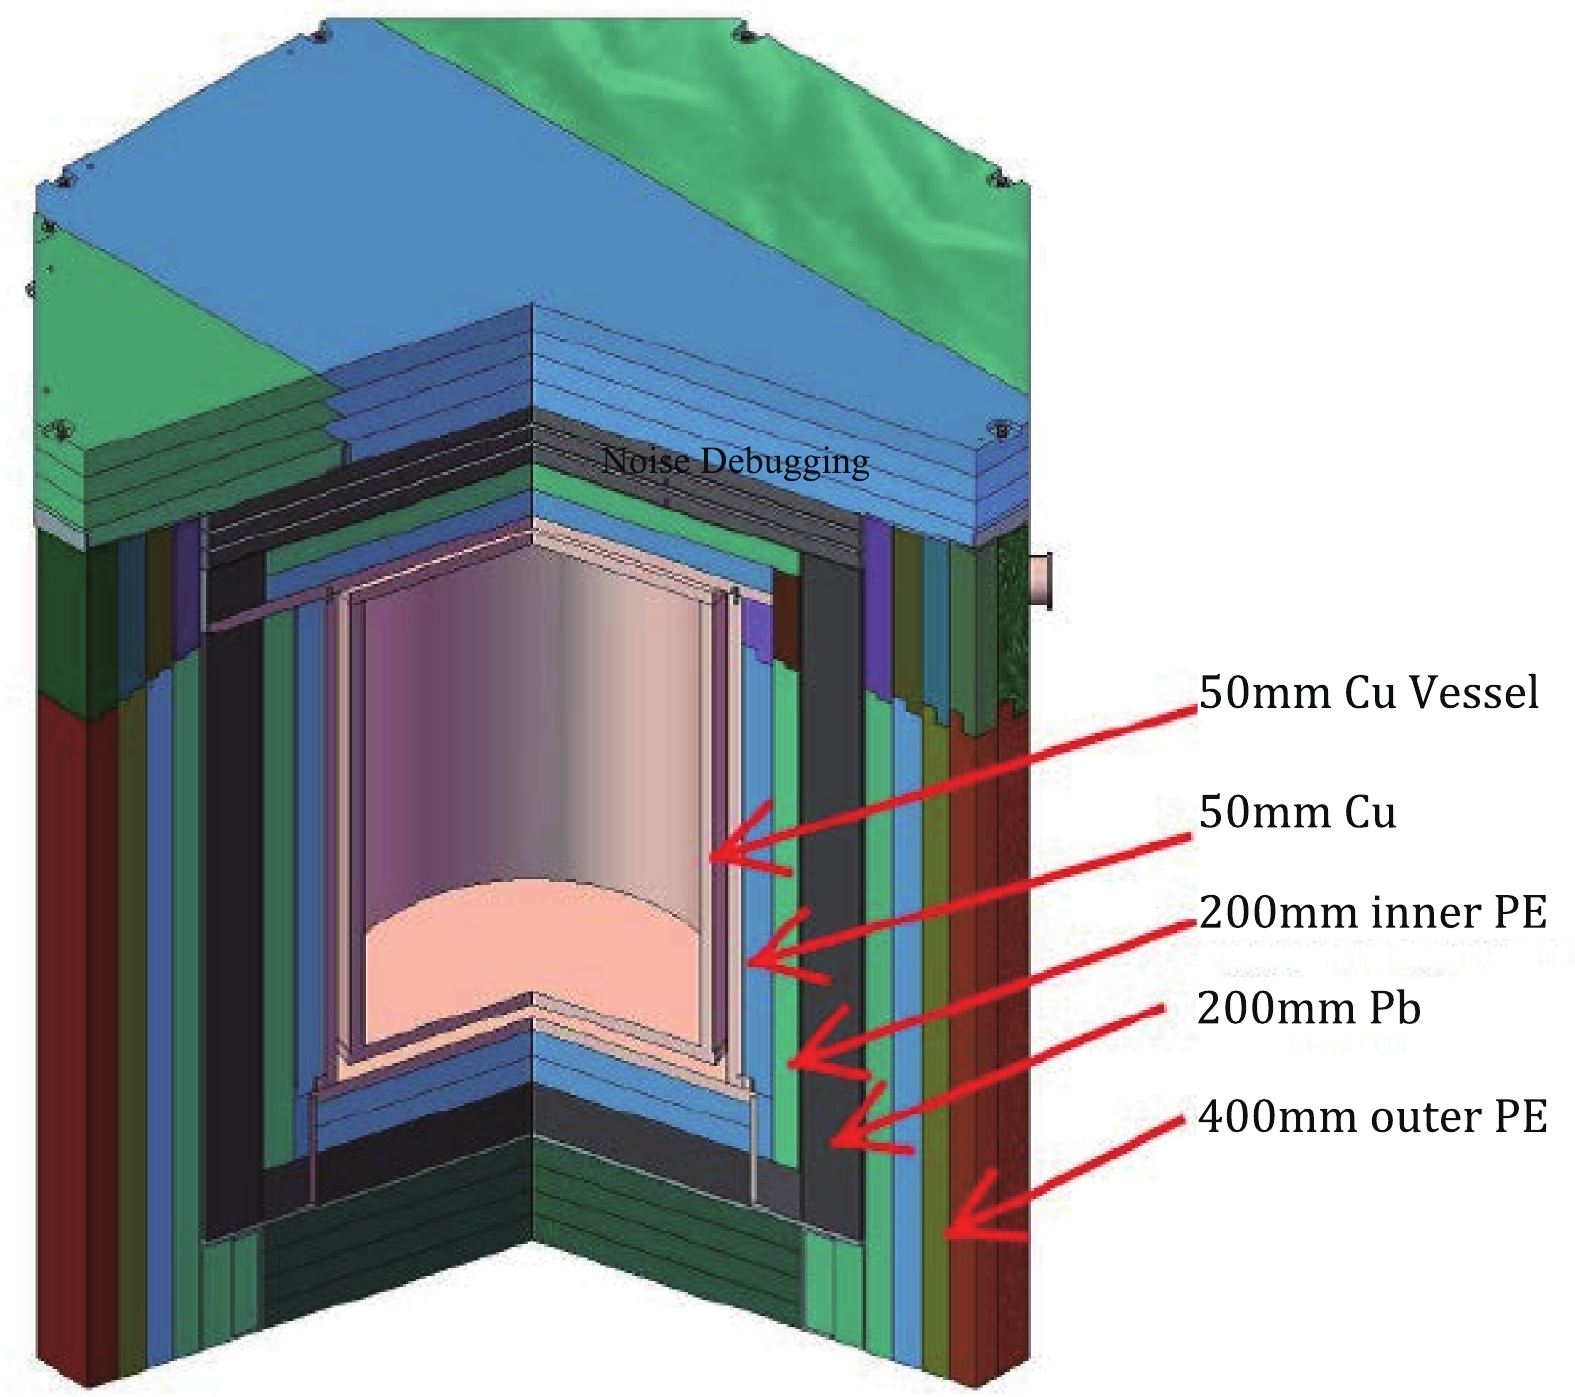 Figure2. (color online) Schematic drawing of the layered passive shielding system around the PandaX-II Detector. Thickness of different layers are labelled. The figure is adapted from [13]
In this paper, three sets of physics data from the past 3 years are used for NLDBD analysis, as shown in Table 1. The total accumulated exposure is 403.1 days. Run numbers in the table follow the convention used in dark matter direct detection physics analysis. Run 9 and 10 are the first two sets of physics runs for PandaX-II and have been previously published [9, 10]. Run 11 is a continuation of Run 10 with no change in run conditions. Run 11 data taking was undertaken smoothly from July 2017 to August 2018, interrupted only by a series of calibration runs, as shown in Fig. 3. The figure also shows that the drift electron lifetime, which is an indication for detector performance, was stable at above 400 μs most of the time. During this run, an additional 246.4 live-days of data was accumulated. This is the first time that we present an analysis with this new data set.
| data set | begin | end | live days |
| Run 9 | Mar. 9, 2016 | Jun. 30, 2016 | 79.6 d |
| Run 10 | Apr. 22, 2017 | Jul. 16, 2017 | 77.1 d |
| Run 11 | Jul. 17, 2017 | Aug. 16, 2018 | 246.4 d |
Table1.PandaX-II data sets used for this NLDBD analysis.
 Figure3. (color online) Data taking history of Run 11. Other than 4 interruptions of calibration and detector performance study, we took data continuously from July 2017 to August 2018. The left Y axis is the exposure in the unit of kg·yr. The dash horizontal line indicates the total exposure at 242 kg·yr, with a corresponding fiducial mass of 219 kg. The right Y axis is the electron life time while drifting in the field cage. The electron life time is measured to be stable in the last period of Run 11. The average value is used for position uniformity correction (explained later in the text) during energy reconstruction and shown in the figure.
2
3.1.PandaX-II data analysis workflow
PandaX-II data acquisition system (DAQ) records triggered waveforms of prompt scintillation light signal (commonly calledThe first step of data preprocessing chain process waveform of individual PMT. After the Single Photoelectron (SPE) correction, which we will describe later, we group these waveforms into individual pulses, known as hits, using a hit finding algorithm.
The second step is to group coincident hits of PMTs to construct light signals. Waveforms from individual pulses are summed up and the key parameters are calculated for the summed pulse. We then classify these signals into
Finally we reconstruct the positions of sites in each event. The Z direction follows electron drift direction and points upward while X and Y directions define the horizontal plane. The X and Y coordinates of each track are calculated from
2
3.2.Energy calibration and reconstruction
The detector's response at MeV level is calibrated using external 232Th source capsules. The source is deployed through the calibration loops inside the TPC outer vessel. A full absorption gamma peak from 208Tl at 2615 keV can be seen in both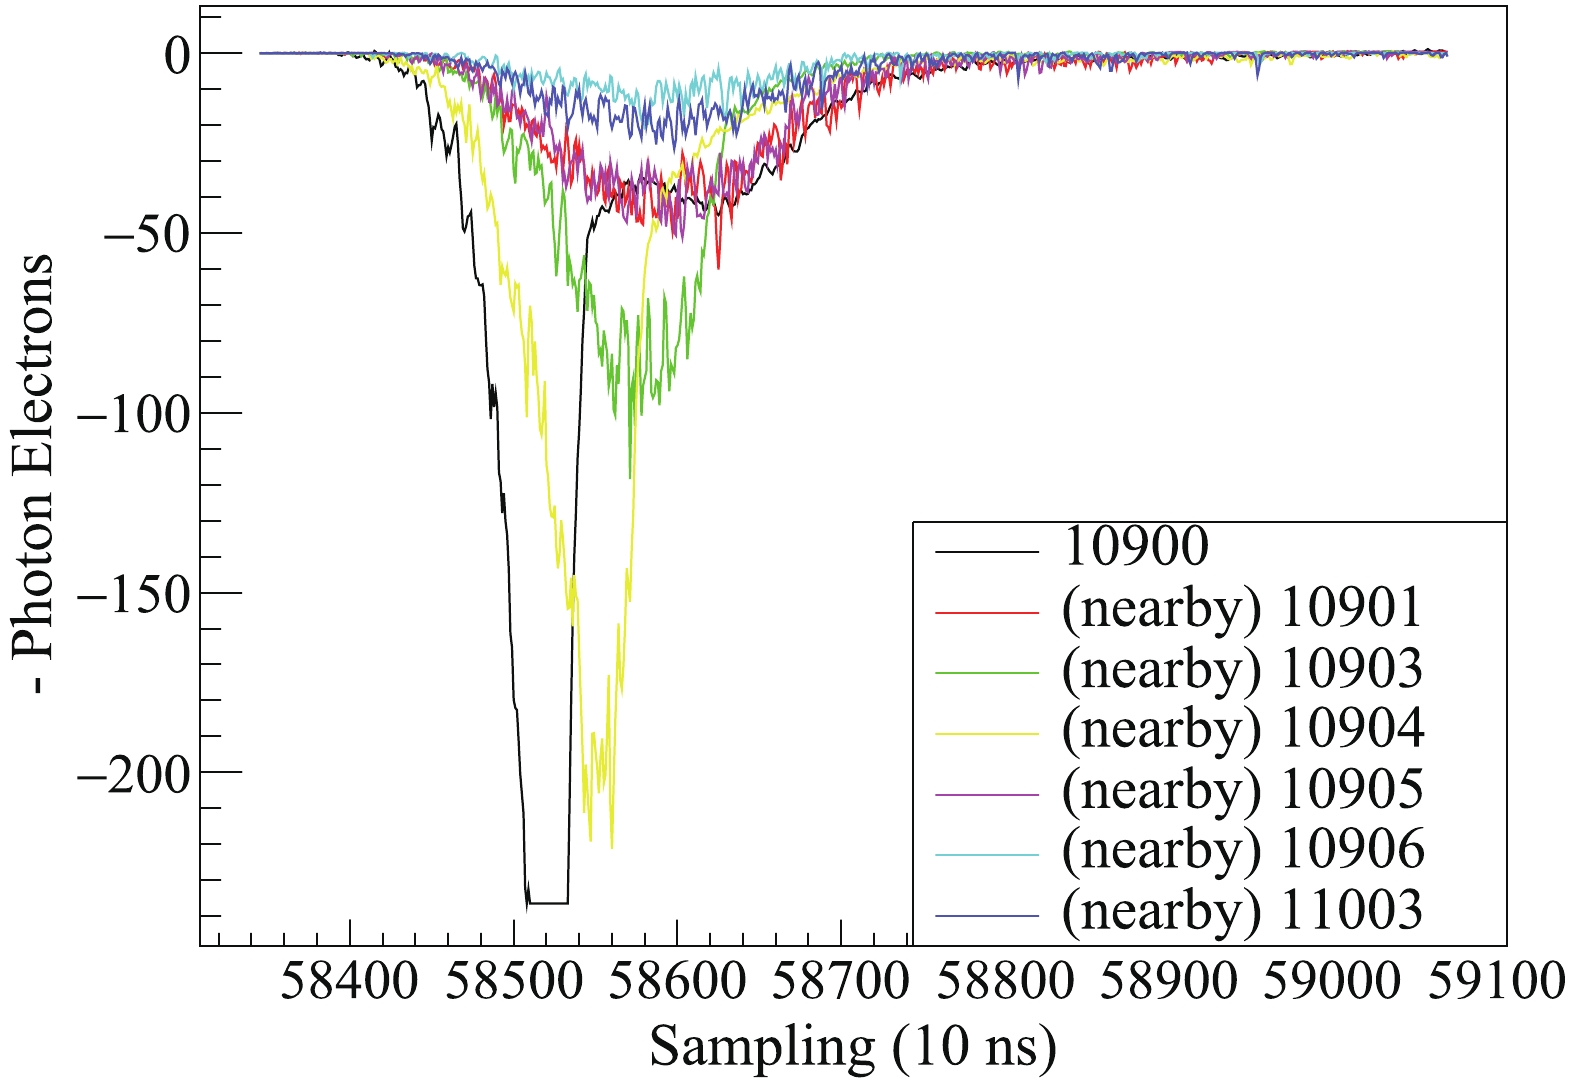 Figure4. (color online) Examples of saturated waveform of PMTs. Different traces show waveforms from different top PMTs from a high energy event. The saturated PMT (black and yellow line) has asymmetric peak in its waveform, where the rising edge is steeper compared to the other ones. For PMT 10900, a typical PMT that experiences saturation problem, clipped peak is also observed as the digitizer saturates.
In our analysis, we used pulses from the bottom PMT array to reconstruct the energy of
SPE correction Hit pulses are scaled by the individual SPE values of PMTs so that the area of pulse represents the number of photoelectrons (PE). This correction compensates possible PMT gain drift during detector operation.
Position dependent correction The number of PE that each PMT collects for any specific event depends on the X, Y, and Z position of the interaction vertex. The position dependence is mapped out with internal radioactive sources such as 83Kr or activated 127mXe. 127mXe emits 164 keV gamma rays and is better suited for position dependence correction at the high energy region. We divide the sensitive volume into small voxels to map out detector response at different position. In turn PMT response for any events is corrected with the mapping.
Secondary electrons from xenon ionization are recombined with or attached to the impurities in the drifting process. The electron loss is usually characterized by electron life time in the unit of μs. The measured
Energy reconstruction To reconstruct the energy of an event, we follow the energy sharing formula used in dark matter analysis:
$ E = W \times \left(\frac{S1}{PDE}+\frac{S2}{ {EEE} \times {SEG}}\right), $  |
$ S2 = S2_{ {\rm Bottom}} \times (T/B+1), $  |
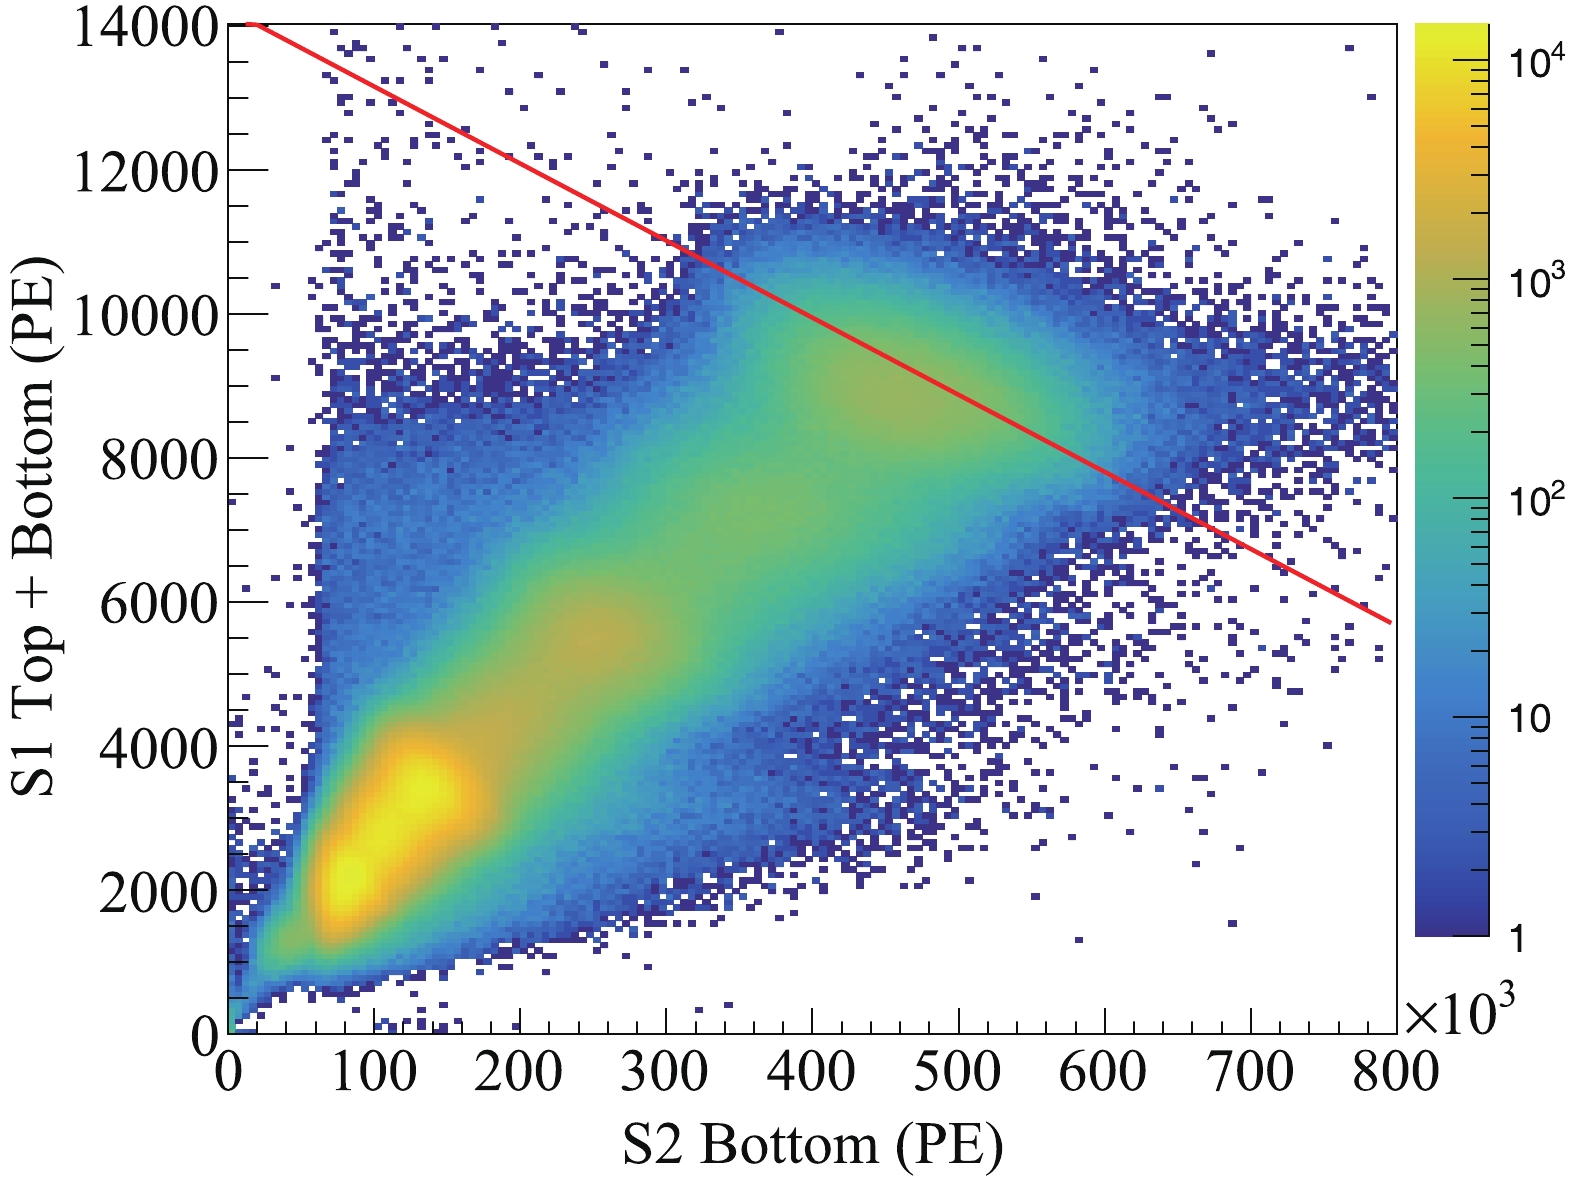 Figure5. (color online) Anti-correlation between
 Residual non-linearity correction A spectrum with optimized energy resolution can be obtained with the above mentioned procedures. However, peaks could be identified slightly off the true energy of the characteristic gamma lines. Another correction is carried out to shift those peaks and correct the non-linearity of detector's energy response. With a relatively large energy resolution, gamma lines on top of continuum background may not peak in the exact gamma energy. Monte Carlo simulation is used to study such shifts. The detailed simulation process is discussed in Sec. 4. Peaks from 915 to 2615 keV are used to correct the residual non-linearity, as shown in Fig. 6. For each run, six peaks are used to fit a third-order polynomial function with zero intercept. Then energy of each event is corrected with these fit functions.
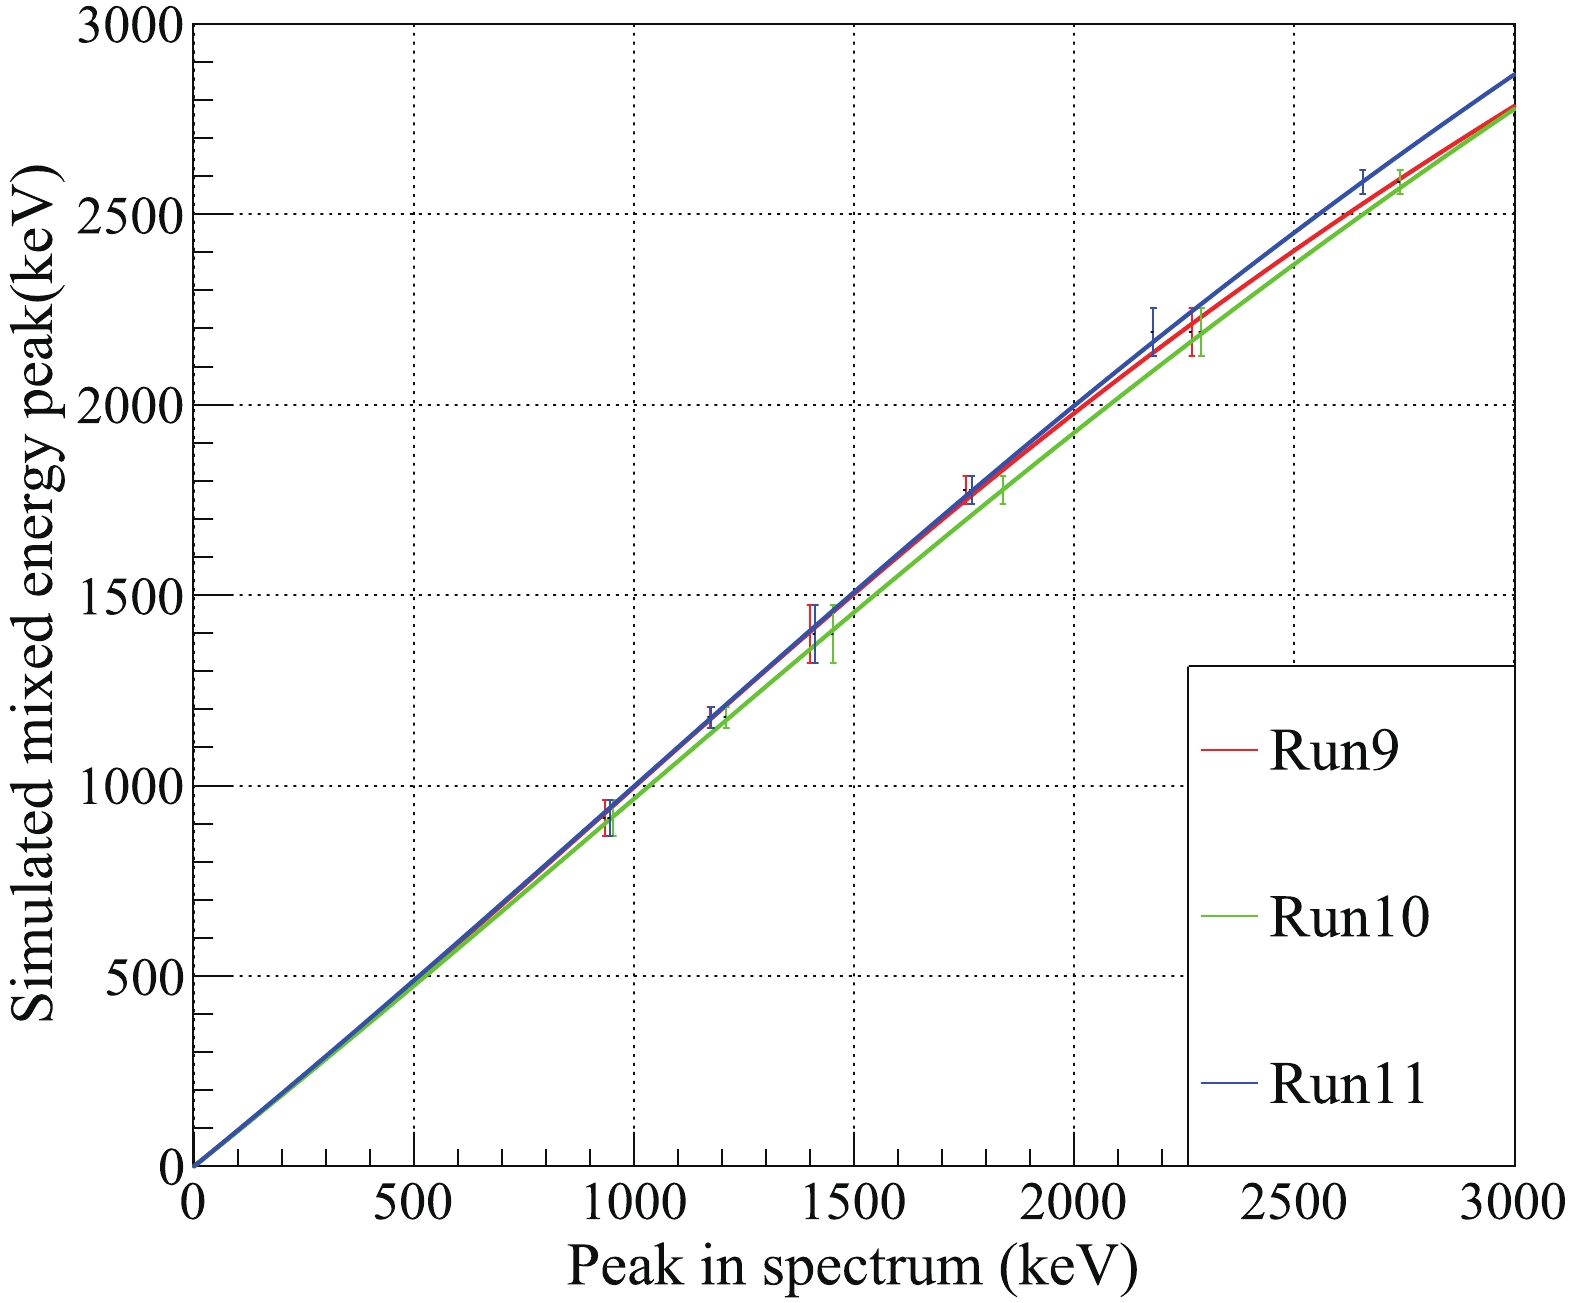 Figure6. (color online) Peak matching and residual nonlinearity of the three runs. The X axis is the detected peak position from 915 to 2615 keV before corrections. The Y axis is the expected peak position from Monte-Carlo simulation. Three-order polynomial functions are used to fit the data to determine the correction functions for corrections.
2
3.3.Event selection cuts
The original cuts from dark matter analysis are inherited but tuned to adapt to the high energy region in this study. We first apply the single-site cut, ROI energy cut, veto cut, and fiducial volume cut to reject a vast majority of background events. The signal quality cuts, including a few pulse shape cuts,Single-site cut We focus on single-site (SS) events from NLDBD and reject all events with multiple
ROI cut In the NLDBD final spectrum fit, we use events with energy in the range of 2058 to 2858 keV, i.e.
Veto cuts The large majority of NLDBD events inside the field will not deposit any energy outside. On the contrary, penetrating particles such as muon may deposit energy in the veto region and is rejected with an offline coincidence analysis between veto signal and
Fiducial volume cut Fiducial volume for NLDBD analysis is optimized according to the distribution of high energy events. Fig. 7 shows the spatial distribution of high energy events in the ROI. The X axis shows square of event radius. The Y axis is the negative drift distance, which is equivalent to the relative vertical coordinate in space. Number of events per bin remains relatively constant along the radius direction since xenon self-shielding is not as effective for high energy events. Abnormal "stripes" of excess events are observed vertically, which is due to malfunctioning of PAF position reconstruction algorithm with saturated PMT pulses. This problem also leads to a decrease of event density at the edge of the sensitive volume. To be conservative, we force
 Figure7. (color online) Spatial distribution of ROI event in the PandaX-II TPC. The Y axis is in the electron drift direction with the liquid and gas interface at 0 mm. Single scatter cut, quality cut, and veto cut are added. Fiducial volume used in the NLDBD analysis is marked as red rectangle.
We estimate the uncertainty of the fiducial mass with position reconstruction uncertainties. The uncertainty of position reconstruction in the radial direction is 21.5 mm and given by the mean difference between PAF and TM method for events in the ROI. The uncertainty in the vertical direction is 3 mm, mainly from the uncertainty of drift velocity measurement. Overall, we obtained an uncertainty of 32 kg for our fiducial mass.
Pulse shape cuts Two pulse shape cuts are used to reject pulses with positive overshoot. Ripple ratio cut calculates the overshoot of
Top/bottom asymmetry cut The cut is defined as the difference between numbers of PE collected by top and bottom PMT arrays for
Position quality cuts This group of cuts reject events with poor position reconstruction quality. Events with unsatisfactory PAF fitting quality are rejected. We also require the difference between positions reconstructed by PAF and TM methods to be less than 40 mm.
Impacts of these successive cuts are shown in Table 2 and Fig. 8. In Table 2 we show the number of survived events and estimated signal efficiencies of the relevant cuts. Detector trigger efficiency at high energy region is estimated to be about 100% and neglected here. With a wide ROI, almost all the NLDBD events would fall in the region and the ROI cut efficiency is neglected. Veto cut efficiency is not needed since we only study single-site NLDBD events with full energy deposition. Fiducial volume cut is reflected in the final136Xe mass calculation. Efficiencies of signal quality cuts are evaluated conservatively by comparing the number of events before and after applying corresponding cut. For example, the pulse shape cut efficiency is
| events | signal efficiency (%) | |
| single scatter cut | 38070871 | 93.4 |
| ROI cut | 771356 | ≈100 |
| veto cut | 433482 | ? |
| fiducial volume cut | 32132 | ? |
| pulse shape cut | 31900 | 99.3 ± 0.8 |
  | 31837 | 99.8 ± 0.1 |
| position quality cut | 31511 | 99.0 ± 0.1 |
| total | ? | 91.6 ± 0.8 |
Table2.Event selection tree and the efficiency for NLDBD signal. Signal efficiency stands for the ratio of NLDBD events that can pass through the step.
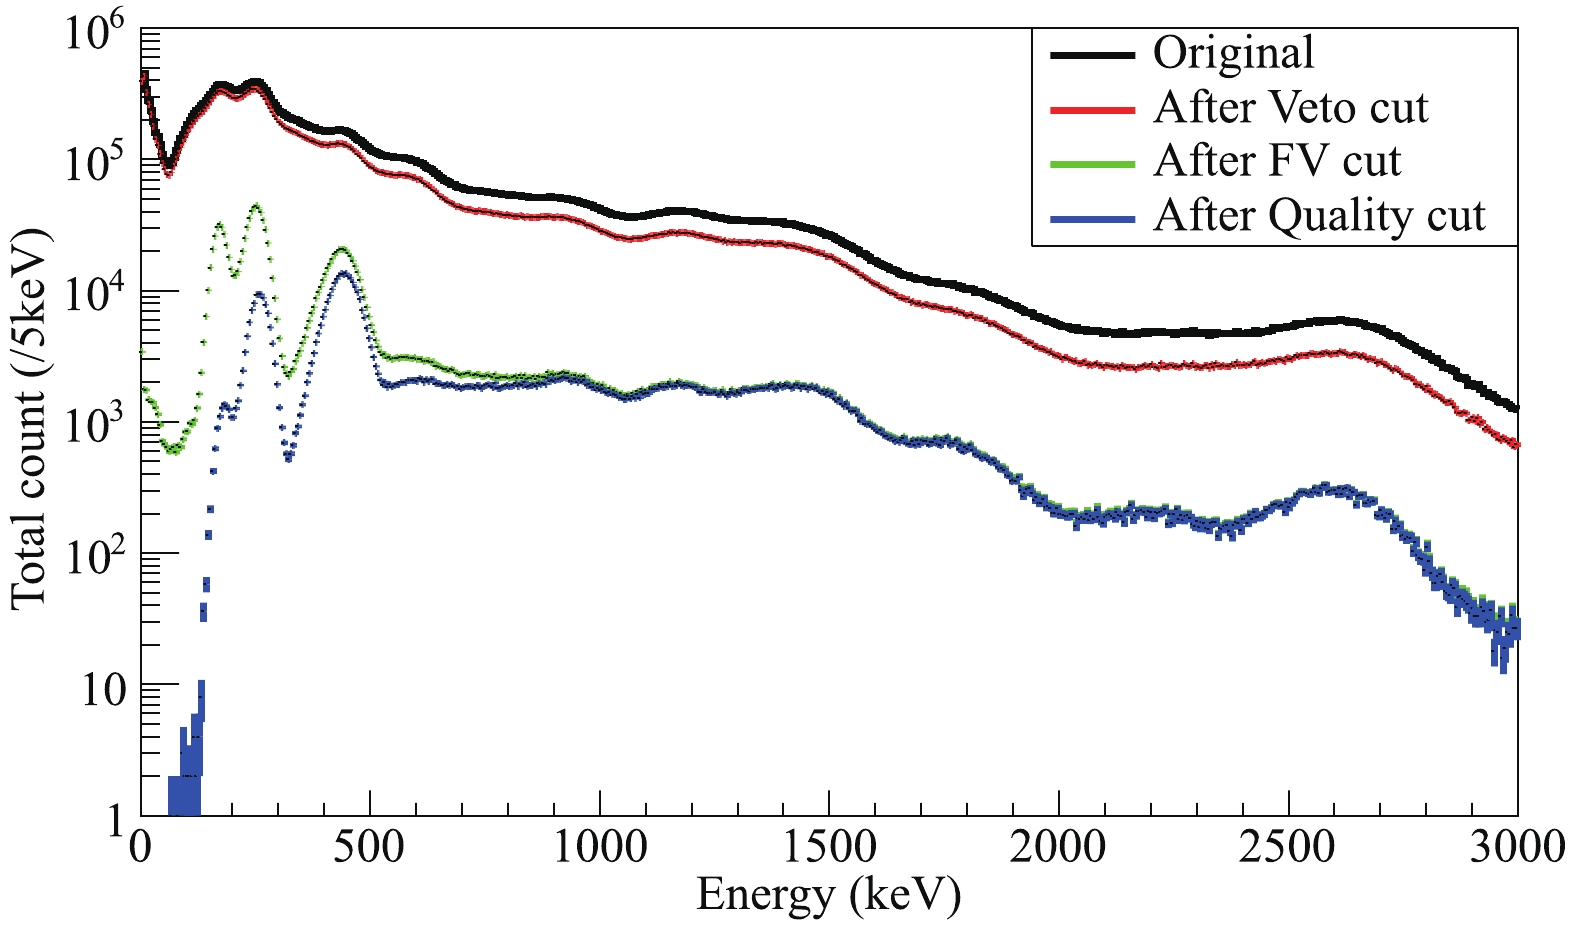 Figure8. (color online) Energy spectrum from 0 to 3 MeV after various cuts. Impacts of different cut can be seen in the plot. Backgrounds are rejected effectively by veto and fiducial volume(FV) cuts. The signal quality cut is tuned specifically for high energy events, and yields a lower efficiency for low energy events far away from the ROI.
Background spectral shape in the ROI from various components is estimated with Monte-Carlo simulation based on the Geant4 toolkit [17]. For a given radioactive source originating from a specific detector component, we first generate a large number of events and obtain their energy deposition information in xenon. Detector response is then considered. Hits are merged together when their distance in Z direction is smaller than 8.5 mm, which corresponds roughly to the width of a
To compare simulation with calibration data, we simulate a set of 232Th events originating from the calibration tube. Simulated data go through the same single scatter cut, veto cut and fiducial volume cut as data. The resulting SS/(MS+SS) ratio is 50.2% while the same ratio from calibration data is 55.2%. We assign a conservative ±9% as a systematic uncertainty to account for this difference. To verify the MC spectra, we compare the simulated 232Th spectrum with calibration data. The mean difference of bin values between the two spectra is calculated to be 6%, which is regarded as the uncertainty of the Monte-Carlo model.
Background contribution from 222Rn dissolved in the xenon liquid is out of secular equilibrium and considered separately. The 214Bi in the 222Rn decay chain, a beta emitter with the associated 2447 keV gamma ray, is largely removed due to the delayed coincidence of 214Po (see later). Its contribution from the veto region (about 100 kg of liquid xenon) can also be neglected by the active veto of beta energy and the self-shielding effects of liquid xenon. For other isotopes, such as 238U, spectra from all the components are summed up with a weighting factor, which is derived from the relative radioactivity of each component, as reported in Ref. [18].
In addition, we take the two neutrino double beta decay (2NDBD) of 136Xe into consideration. Energy distribution of two emitted electrons from 2NDBD is simulated with the decay0 generator [19], and then the summed electron energy spectrum is added to the fit. The 2NDBD event rate is fixed to 48 per kg
The fit is done with a software package called Bayesian Analysis Toolkit (BAT) [22]. This software applies Bayes' Theorem to optimize multiple variables when given a likelihood function. The fit is done for each run independently, and the summed fit result is shown in Fig. 9. The fitted isotope rates are propagated to the final NLDBD fit, used as inputs for Gaussian priors. Four parameters are added in the fit model to describe energy resolution at 1173 (60Co), 1447 (40K), 1764 (214Bi), and 2615 (208Tl) keV position in the spectrum. The energy resolution at any other energy is taken as the interpolation of resolutions of two nearby peaks. Fitted energy resolutions at 2615 keV peak are (4.8±0.1)%, (4.2±0.1)%, and (4.3±0.1)% respectively for run 9, 10, and 11. Energy resolution in Run 9 is slightly worse, since the uniformity correction map with the 164 keV gamma peak was obtained with a calibration period only towards the end of that run.
 Figure9. (color online) Data and best-fit curves between 1 to 3 MeV to evaluate the background contributions from radioactive sources. The spectrum is a summation of three runs. The shaded region around NLDBD Q-value is not used in the fitting process.
Background rate from radon in xenon medium is cross-checked with a so-called Bi-Po coincidence study. For example, 214Bi, which is after 222Rn in the 238U decay chain, beta decays to polonium nucleus, with a series of signature gamma rays emitted. 214Po quickly decays to 210Pb and a 7.7 MeV alpha particle with a half-life of 164.3 μs. Consequently, decay of 214Bi and 214Po is very likely to happen within a readout window width of 1 ms, which is easy to identify. As discussed in Ref. [23], we select the sequential Bi-Po decay events by finding two adjacent
The fitted NLDBD rate
$ C = \frac{\Gamma_{0 \nu} \times T \times N_{\rm A} \times R \times M \times \epsilon }{m} , $  |
The best fit model combines data of three runs in one BAT fit. Background rate is independent in each of the runs, while the NLDBD decay rate is forced to be one parameter. In total we have
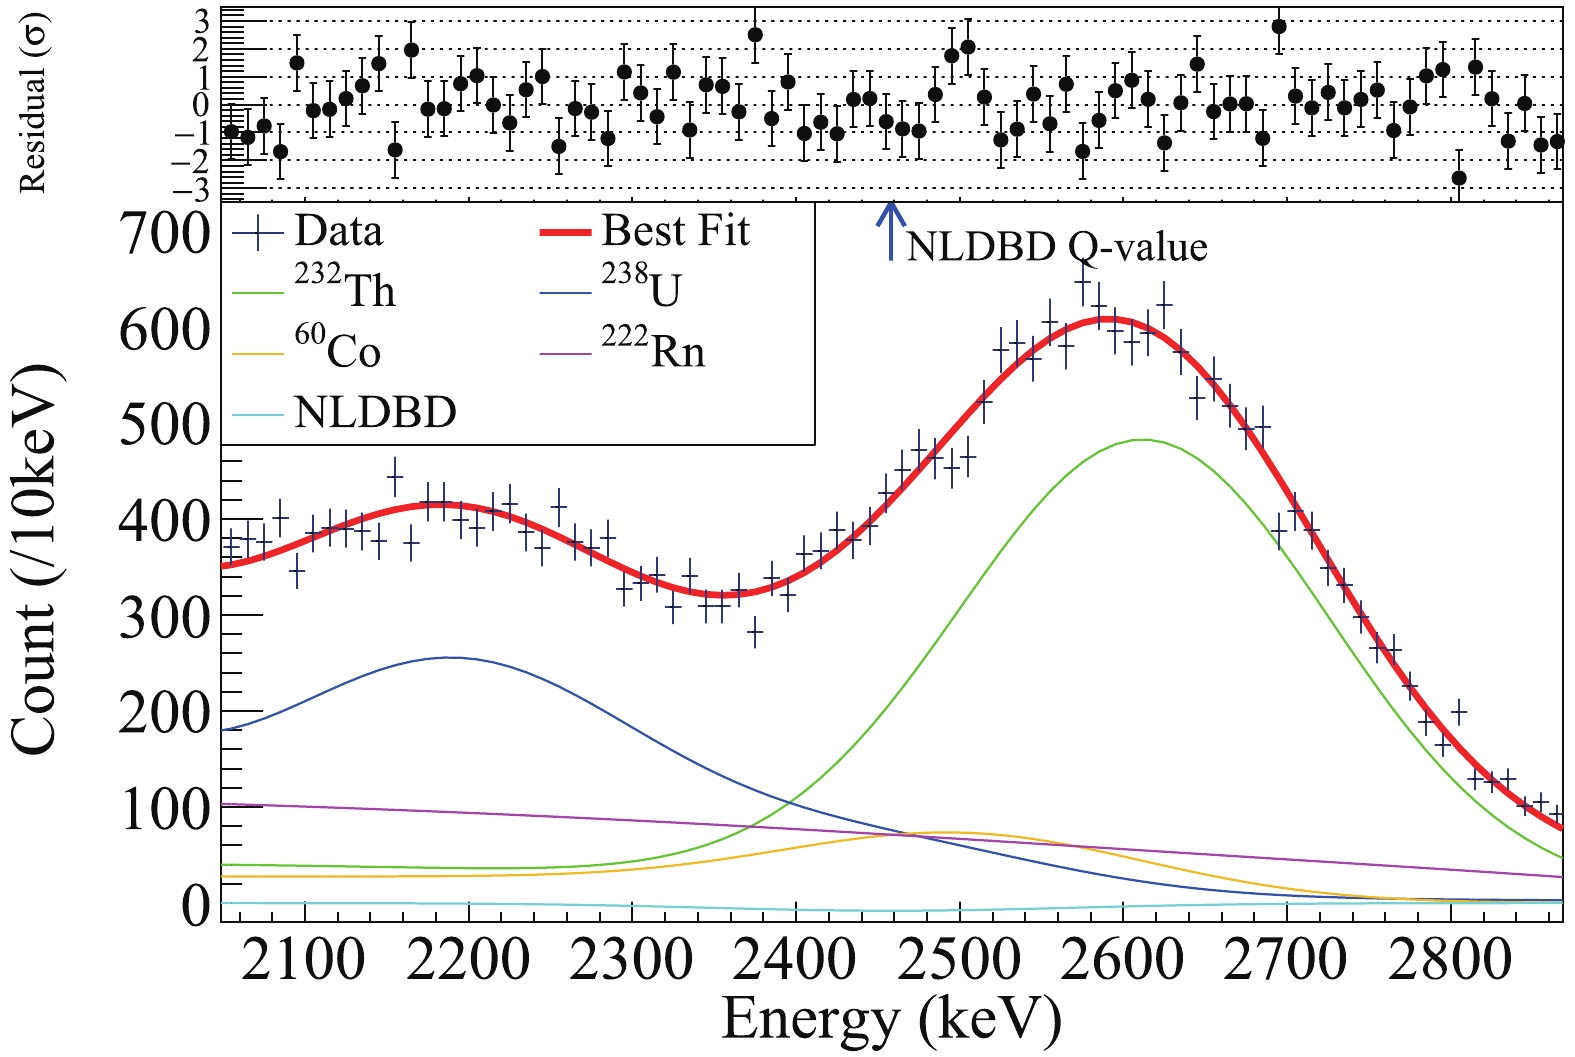 Figure10. (color online) (Bottom) Energy spectrum and best-fit model for the NLDBD ROI. Three runs are fitted simultaneously with shared NLDBD rates and the spectrum is the summation of all the data. The fits are dominated by 2204 and 2615 keV gamma peaks from 238U and 232Th decay chain respectively. An NLDBD rate of
 | item | run 9 | run 10 | run 11 |
| 60Co | 14.5 ± 1.0 | 13.3 ± 1.0 | 11.6 ± 0.6 |
| 222Rn chain | 33.4 ± 6.3 | 31.9 ± 5.2 | 22.9 ± 3.3 |
| 232Th chain | 63.6 ± 2.4 | 55.8 ± 2.0 | 67.6 ± 1.3 |
| 238U chain | 36.6 ± 4.2 | 34.8 ± 3.4 | 41.0 ± 2.1 |
| NLDBD | ?0.93 ± 0.79 | ||
Table3.Summary of best-fit parameters. Event rates are in the unit of counts per kg·yr.
We also estimate systematic uncertainties induced by different parameters, as listed in Table 4. As in Ref. [24], we split the uncertainty contribution into additive part (
| values | uncertainty | additive sys./ (10?23 yr?1) | scaling sys. | |
| signal detection | 91.6% | 0.8% | 0.83% | |
| fiducial mass | 219 kg | 32 kg | 14.7% | |
| MC rate | ? | 9% | 9% | |
| MC shape | ? | 6% | 0.083 | 0.49% |
| energy scale | 94%-100% | 1% | 0.045 | ? |
| energy resolution | 4.2%-4.8% | 0.1% | 0.089 | 2.47% |
| fit bias | ? | ? | 0.041 | 0.04% |
Table4.Summary of the additive and scaling systematic uncertainties of different contributions. The range of energy resolution and energy scale values used in the three runs are shown.
We carry out a set of pseudo-experiments with toy Monte-Carlo spectrum. Toy spectra are generated according to the fitted background model and mixed with varied NLDBD events. For example, for energy resolution
The energy scale uncertainties, estimated to be 1% at Q-value, also contribute to the uncertainty of the NLDBD rate. We modify the energy scale by ±1% when producing the pseudo-experiment data, and repeat the constrained fits mentioned above. For Monte Carlo shape uncertainty, we modify the height of each characteristic peak either by +6% or -6% in the simulated spectrum, and repeat the steps above. The uncertainty of the fitting process itself, known as fit bias, is derived similarly but with no change of the systematic sources.
Results of systematic uncertainty evaluation are listed in Table 4. Under the assumption that all the uncertainties are un-correlated, the total systematic uncertainty can be calculated as:
$ \sigma_{\rm{ syst }}\left(\Gamma_{0 v}\right) = \sqrt{\sum\limits_{i} \left(\sigma_{{\rm add}, i}^{2}+\sigma_{{\rm scaling}, i}^{2} \Gamma^{2}_{0 v}\right)}~. $  |
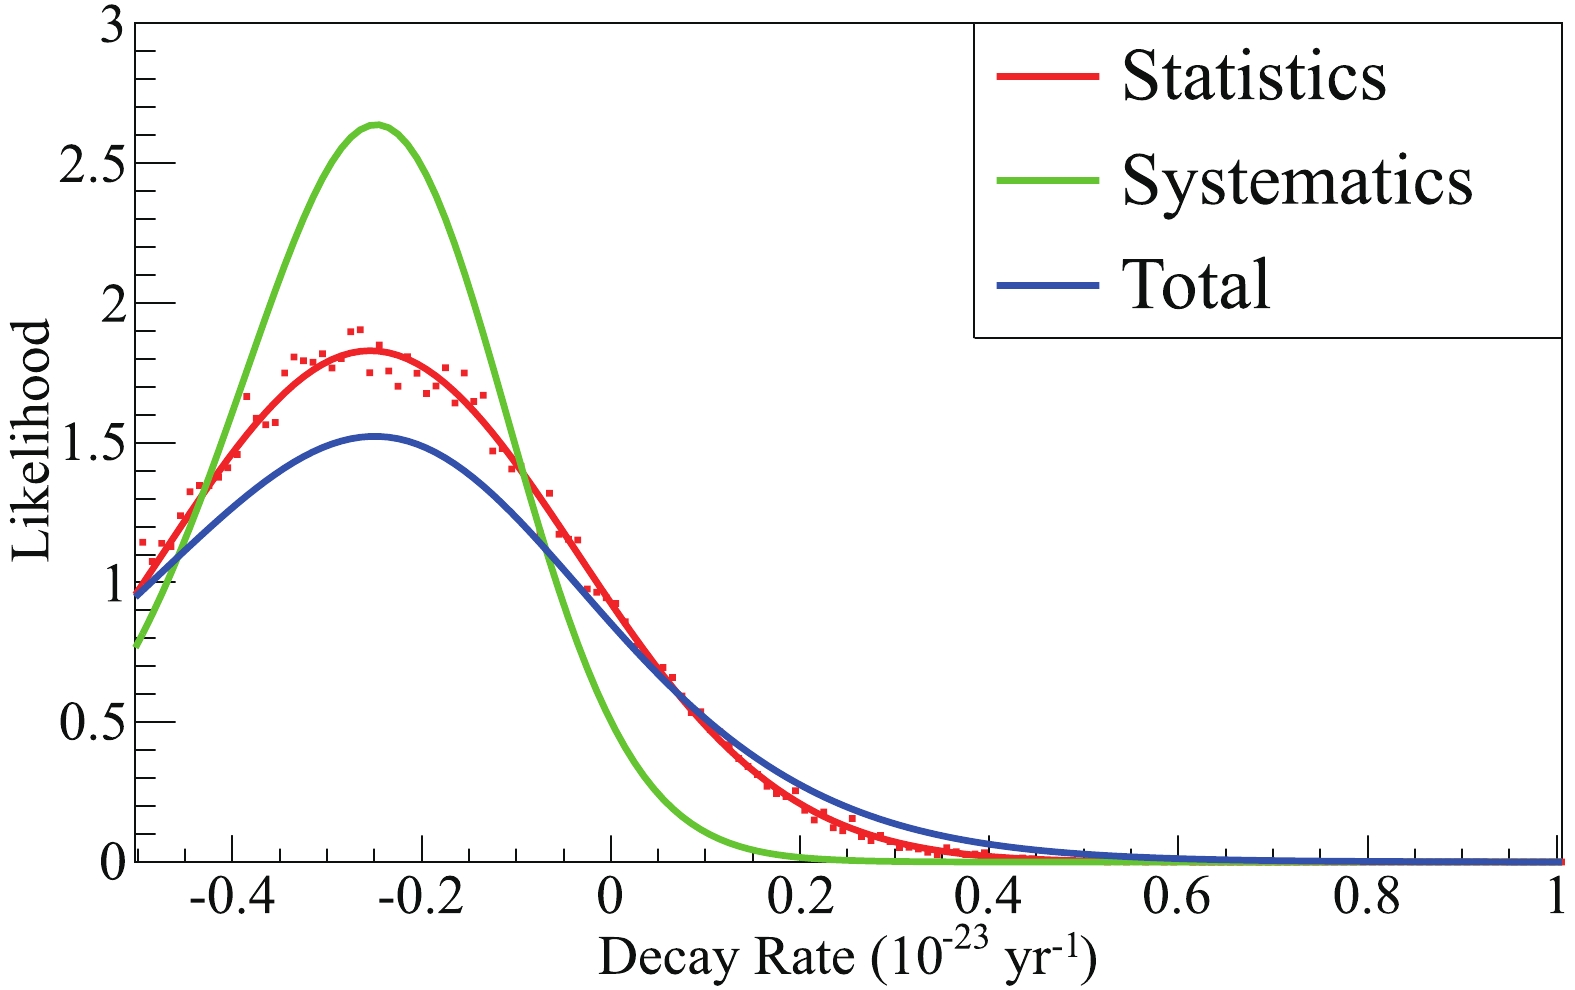 Figure11. (color online) NLDBD rate probability distribution. The red scattered dots are from BAT fit result, while the red line is their gaussian fit.
The sensitivity of
Due to limited performance in energy resolution and background rate, our result is not as competitive as the dedicated NLDBD experiments, such as KamLAND-Zen [5]. However, it shows the multi-physics reach of dual-phase liquid xenon detector besides dark matter WIMP search. PandaX-II has been focusing on signals and background in the keV range while NLDBD region of interest is mostly above 2 MeV, where PMT saturation issue deteriorates resolution significantly. On the other hand, we recognize that the resolution is not intrinsically limited. The XENON1T experiment has shown excellent energy resolution [32, 33], comparable with other liquid xenon TPCs. The PandaX collaboration is building the next generation PandaX-4T [34] detector and will use dual-dynode readout for PMTs, to avoid the PMT saturation issues altogether. PandaX-4T is expected to have a much improved energy resolution for double beta decay physics. PandaX-II also suffers from a high background rate in the NLDBD ROI since we can not take advantage of background suppression techniques developed for WIMP signals in the keV region. Techniques such as nuclear recoil and electron recoil discrimination are specific to WIMP searches. Effective self-shielding with detector medium at low energy become much less so at higher energy. In the proposed 30-ton detector such as DARWIN [35] and PandaX future generations, the fiducial volume in the core of the detector will be much more effectively shielded. At this future stage, dual-phase liquid xenon detector with natural xenon will be able to provide an alternative approach besides the proposed KamLAND2-ZEN [36] and nEXO [37].
We thank the indispensable logistics and other supports from the CJPL administration and the Yalong River Hydropower Development Company Ltd.
