 ,1,2,4, 任小丽1,2, 何洪林1,2,4, 吕妍1,2,3, 牛忠恩1,2,3, 常清青1,2,3
Trends and influencing factors of potential evapotranspiration in typical forest ecosystems of China during 1998-2017
SUN Wanxin1,2,3, ZHANG Li,1,2,4, REN Xiaoli1,2, HE Honglin1,2,4, Lü Yan1,2,3, NIU Zhongen1,2,3, CHANG Qingqing1,2,3通讯作者:
收稿日期:2019-10-7修回日期:2020-03-7网络出版日期:2020-05-25
| 基金资助: |
Received:2019-10-7Revised:2020-03-7Online:2020-05-25
作者简介 About authors
孙婉馨,女,河北保定人,硕士生,研究方向为生态系统生态学E-mail:sunwanxin95@126.com。

摘要
关键词:
Abstract
Keywords:
PDF (5043KB)元数据多维度评价相关文章导出EndNote|Ris|Bibtex收藏本文
本文引用格式
孙婉馨, 张黎, 任小丽, 何洪林, 吕妍, 牛忠恩, 常清青. 1998—2017年中国典型森林生态系统潜在蒸散的变化趋势及成因. 资源科学[J], 2020, 42(5): 920-932 doi:10.18402/resci.2020.05.10
SUN Wanxin, ZHANG Li, REN Xiaoli, HE Honglin, Lü Yan, NIU Zhongen, CHANG Qingqing.
1 引言
潜在蒸散(Potential Evapotranspiration,PET)表示在一定气象条件下,水分供应不受限制时,某一固定下垫面可能达到的最大蒸发蒸腾量[1]。它是估算实际蒸散[2]和作物需水量[3]的基础,也是评价区域干湿状况[4]和制定水资源管理决策[5]的重要指标。PET的变化特征及其影响因素研究一直是国内外****关注的热点问题[6]。20世纪50年代以来,随着全球变暖,包括中国在内的众多区域的蒸发皿蒸发量和PET的计算结果反而呈现出下降趋势[7,8,9],中国区域太阳辐射的下降、风速的降低和相对湿度的增加被认为是引起PET下降的主要原因[10,11,12]。例如,Zheng等[12]发现日照时数是引起中国区域1960—2009年PET变化的重要因素;Wang等[13]认为1961—2013年间中国区域PET的下降趋势由风速主导,其次是温度、日照时数和相对湿度;Liu等[14]确定相对湿度是1960—2007年间全国尺度上对于PET变化最敏感的因素;Jiang等[15]发现中国西南地区20世纪90年代前生长季PET的降低主要源自日照时数和风速的下降;Liu等[16]认为1961—2014年间黄淮海平原PET的降低主要由相对湿度和日照时数引起。
以往研究往往基于气象部门的台站观测数据,采用联合国粮农组织(Food and Agriculture Organization of the United Nations, FAO)推荐的Penman-Monteith模型(PM)进行流域、国家和全球尺度PET的估算。由于森林结构和过程的复杂性以及数据的有限性,关于森林生态系统潜在蒸散的研究相对较少[17,18,19]。已有研究表明,与FAO设定的参考作物相比,森林具有更大的叶面积指数、冠层导度和更低的反照率,因此PM方法可能会低估森林PET[20,21]。利用PM方法计算森林潜在蒸散需要获取森林叶面积指数(LAI)和冠层导度的观测数据[17],相对其他方法较为困难,且PET模拟值对植被参数差异的敏感性大于气候差异[22]。也有研究[20,21]认为,与PM、Hamon、Thornthwaite等方法相比,Priestley-Taylor方法估算森林PET的效果可能更好。并且,20世纪70年代末以来,随着中国城市化进程不断加快,许多原本位于野外的气象观测台站现多处于城镇边缘,甚至被动进入城市内部,气象观测环境的变化在一定程度上影响了气象观测要素的代表性,其观测数据存在着对温度的高估[23]、相对湿度的低估[24]等问题,无法准确表征自然生态系统的气象条件。由于这些偏差所引起的森林PET计算结果的不确定性尚不清楚。
本文基于中国生态系统研究网络(Chinese Ecosystem Research Network,CERN)的11个野外森林生态系统台站近20年(1998—2017年)的长期气象观测资料,分别使用Penman-Monteith模型和Priestley-Taylor方法计算PET,定量分析了中国典型森林生态系统中的PET变化趋势及影响因素,量化了主要气象因子的贡献,并评价了基于国家气象台站观测数据计算的PET的偏差,为估算中国森林生态系统蒸散的变化特征及其对气候变化的响应提供参考。
2 数据来源与研究方法
2.1 数据来源
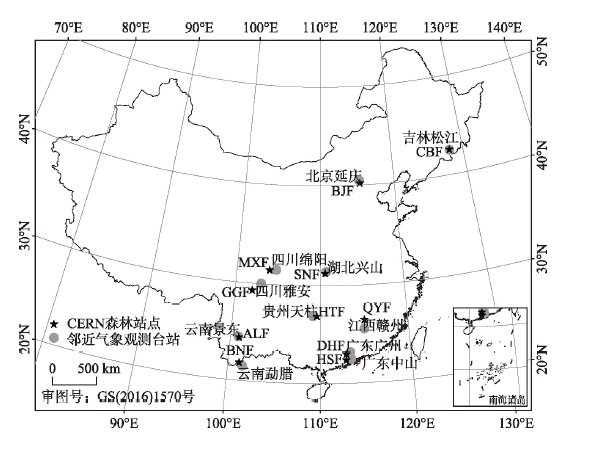
本文选用的中国11个森林生态系统跨越了温带、暖温带、亚热带和热带,林分类型包括混交林、针叶林、阔叶林和季雨林。图1展示了各森林生态系统的地理位置,表1列出了各森林生态系统的具体类型、海拔、年均温、年降水、优势种及土壤类型等信息。图1
 新窗口打开|下载原图ZIP|生成PPT
图1中国11个典型森林生态系统地理位置示意图
注:国家气象台站的对应站点代码分别为:吉林松江-54285,北京延庆-54406,四川绵阳-56196,湖北兴山-57359,四川雅安-56287,江西赣州-57993,贵州天柱-57840,云南景东-56856,广东广州-59287,广东中山-59485,云南勐腊-56969。
Figure 1Distribution of 11 typical forest ecosystems in China
Table 1
表1
表1研究站点信息表
Table 1
| 森林生态系统名称 | 海拔/m | 年均温/oC | 年降水/mm | 优势种 | 土壤类型 | 参考文献 |
|---|---|---|---|---|---|---|
| 长白山温带针阔混交林(CBF) | 801.00 | 3.62 | 727.93 | 蒙古栎、色木槭、红松、水曲柳 | 暗棕壤 | 文献[25] |
| 北京暖温带落叶阔叶混交林(BJF) | 1263.00 | 4.80 | 530.38 | 油松、华北落叶松、辽东栎 | 棕壤 | 文献[26] |
| 茂县暖温带针阔混交林(MXF) | 1826.00 | 9.30 | 825.20 | 云杉、红桦 | 棕壤 | 文献[27] |
| 神农架亚热带常绿落叶阔叶混交林(SNF) | 1750.00 | 10.64 | 1456.71 | 米心水青冈、锐齿槲栎、红桦 | 黄棕壤 | 文献[28] |
| 贡嘎山亚高山暗针叶林(GGF) | 3160.00 | 4.80 | 1860.50 | 峨眉冷杉、糙皮桦 | 暗棕壤 | 文献[29] |
| 千烟洲亚热带人工常绿针叶林(QYF) | 100.00 | 17.90 | 1489.00 | 湿地松、杉木、马尾松 | 红壤 | 文献[30] |
| 会同亚热带次生常绿阔叶林(HTF) | 700.00 | 16.47 | 1234.01 | 红栲、青冈、刨花楠 | 红壤、红黄壤 | 文献[31] |
| 哀牢山亚热带湿性常绿阔叶林(ALF) | 2488.00 | 11.68 | 1728.54 | 木果石栎、多花含笑 | 黄棕壤 | 文献[32] |
| 鼎湖山亚热带季风常绿阔叶林(DHF) | 290.00 | 22.25 | 1844.36 | 木荷、厚壳桂 | 赤红壤 | 文献[33] |
| 鹤山亚热带人工常绿阔叶林(HSF) | 80.00 | 21.98 | 1663.71 | 马占相思 | 赤红壤 | 文献[34] |
| 西双版纳热带季雨林(BNF) | 750.00 | 22.65 | 1396.70 | 番龙眼、千果榄仁 | 砖红壤 | 文献[35] |
新窗口打开|下载CSV
1998—2017年11个森林生态系统的每日定位监测数据来自国家生态系统观测研究网络科技资源服务系统(http://www.cnern.org.cn/),包括大气压、气温、相对湿度、10 m高度处风速和净辐射以及用来拟合短波辐射系数的日照时数。其中,茂县暖温带针阔混交林生态站、神农架常绿落叶阔叶混交林生态站和哀牢山亚热带湿性常绿阔叶林生态站因加入CERN的时间较晚,数据的时间范围分别为2005—2017年、2008—2017年和2005—2017年。所有站点气象要素的有效数据比例为91.47%~100.00%。因异常和缺测导致的少量数据缺失,采用该站点当日的多年气象平均值插补。若数据缺失情况大于2个月,则利用CERN森林台站气象要素与周边邻近的中国气象局(China Meteorological Administration,CMA)气象台站的逐日气象观测数据的相关性进行插补。CERN森林台站与其邻近CMA台站的直线距离在4.96~136.75 km之间,平均相距62.01 km(图1)。国家气象台站的气象数据来自中国气象局国家气象信息中心(http://www.nmic.gov.cn/)。邻近国家气象台站的逐日气象数据还用于估算潜在蒸散,与基于CERN观测数据估算的潜在蒸散进行对比分析。
2.2 研究方法
2.2.1 潜在蒸散计算方法(1)Penman-Momteith方法
采用1998年世界粮农组织(FAO)推荐的修正Penman-Momteith模型[36](FAO56 PM)计算参考蒸散量,以该指标表示中国典型生态系统的潜在蒸散。该模型考虑了植被的生理特征,在全球范围内广泛应用[37],其计算公式如下:
式中:PET是潜在蒸散(mm);k是温度随饱和水汽压变化的斜率;Rnet是净辐射(MJ/m2);G是土壤热通量(MJ/m2);γ为湿度常数(kPa/℃);Cn和Cd是由参考作物类型和计算时间步长确定的常数,在FAO56 PM公式中取值分别为900和0.34;T为平均气温(℃),es为饱和水汽压(kPa),ea为实际水汽压(kPa),由es与相对湿度(%)的乘积计算得出;U2是2 m高度处风速(m/s),由10 m高处风速(U10,m/s)计算得:
在CERN台站,采用净辐射的观测数据输入公式(1)。对于CMA台站,通过FAO推荐方法进行净辐射的计算。
式中:Rns为短波净辐射;Rnl为长波净辐射;α为反照率,取值为0.23;Rs为地面入射短波净辐射;as为阴天时到达地球的太阳辐射比例,取值为0.25;bs为晴天时到达地球的太阳辐射比例,取值为0.50;n为日照时数(h);N为一天中太阳辐射的最大时间(h);Ra为到达大气层的太阳辐射(MJ/m2);σ为Stefan-Boltzmann常数(4.903×10-9 MJ/m2K4d);Tmax,K和Tmin,K分别为绝对温标的最高、最低温度(℃)。
(2)Priestley-Taylor方法
Priestley-Taylor方程(PT)是基于辐射的半经验模型[38],其计算公式如下:
式中:λ为蒸发潜热系数(MJ/kg),取值为2.45;其他变量含义同式(1)。
2.2.2 敏感性分析
采用McCuen[39]提出的敏感性系数法,量化PET计算结果对气象因子的敏感性(S),以消除气象因子量纲间的差异。计算公式为:
式中:vi为气象要素,
2.2.3 气象因子对PET的贡献
基于Roderick[40]提出的贡献率算法,将气象要素对潜在蒸散的偏导数乘以其多年变化率,可计算该气象要素对PET变化趋势的贡献。计算公式如下:
式中:t为时间;Pa为大气压;T为平均气温;RH为相对湿度;WS为风速;Rn为净辐射;δ为误差项。等式右边各项大于零意味着气象因子的变化对PET的变化具有正贡献,反之为有负贡献。
将各气象因子对PET变化趋势的贡献与PET的变化趋势做比值,可作为该气象因子对PET变化趋势的相对贡献率,计算公式如下:
式中:vi为气象要素;cvi为气象要素对PET的相对贡献率。
3 结果与分析
3.1 潜在蒸散变化趋势
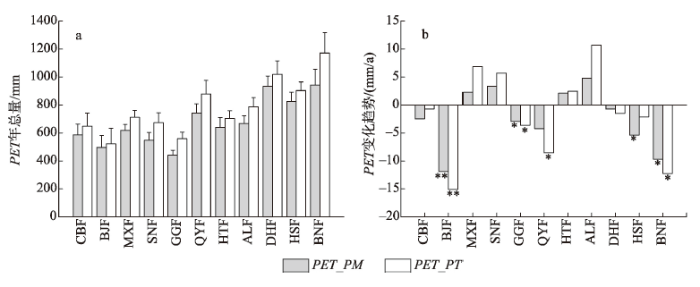
将FAO56 PM公式计算的PET命名为PET_PM;将PT公式计算的PET命名为PET_PT。1998—2017年,11个典型森林生态系统的PET多年平均值和变化趋势如图2所示。PET_PM年总量为440.49~942.52 mm,贡嘎山亚高山暗针叶林最低,西双版纳热带季雨林最高。其中北京暖温带落叶阔叶混交林、贡嘎山亚高山暗针叶林、鹤山亚热带人工常绿阔叶林和西双版纳热带季雨林的下降趋势达到统计显著水平,速率分别为-11.89 mm/a、-2.93 mm/a、-5.40 mm/a和-9.69 mm/a。图2
 新窗口打开|下载原图ZIP|生成PPT
图2CERN森林站点潜在蒸散年总量的多年平均值(a)及变化趋势(b)
注:*表示回归系数通过0.05显著性水平的F检验;**表示回归系数通过0.01显著性水平的F检验。
Figure 2Multi-year mean (a) and trends (b) of annual potential evapotranspiration at the forest sites of the Chinese Ecosystem Research Network (CERN)
PET_PT的年总量较PET_PM偏高5.28%~26.93%。各个森林PET_PT与PET_PM变化趋势的方向一致,变化趋势的大小存在不同程度的差异。在北京暖温带落叶阔叶混交林、贡嘎山亚高山暗针叶林、会同亚热带次生常绿阔叶林和西双版纳热带季雨林,二者PET变化趋势的差异为26.98%、24.93%、16.72%和26.69%,在其他森林二者的平均偏差为67.03%。与PET_PM结果类似,北京暖温带落叶阔叶混交林、贡嘎山亚高山暗针叶林和西双版纳热带季雨林的PET_PT具有显著下降趋势。此外,千烟洲亚热带人工常绿针叶林和哀牢山亚热带湿性常绿阔叶林PET_PT变化趋势也达到显著水平。
利用FAO56 PM和PT两种方法计算的不同季节PET变化趋势大小存在一定差异,但二者关于不同季节对森林PET年总量变化趋势的相对贡献较为一致(表2)。北京暖温带落叶阔叶混交林全年PET下降主要源自夏季和秋季的PET下降,两种方法计算出的夏季PET下降速率分别为5.74和7.51 mm/a,秋季PET下降速率分别为3.71和4.28 mm/a,夏秋两个季节对全年PET下降的总相对贡献可达79.47%(PET_PM)和78.06%(PET_PT)。贡嘎山亚高山暗针叶林夏季PET的显著下降主导了全年PET的下降,相对贡献为64.63%(PET_PM)和61.19%(PET_PT)。西双版纳热带季雨林春季和夏季PET显著下降,对年总量下降趋势的贡献达62.77%(PET_PM)和62.49%(PET_PT)。哀牢山亚热带湿性常绿阔叶林PET_PT的上升主要源自春季和秋季PET的显著增加,贡献为68.66%。
Table 2
表2
表2CERN森林站点不同季节潜在蒸散的变化趋势
Table 2
| 春季 | 夏季 | 秋季 | 冬季 | ||||||||
|---|---|---|---|---|---|---|---|---|---|---|---|
| PET_PM | PET_PT | PET_PM | PET_PT | PET_PM | PET_PT | PET_PM | PET_PT | ||||
| CBF | -1.21 | -0.60 | -0.65 | -0.76 | 0.06 | 0.90 | -0.67** | -0.25** | |||
| BJF | -1.65 | -2.70* | -5.74** | -7.51** | -3.71** | -4.28** | -0.79** | -0.61** | |||
| MXF | 0.44 | 1.76 | 1.71 | 3.84 | -0.47 | 0.42 | 0.62 | 0.84 | |||
| SNF | 0.03 | 0.46 | 2.15 | 3.25 | -0.31 | -0.05 | 1.49 | 2.09 | |||
| GGF | 0.03 | 0.06 | -1.89* | -2.24* | -0.77 | -1.03 | -0.30 | -0.45 | |||
| QYF | 0.01 | -1.36 | -1.92 | -2.69 | -2.28* | -3.60** | -0.04 | -0.90 | |||
| HTF | -0.76 | -0.72 | 2.43 | 2.81 | -0.16 | -0.04 | 0.61 | 0.44 | |||
| ALF | 2.10 | 4.26* | 0.29 | 0.88 | 1.97 | 3.09* | 0.40 | 2.48* | |||
| DHF | -0.54 | -0.74 | 0.17 | -0.21 | -0.65 | -0.73 | 0.29 | 0.18 | |||
| HSF | -2.35** | -2.33* | -1.63 | -0.85 | -1.06 | 0.42 | -0.36 | 0.62 | |||
| BNF | -2.87* | -3.57* | -3.21* | -4.10* | -2.27 | -2.91 | -1.34 | -1.70 | |||
新窗口打开|下载CSV
3.2 潜在蒸散变化成因分析
利用公式(8)-(9)量化了FAO56 PM方法计算的潜在蒸散对大气压、平均气温、相对湿度、风速和净辐射这5个气象要素的敏感性,以及各气象要素对PET的贡献。由表3可知,总体上,各个森林生态系统的PET_PM对净辐射的敏感性(平均为0.77)高于相对湿度(-0.30)、平均气温(0.29)、大气压(-0.24)和风速(0.07)。Table 3
表3
表3CERN森林站点潜在蒸散对气象要素的敏感性
Table 3
| 大气压 | 平均气温 | 相对湿度 | 风速 | 净辐射 | |
|---|---|---|---|---|---|
| CBF | -0.27 | 0.11 | -0.04 | 0.10 | 0.60 |
| BJF | -0.23 | 0.15 | -0.03 | 0.15 | 0.62 |
| MXF | -0.25 | 0.28 | -0.82 | 0.07 | 0.72 |
| SNF | -0.34 | 0.25 | -0.37 | 0.02 | 0.85 |
| GGF | -0.41 | 0.13 | -0.02 | -0.01 | 0.91 |
| QYF | -0.25 | 0.36 | -0.04 | 0.04 | 0.83 |
| HTF | -0.18 | 0.38 | -0.06 | 0.10 | 0.71 |
| ALF | -0.24 | 0.33 | -1.11 | 0.04 | 0.75 |
| DHF | -0.14 | 0.43 | -0.72 | 0.11 | 0.76 |
| HSF | -0.14 | 0.44 | -0.07 | 0.11 | 0.76 |
| BNF | -0.26 | 0.34 | -0.02 | 0.01 | 0.96 |
| 平均 | -0.24 | 0.29 | -0.30 | 0.07 | 0.77 |
新窗口打开|下载CSV
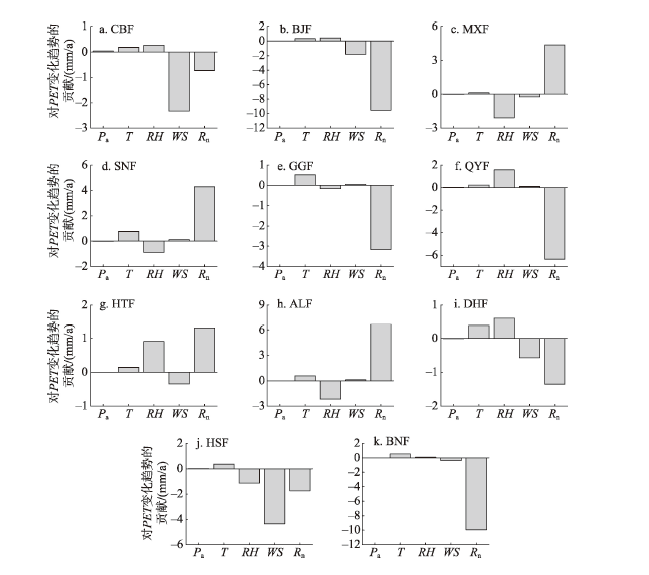
不同森林生态系统间各气象因子对PET_PM的贡献大小存在差异(图3)。对于PET年总量显著降低的鹤山亚热带人工常绿阔叶林,风速是导致潜在蒸散下降的主要气象因子,相对贡献率为 80.44%。同时,风速也是引起长白山温带针阔混交林PET下降的主导因子,相对贡献率为94.81%。这两个森林生态系统其风速在1998—2017年间呈现出显著下降趋势(分别为每年-0.05 m/s和-0.08 m/s,p<0.01),是引起森林生态系统PET下降的主要原因。
图3
 新窗口打开|下载原图ZIP|生成PPT
图3不同气象要素对CERN森林站点潜在蒸散年总量变化趋势的贡献
注:Pa为大气压,T为平均气温,RH为相对湿度,WS为风速,Rn为净辐射。
Figure 3Contribution of meteorological factors to the trends of potential evapotranspiration at the forest sites of the Chinese Ecosystem Research Network (CERN)
对于PET年总量显著降低的北京暖温带落叶阔叶混交林、贡嘎山亚高山暗针叶林和西双版纳热带季雨林,净辐射是引起PET下降的主导因子,相对贡献率高达80.10%、107.96%和102.61%。同时,净辐射也是茂县暖温带针阔混交林、神农架亚热带常绿落叶阔叶林、千烟洲亚热带人工常绿针叶林、会同亚热带次生常绿阔叶林、哀牢山亚热带湿性常绿阔叶林和鼎湖山亚热带季风常绿阔叶林PET变化的主导因子,相对贡献率在61.29%~189.91%之间。以上森林生态系统的PET均呈现出对净辐射的高敏感性(0.62~0.96)。其中,北京暖温带落叶阔叶混交林、贡嘎山亚高山暗针叶林、千烟洲亚热带人工常绿针叶林和西双版纳热带季雨林的净辐射在研究时段内显著下降(-0.14~-0.09 MJ/m2/a,p<0.05),哀牢山亚热带湿性常绿阔叶林的净辐射在研究时段内显著上升(0.09 MJ/m2/a,p<0.05),与PET对该气象要素的高敏感性共同决定了其在PET变化中的主导地位。尽管北京暖温带落叶阔叶混交林、鼎湖山亚热带季风常绿阔叶林和西双版纳热带季雨林的风速在20年间也呈现出显著下降的趋势(-0.02~-0.01m/s/a,p<0.05),但由于这3个森林生态系统的PET对该气象要素的敏感性较小(0.01~0.15),导致其对PET下降的相对贡献低于净辐射。
3.3 与基于国家气象站观测的PET的比较
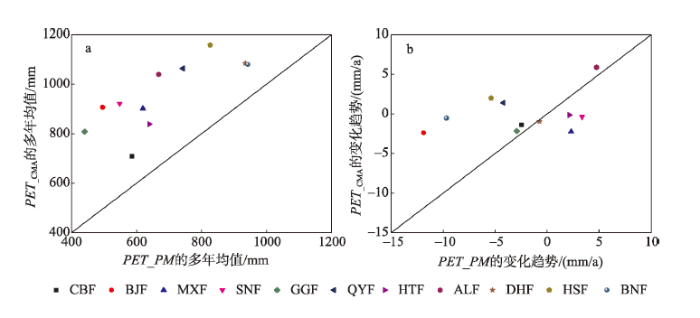
利用FAO56 PM方法,对比分析了基于CERN台站观测数据估算的PET_PM与基于气象站观测数据估算的PET(命名为PET_CMA)在年总量和变化趋势上的差异(图4)。与PET_PM相比,PET_CMA多年平均值偏高125.48~382.01 mm,平均偏差为277.62 mm。对于二者在PET变化趋势上的差异,长白山温带针阔混交林、北京暖温带落叶阔叶混交林、千烟洲亚热带人工常绿针叶林、鹤山亚热带人工常绿阔叶林和西双版纳热带季雨林的PET_CMA变化趋势较PET_PM变化趋势偏高1.49~9.43 mm/a,平均偏差为6.37 mm/a,其余6个森林生态系统的PET_CMA变化趋势偏低-5.60~-0.12 mm/a,平均偏差为-1.88 mm/a。图4
 新窗口打开|下载原图ZIP|生成PPT
图4PET_PM与PET_CMA在多年平均值(a)及变化趋势(b)上的比较
Figure 4Comparison of PET_PM and PET_CMA in multi-year mean (a) and trends (b)
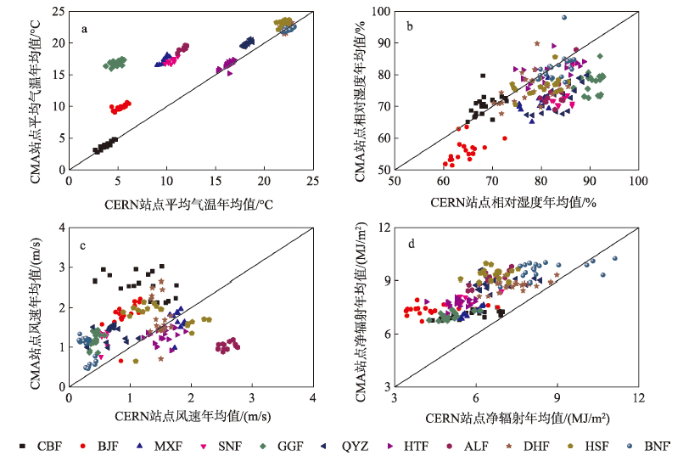
与CERN森林台站相比,CMA站点往往具有较高的气温、风速和净辐射,以及较低的相对湿度(图5)。其中,净辐射平均偏高2.04 MJ/m2,平均气温偏高3.76oC,相对湿度偏低5.74%,风速偏高0.30 m/s。不同站点PET_CMA比PET_PM高的主导因素不完全相同。长白山温带针阔混交林、会同亚热带次生常绿阔叶林、鼎湖山亚热带季风常绿阔叶林和鹤山亚热带人工常绿阔叶林的PET_CMA偏高主要是由于净辐射偏高(1.32~2.74 MJ/m2)。而对于北京暖温带落叶阔叶混交林、茂县暖温带针阔混交林、神农架亚热带常绿落叶阔叶混交林、贡嘎山亚高山暗针叶林、千烟洲亚热带人工常绿针叶林和哀牢山亚热带湿性常绿阔叶林,除了净辐射偏高(1.36~2.90 MJ/m2)外,平均温度偏高(4.53~11.99 oC)和相对湿度偏低(-12.20%~-7.42%)也会引起PET_CMA偏高。西双版纳热带季雨林的PET_CMA偏高主要源自较大的风速(偏差为0.66 m/s)和较低的相对湿度(偏差为-1.03%)。
图5
 新窗口打开|下载原图ZIP|生成PPT
图5CERN森林站点与邻近CMA站点平均气温(a)、相对湿度(b)、风速(c)和净辐射(d)年均值的比较
Figure 5Comparison of annual mean of mean temperature (a), relative humidity (b), wind speed (c), and net radiation (d) between the forest sites of the Chinese Ecosystem Research Network (CERN) and nearby China Meteorological Administration (CMA) sites
进一步比较了CERN台站与邻近气象站气象因子变化趋势的异同(表4),分析了PET_CMA与PET_PM变化趋势差异的原因。结果表明,对于5个PET_CMA变化趋势高于PET_PM的站点,长白山温带针阔混交林的邻近气象台站观测的风速变化趋势比CERN台站偏高0.04 m/s/a,北京暖温带落叶阔叶混交林邻近台站的净辐射变化趋势比CERN台站偏高0.14 MJ/m2/a,千烟洲亚热带人工常绿针叶林、鹤山亚热带人工常绿阔叶林和西双版纳热带季雨林的风速和净辐射变化趋势均偏高(分别为0.01~0.08 m/s/a和0.07~0.08 MJ/m2/a),这些站点是导致PET_CMA的变化速率高于PET_PM的原因。而对于其余6个PET_CMA变化速率低于PET_PM的站点,邻近气象站观测的相对湿度变化趋势偏高(0.05%/a~0.50%/a),同时,茂县暖温带针阔混交林、神农架亚热带常绿落叶阔叶林、会同亚热带次生常绿阔叶林和哀牢山亚热带湿性常绿阔叶林的净辐射变化趋势偏低(-0.05~-0.01 MJ/m2/a),导致这6个森林生态系统PET_CMA的变化趋势低于PET_PM。
Table 4
表4
表4气象要素的变化趋势
Table 4
| 大气压/(kPa/a) | 平均气温/(oC/a) | 相对湿度/(%/a) | 风速/(m/s/a) | 净辐射/(MJ/m2/a) | ||||||||||
|---|---|---|---|---|---|---|---|---|---|---|---|---|---|---|
| CERN | CMA | CERN | CMA | CERN | CMA | CERN | CMA | CERN | CMA | |||||
| CBF | -0.03** | 0.01** | 0.01 | 0.03 | -0.07 | 0.00 | -0.05** | 0.00 | -0.01 | -0.02* | ||||
| BJF | 0.00 | 0.00 | 0.02 | 0.03 | -0.13 | -0.12 | -0.02** | -0.04** | -0.14** | 0.00 | ||||
| MXF | 0.00 | 0.00 | 0.01 | 0.06 | 0.33* | 0.50 | -0.01 | -0.06* | 0.06 | 0.04 | ||||
| SNF | 0.01* | -0.04 | 0.06 | 0.01 | 0.38* | 0.43 | 0.01 | 0.03 | 0.05 | 0.04 | ||||
| GGF | 0.00 | 0.00 | 0.04* | 0.00 | 0.12 | 0.23 | 0.00 | -0.01* | -0.04* | 0.00 | ||||
| QYF | -0.01* | -0.01* | 0.02 | 0.02 | -0.37* | 0.17 | 0.00 | 0.01 | -0.07* | 0.00 | ||||
| HTF | 0.00 | 0.00 | 0.01 | 0.02 | -0.12 | -0.07 | -0.01 | -0.01 | 0.02 | -0.01 | ||||
| ALF | 0.00 | 0.01 | 0.03 | 0.05* | 0.24 | 0.49 | 0.01 | 0.01* | 0.09* | 0.04 | ||||
| DHF | 0.01* | -0.02** | 0.02 | -0.06** | -0.07 | 0.43* | -0.01* | 0.03 | -0.01 | 0.01 | ||||
| HSF | -0.01* | -0.02** | 0.02 | -0.03 | 0.12 | 0.13 | -0.08** | 0.00 | -0.02 | 0.03** | ||||
| BNF | 0.00 | 0.00 | 0.04* | 0.00 | -0.05 | 0.02 | -0.01** | 0.04** | -0.09* | -0.01 | ||||
新窗口打开|下载CSV
4 讨论
在气候变暖背景下,1998—2017年大部分森林生态系统PET呈现下降趋势,气温上升对森林PET变化的正贡献较为有限,净辐射和风速相比其他气候因子对森林PET变化的贡献更大。关于PET变化的成因,总体上与以往基于气象台站数据的大尺度研究结果[12,13,41]类似。结合中国陆地生态系统通量观测研究网络(ChinaFLUX)涡度相关系统测定的潜热通量数据(http://www.cnern.org.cn/data/initDRsearch?classcode=SYC_A02),计算得到2003—2010年长白山温带针阔混交林、千烟洲亚热带人工常绿针叶林、鼎湖山亚热带季风常绿阔叶林和西双版纳热带季雨林4个森林生态系统的实际蒸散(ET)与PET的比值(0.61~0.85),该比例在已有研究的范围内(0.43~0.91)[21,42,43],其中ET/PET_PM平均为0.78,略高于ET/PET_PT(0.69)。考虑到FAO56 PM公式中参考作物高度可能影响PET估算结果,采用美国土木工程师协会环境与水资源分会(ASCE-EWRI)提出的ASCE标准PM公式[44],以完全覆盖的苜蓿(高型参考作物)为参考下垫面,将式(1)中的常数Cn和Cd分别取值为1600和0.38(日尺度),计算了下垫面参考作物为苜蓿时各森林生态系统PET(PET_ASCE)的大小及变化趋势。结果表明,PET_ASCE在数值上略高于PET_PM,偏差为11.35~142.81 mm,但各森林生态系统PET_ASCE变化趋势与PET_PM的方向一致。PET_ASCE对各气象要素的平均敏感性排序与PET_PM一致,为净辐射(0.69)>相对湿度(-0.46)>平均气温(0.30)>大气压(-0.17)>风速(0.14)。同时,各森林生态系统的气象要素对PET_ASCE的贡献情况与PET_PM相似(表5)。这说明改变参考作物的高度后,主要影响PET的大小,不会造成PET变化趋势及气候因子贡献结果的改变。
Table 5
表5
表5不同气象要素对PET_ASCE变化趋势的贡献
Table 5
| 大气压 | 平均气温 | 相对湿度 | 风速 | 净辐射 | |
|---|---|---|---|---|---|
| CBF | 0.03 | 0.22 | 0.48 | -5.32 | -0.71 |
| BJF | 0.00 | 0.40 | 0.74 | -3.65 | -9.41 |
| MXF | -0.01 | 0.15 | -3.65 | -0.61 | 4.30 |
| SNF | -0.02 | 0.80 | -1.59 | 0.39 | 4.27 |
| GGF | 0.00 | 0.55 | -0.29 | -0.02 | -3.14 |
| QYF | 0.02 | 0.25 | 2.78 | 0.25 | -6.31 |
| HTF | 0.00 | 0.18 | 1.32 | -0.79 | 1.37 |
| ALF | 0.00 | 0.67 | -3.74 | 0.44 | 6.56 |
| DHF | 0.00 | 0.46 | 1.08 | -1.23 | -1.34 |
| HSF | 0.00 | 0.42 | -2.00 | -9.38 | -1.72 |
| BNF | 0.00 | 0.60 | 0.17 | -1.05 | -9.92 |
新窗口打开|下载CSV
由于气象观测场周边环境的差异,国家气象台站测定的气温、太阳辐射和风速总体上高于自然森林,并且在趋势上也存在一定程度的差异,会造成对森林PET大小和趋势估计的偏差。与CERN森林生态系统定位台站相比,邻近气象观测台站主要位于城市及周边[23]。多种因素引发的“城市热岛效应”使气象台站测定的气温和太阳辐射均高于野外[45]。并且,CERN森林生态系统台站与邻近气象站在海拔高度上也存在较大差异,除千烟洲亚热带人工常绿针叶林外,其余10个CERN森林生态系统台站的海拔均明显高于邻近气象站(偏高46.30~2532.40 m),这也是邻近气象站气温观测值偏高以及PET_CMA数值偏高的原因之一。同时,森林蒸腾作用增加了大气中的水汽含量,而绿植较少的城市及城郊的相对湿度则低于森林[46]。林冠层对风速的降低作用也使森林生态系统的风速小于城市及周边[47]。
此外,FAO56 PM模型中采用as和bs的默认值(式(5))会导致短波辐射计算的误差。辐射系数as和bs体现了大气透明度及云量这2个关键要素[48]对地表辐射的影响。与观测值相比,由日照时数计算的短波总辐射的年均值和变化趋势分别存在-1.22~1.89 MJ/m2和-0.03~0.13 MJ/m2/a的偏差(表6),进而造成对PET估算结果的不确定性。而采用实测短波辐射数据拟合出的as和bs值,短波总辐射计算值的偏差可减小30.61%~82.04%。
Table 6
表6
表6CERN森林台站辐射系数的拟合值及其对短波辐射计算结果的影响
Table 6
| 年均值/(MJ/m2) | 变化趋势/(MJ/m2/a) | 拟合的辐射系数 | |||||||||
|---|---|---|---|---|---|---|---|---|---|---|---|
| 观测值 | 原始值 | 反推值 | 观测值 | 原始值 | 反推值 | as | bs | R2 | |||
| CBF | 13.42 | 12.46 | 13.62 | -0.04 | -0.02 | -0.02 | 0.28 | 0.53 | 0.60 | ||
| BJF | 10.15 | 11.60 | 8.96 | -0.16 | -0.02 | -0.02 | 0.15 | 0.52 | 0.49 | ||
| MXF | 12.04 | 12.70 | 11.92 | -0.02 | 0.01 | 0.01 | 0.18 | 0.64 | 0.86 | ||
| SNF | 12.61 | 12.76 | 12.51 | 0.01 | -0.02 | -0.02 | 0.20 | 0.63 | 0.61 | ||
| GGF | 9.06 | 10.95 | 8.50 | 0.08 | 0.07 | 0.10 | 0.13 | 0.72 | 0.69 | ||
| QYF | 12.10 | 13.94 | 11.44 | -0.03 | -0.04 | -0.04 | 0.14 | 0.59 | 0.76 | ||
| HTF | 10.79 | 11.51 | 10.51 | -0.03 | 0.03 | 0.03 | 0.20 | 0.59 | 0.63 | ||
| ALF | 14.29 | 13.95 | 14.21 | 0.04 | 0.10 | 0.12 | 0.23 | 0.58 | 0.83 | ||
| DHF | 13.15 | 12.78 | 12.92 | -0.02 | 0.04 | 0.05 | 0.23 | 0.59 | 0.66 | ||
| HSF | 12.54 | 11.32 | 12.32 | -0.03 | 0.08 | 0.08 | 0.28 | 0.50 | 0.47 | ||
| BNF | 15.41 | 15.26 | 15.46 | -0.01 | 0.01 | 0.01 | 0.26 | 0.49 | 0.68 | ||
新窗口打开|下载CSV
根据第八次全国森林资源清查结果,中国森林覆盖率已达21.61%[49]。如果仅采用气象台站的观测数据来研究全国或区域PET的变化规律,可能存在对森林生态系统PET大小和变化趋势上估计的不确定性。未来需加强全国范围内自然生态系统长期定位监测台站气象数据的共享,并拓展自然生态系统中气象观测站点的密度和气象观测数据时间序列的长度,从而更准确地估计全国自然生态系统PET的大小及变化。
5 结论
本文基于1998—2017年中国生态系统研究网络11个森林生态系统定位研究站的逐日气象观测资料,分析了中国典型森林生态系统PET的变化趋势及成因,并评价了基于国家气象台站观测数据计算的PET结果对于森林PET的偏差,得出以下主要结论:(1)1998—2017年,中国大部分森林生态系统的PET呈下降趋势,FAO56 Penman-Monteith公式和Priestley-Taylor公式估算的PET变化趋势一致。净辐射作为高敏感因子,其变化主导了9个森林生态系统的PET变化。风速的显著下降趋势主导了长白山温带针阔混交林和鹤山亚热带人工常绿阔叶林的PET变化。
(2)与基于CERN典型森林生态系统观测数据计算的PET结果相比,基于中国气象局地面气象站观测数据计算的PET年总量偏大,这主要源自邻近气象台站具有较高的气温、风速、日照时数和较低的相对湿度。北部和东部森林邻近气象站估算的PET在变化趋势上偏高,主要由于其风速和净辐射变化趋势偏高;其他区域邻近气象站估算的PET在趋势上偏低,主要源自相对湿度变化趋势偏高和净辐射变化趋势偏低。
致谢:
感谢中国生态系统研究网络(CERN)长白山站、北京森林站、茂县站、神农架站、贡嘎山站、千烟洲站、会同站、哀牢山站、鼎湖山站、鹤山站、西双版纳站及数据中心的相关工作人员提供数据支持。感谢中国气象局(CMA)气象观测台站和国家气象信息中心(NMIC)提供数据支持。感谢葛蓉博士和朱晓波博士在本文修改过程中提供的帮助。参考文献 原文顺序
文献年度倒序
文中引用次数倒序
被引期刊影响因子
[本文引用: 1]
[本文引用: 1]
[J].
DOI:10.1126/science.1078972URLPMID:12434040 [本文引用: 1]
[M].
[本文引用: 1]
[J].
[本文引用: 1]
[J].
[本文引用: 1]
[M].
[本文引用: 1]
[M].
[本文引用: 1]
[J].
[本文引用: 1]
[J].
[本文引用: 1]
[J].
DOI:10.1126/science.1075390URLPMID:12434057 [本文引用: 1]

Changes in the global water cycle can cause major environmental and socioeconomic impacts. As the average global temperature increases, it is generally expected that the air will become drier and that evaporation from terrestrial water bodies will increase. Paradoxically, terrestrial observations over the past 50 years show the reverse. Here, we show that the decrease in evaporation is consistent with what one would expect from the observed large and widespread decreases in sunlight resulting from increasing cloud coverage and aerosol concentration.
[J].
[本文引用: 1]
[J].
[本文引用: 1]
[J].
[本文引用: 1]
[J].
[本文引用: 3]
[J].
[本文引用: 2]
[J].
[本文引用: 1]
[J].
[本文引用: 1]
[J].
[本文引用: 1]
[J].
DOI:10.1016/j.jhydrol.2012.03.014URL [本文引用: 2]
[J].
[本文引用: 1]
[J].
[本文引用: 1]
[J].
[本文引用: 1]
[J].
URLPMID:24163575 [本文引用: 2]
The relationship between air-water interfacial area and capillary pressure under higher water-content conditions is investigated for four natural porous media. The results show that the magnitude of the air-water interfacial area increases with increasing capillary pressure, consistent with the decrease in water saturation. The maximum observed air-water interfacial areas are dependent upon the magnitude of residual water saturation, which itself is condition dependent. The more well-sorted porous medium exhibited a greater rate of change of air-water interfacial area with capillary pressure than the more poorly-sorted porous media. The observed relationship between air-water interfacial area and capillary pressure was quantified by coupling an empirical equation describing the air-water interfacial area vs. water saturation relationship with the van Genuchten equation relating water saturation and capillary pressure. This equation produced reasonable simulations of the measured data.
[J].
URL [本文引用: 3]
Global climate change has direct impacts on watershed hydrology through altering evapotranspiration (ET) processes at multiple scales. There are many methods to estimate forest ET with models, but the most practical and the most popular one is the potential ET (PET) based method. However; the choice of PET methods for AET estimation remains challenging. This study explored ways to identify appropriate PET models for two small forested watersheds, one dominated by conifer plantation and one dominated by native naturally regenerated deciduous hardwoods, by using long-term hydrometeorological data collected at the Coweeta Hydrologic Laboratory in the humid Appalachians in the southeastern U.S. Our specific objectives were to: (I) contrast three common PET models (FAO-56 grass reference ET Hamon PET, and Priestley-Taylor PET) and compare these PET estimates with measured AET at monthly and annual temporal scales, and (2) derive correction factors for the FAO-56 grass reference ET and Hamon PET models at the monthly scale using the Priestley-Taylor equation as the,standard method for estimating forest PET We found that different PET models gave significantly different PET estimates. The Priestley-Taylor equation gave the most reasonable estimates of forest PET for both watersheds. We conclude that the uncorrected Hamon and FAO PET methods would cause large underestimates of forest PET Annual PET rates of the conifer watershed were higher than those of the native deciduous watershed due to the lower albedo (thus higher net radiation) in the former compared to the latter. Monthly correction factors provided useful tools for forest PET estimation in those areas lacking climatic data (i.e., radiation, humidity, and wind speed).
[J].
[本文引用: 1]
[J].
[本文引用: 2]
[J].
[本文引用: 2]
[J].
[本文引用: 1]
[J].
[本文引用: 1]
[J].
[本文引用: 1]
[J].
[本文引用: 1]
[J].
[本文引用: 1]
[J].
[本文引用: 1]
[J].
[本文引用: 1]
[J].
[本文引用: 1]
[本文引用: 1]
[本文引用: 1]
[J].
[本文引用: 1]
[J].
[本文引用: 1]
[J].
[本文引用: 1]
[J].
[本文引用: 1]
[本文引用: 1]
[本文引用: 1]
[本文引用: 1]
[本文引用: 1]
[本文引用: 1]
[本文引用: 1]
[本文引用: 1]
[本文引用: 1]
[本文引用: 1]
[本文引用: 1]
[本文引用: 1]
[J].
[本文引用: 1]
[J].
[本文引用: 1]
[J].
[本文引用: 1]
[J].
[本文引用: 1]
[J].
URLPMID:31598022 [本文引用: 1]
MMS3 spacecraft passed the vicinity of the electron diffusion region of magnetotail reconnection on 3 July 2017, observing discrepancies between perpendicular electron bulk velocities and E --> x B --> drift, and agyrotropic electron crescent distributions. Analyzing linear wave dispersions, Burch et al. (2019, https://doi.org/10.1029/2019GL082471) showed the electron crescent generates high-frequency waves. We investigate harmonics of upper-hybrid (UH) waves using both observation and particle-in-cell (PIC) simulation, and the generation of electromagnetic radiation from PIC simulation. Harmonics of UH are linearly polarized and propagate along the perpendicular direction to the ambient magnetic field. Compared with two-dimensional PIC simulation and nonlinear kinetic theory, we show that the nonlinear beam-plasma interaction between the agyrotropic electrons and the core electrons generates harmonics of UH. Moreover, PIC simulation shows that agyrotropic electron beam can lead to electromagnetic (EM) radiation at the plasma frequency and harmonics.
[J].
[本文引用: 1]
[J].
[本文引用: 1]
[J].
URLPMID:29682001 [本文引用: 1]
Africa's vast landmass harbors a variety of physical processes that affect the environment and the water cycle. This focus issue on 'African Environmental Processes and Water-Cycle Dynamics' contains eight articles that address these phenomena from different but complementary perspectives. Fires used for agricultural and related purposes play a major role in land-cover change, surface albedo modifications, and smoke emission; all of which affect the environment and the water cycle in different ways. However, emissions of aerosols and trace gases are not restricted to fires, but also emanate from other natural and human activities. The African water cycle undergoes significant perturbations that are attributable to several factors, including the aforesaid environmental processes. These changes in the water cycle have produced severe drought and flooding events in recent decades that affect societal wellbeing across sub-Saharan Africa. The combined effects of the environmental processes and water-cycle dynamics affect and are affected by climate variability and can be propagated beyond the continent. Future studies should utilize the wealth of observations and modeling tools that are constantly improving to clearly elucidate the interrelationships between all of these phenomena for the benefit of society.
[R].
[本文引用: 1]
[J].
[本文引用: 1]
[J].
[本文引用: 1]
[J].
[本文引用: 1]
[J].
[本文引用: 1]
[J].
[本文引用: 1]
[J].
[本文引用: 1]
[J].
[本文引用: 1]
[J].
[本文引用: 1]
[J].
[本文引用: 1]
[J].
[本文引用: 1]
