HTML
--> --> -->The aim of this paper is twofold: Firstly, we review the data characteristics and usage in the ECMWF system for the microwave instruments from FY-3B, -C and -D, both the passive microwave (MW) radiometers [Microwave Humidity Sounder (MWHS) and Microwave Radiation Imager (MWRI)] and the radio occultation receiver [Global Navigation Satellite System (GNSS) Radio Occultation Sounder (GNOS)]. These instruments are, or have been, assimilated in the operational ECMWF numerical weather prediction (NWP) system. We intercompare instrument performance, and report on new features. Secondly, we present, for the first time, an evaluation and analysis of the joint forecast benefit achieved from the combined assimilation of all FY-3 instruments used operationally at ECMWF. While impact from individual instruments has been reported before (e.g., Chen et al., 2015; Lawrence et al., 2018), this overall impact of FY-3 cannot be gauged from the individual assessments. The FY-3 satellites also carry an infrared (IR) payload, but the hyperspectral IR capability has only so far been available on FY-3D and is not considered in this paper. Although initial studies such as Lu et al. (2011a, b) focused on the MW Temperature Sounder, MWTS-1, more success has been found using observations from the humidity sensitive instruments, in particular MWHS-1 and MWHS-2 (e.g., Chen et al., 2015; Lawrence et al., 2018). This is not because temperature sounding observations intrinsically have less value, but because the MWTS instruments have been less fortunate in their operational mission, whereas there is now a long and robust data record from the humidity sensors and radio occultation instruments on FY-3 satellites.
In NWP, the initial state is generally estimated using variational data assimilation techniques such as 4D-Var (Rabier et al., 2000). These methods enable observations to be directly assimilated in a form close to the actual observed variable, even though it has a weakly nonlinear relationship to the state variables of the model analysis. In the case of MWHS-1, MWHS-2 and MWRI this is microwave radiances, whereas in the case of GNOS this is bending angles. The NWP system provides what is known as a background to the new analysis state, which is generally a short-range forecast (up to 12 hours) from the previous analysis state. It is most instructive to think of this as the best initial estimate of the analysis state at the new time based on all past observations, carried forward in time with a state-of-the-art atmospheric model. This state is then updated by new observations in a way that is mathematically optimal if their errors are accurately described and provided to the data assimilation system. Therefore, a critical component of observation and model evaluation is comparison of the observations to observations simulated from the background state, and then establishing if the differences are consistent with expected errors. In the case of FY-3 data, similar comparisons can be made for other satellites in similar orbits, allowing a cross-validation of the instruments without the need to collocate them (e.g., Lawrence et al., 2017). The statistics can also be used to identify and even mitigate instrument anomalies, such as reflector emission signatures in MW imager data (e.g., Bell et al., 2008; Geer et al., 2010), or to characterize sub-optimalities in nonlinearity corrections or pass-band characteristics (Lu et al., 2011b). To aid these analyses, reference observations have been used to characterize how well NWP can be used as a transfer medium for calibration standards (Carminati et al., 2019a; Newman et al., 2020).
In this paper we initially present an assessment of these “observation-minus-background” differences (O-B, or background departures), to characterize the performance of the instruments in comparison to other similar sensors. This is followed by an evaluation of the overall forecast impact of the observations from the FY-3 instruments assimilated in the ECMWF system, before summarizing our results and conclusions in the last section.
| Satellite | Launch | Instrument | Main impacts | Period of use |
| FY-3B (afternoon satellite, present ECT of 1600) | 4 Nov 2010 | MWHS-1 | Mid- and upper-tropospheric humidity, dynamics | 24 Sep 2014 to 1 Jun 2020a |
| FY-3C (morning satellite, present ECT of 0900) | 23 Sep 2013 | MWHS-2 | Mid- and upper-tropospheric humidity, clouds, dynamics | Since 4 Apr 2016 |
| GNOS | Upper-tropospheric/lower- stratospheric temperature/dynamics | 6 Mar 2018 to 17 May 2020b | ||
| FY-3D (afternoon satellite, present ECT of 1400) | 14 Nov 2017 | MWHS-2 | See above | Since 2 Dec 2019 |
| MWRI | Total column water vapor, clouds, dynamics | Since 13 May 2020 | ||
| GNOS | See above | Activation planned 2021 | ||
| aAssimilation stopped as data provision from FY-3B satellite was discontinued. bAssimilation stopped as instrument was switched off due to power issues. | ||||
Table1. FY-3 instruments assimilated in the operational ECMWF system.
Use of the FY-3 observations has been developed alongside some key research strands in the assimilation of satellite data for NWP: Firstly, they contribute to an increasing availability and impact of observations sensitive to humidity and clouds, also aided through all-sky assimilation of these observations (e.g., Geer et al., 2017). All-sky assimilation means using the data in clear, cloudy, and rainy conditions, and allowing feedback on the development of model clouds during the assimilation. This requires an ef?cient, scattering-capable radiative transfer model (e.g., Bauer et al., 2006). All-sky assimilation also provides important wind information, through the ability of 4D-Var to extract information on the dynamics supporting humidity or cloud evolutions. MWHS-2 as well as MWRI are used through all-sky assimilation. Secondly, GNOS observations from FY-3C and FY-3D make a significant contribution to the constellation of radio occultation instruments. This was particularly important prior to the launch of the Constellation Observing System for Meteorology, Ionosphere and Climate (COSMIC)-2, as observation numbers available from the COSMIC-1 constellation had become very low. In addition to reducing random analysis uncertainty, these observations provide important anchors for the bias correction of radiances from passive instruments, as they are self-calibrating and can be assimilated without bias correction.
In the following, we give an overall evaluation of the data characteristics of the FY-3 instruments used, in the context of the wider observing system assimilated operationally at ECMWF. This is based on comparing observations to short-range forecast equivalents, calculated using an appropriate observation operator as outlined below for each instrument. The short-range forecasts used in this analysis are taken from an assimilation experiment with active assimilation of the FY-3 observations considered here. Details on the experiment configuration are given in section 3.1.
2
2.1. MWHS-1 and MWHS-2
The microwave humidity sounders in the FY-3 series, MWHS-1 and MWHS-2, are cross-track scanning radiometers with a swath width of 2700 km. MWHS-1 has a similar complement of channels to the humidity sensor used on the MetOp and Polar Orbiting Environmental Satellite series, the Advanced Microwave Sounding Unit (AMSU)-B or the Microwave Humidity Sounder (MHS), with three sounding channels around the 183.31 GHz water vapor absorption line. In contrast to AMSU-B and MHS, MWHS-1 does not feature an 89-GHz window channel, but instead has two 150-GHz window channels with different polarizations. MWHS-2 features five channels for humidity sounding and additionally holds the first suite of channels exploiting the 118-GHz oxygen absorption line for temperature sounding ever flown for operational meteorological use. The center frequencies per channel are detailed in Table 2.| MWHS-1 | MWHS-2 | MHS | ATMS | |||||||
| # | C. Freq. | # | C. Freq. | # | C. Freq. | # | C. Freq. | |||
| 1 | 150 (V) | 1 | 89.0 (V) | 1 | 89.0 (V) | 16 | 89.5 (V) | |||
| 2 | 150 (H) | 2* | 118.75±0.08 | 2 | 157 (V) | 17 | 165.5 (H) | |||
| 3* | 183.31±1.0 | 3* | 118.75±0.2 | 3* | 183.31±1.0 | 22* | 183.31±1.0 | |||
| 4* | 183.31±3.0 | 4* | 118.75±0.3 | 4* | 183.31±3.0 | 21* | 183.31±1.8 | |||
| 5* | 183.31±7.0 | 5* | 118.75±0.8 | 5* | 183.31 +7.0 | 20* | 183.31±3.0 | |||
| 6* | 118.75±1.1 | 19* | 183.31±4.5 | |||||||
| 7* | 118.75±2.5 | 18* | 183.31±7.0 | |||||||
| 8 | 118.75±3.0 | |||||||||
| 9 | 118.75±5.0 | |||||||||
| 10 | 150 (V) | |||||||||
| 11* | 183.31±1.0 | |||||||||
| 12* | 183.31±1.8 | |||||||||
| 13* | 183.31±3.0 | |||||||||
| 14* | 183.31±4.5 | |||||||||
| 15* | 183.31±7.0 | |||||||||
Table2. FY-3 humidity sounder characteristics by channel number (#) and center frequency (C. Freq.). Actively assimilated channel numbers are marked by an asterisk. Similar channels of the MHS and ATMS instruments are offered as points of comparison. The polarization (at nadir) of imager channels is given in parentheses.
Chen et al. (2015) demonstrated that MWHS-1 observations could be assimilated in a global NWP system with positive forecast impact. Several operational centers used these observations operationally, e.g., ECMWF from September 2014, until the data provision was stopped on 1 June 2020. Full details of the assimilation choices in the ECMWF system are provided in Chen et al. (2015); here, we recall only the main aspects. MWHS-1 is used only for observations for which cloud contributions do not need to be considered in the radiative transfer. Instead, cloud-affected observations are screened out, reflecting similar approaches used for AMSU-B and MHS at the time, and following similar procedures used for the Advanced Technology Microwave Sounder (ATMS; Bormann et al., 2013). For MWHS-1, background departures in one of the 150-GHz window channels are used for this purpose. MWHS-1 radiances are assimilated over water only, as the lack of an 89-GHz window channel means that approaches developed for AMSU-B or MHS for assimilation over land are not applicable. The Radiative Transfer Model For Television Infrared Orbiting Satellite Operational Vertical Sounder (RTTOV) package is used as observation operator (Saunders et al., 2018).
Geer et al. (2017) demonstrated that humidity-sensitive microwave radiances have a larger forecast benefit when assimilated in all-sky conditions, meaning that data are used in areas of cloud and precipitation as well as in clear skies, and cloud effects are taken into account in the radiative transfer. MHS observations were therefore moved to all-sky assimilation and a similar all-sky assimilation approach was developed for MWHS-2, following the one developed for MHS (e.g., Geer et al., 2014). Full details on the assimilation setup for MWHS-2 can be found in Lawrence et al. (2018). The fast scattering-capable radiative transfer model RTTOV-SCATT is used as observation operator (Bauer et al., 2006). The 118-GHz channels on MWHS-2 can also provide information on clouds and precipitation in addition to temperature and can be assimilated using the same all-sky assimilation approach. At ECMWF, observations made by MWHS-2 have been assimilated since April 2016 and December 2019 for FY-3C (Lawrence et al., 2018) and -3D (Duncan et al., 2019), respectively, with benefits in forecast skill.
The positive impact of assimilating the 183-GHz channels on MWHS-2 is significant, given how many humidity channels are actively assimilated already, as it demonstrates no saturation yet in the utility of more 183-GHz observations in the forecast system. In addition to the MWHS-2 observations, 183-GHz data are available from two ATMS, four MHS, a Global Precipitation Measurement Microwave Imager (GMI), and two Special Sensor Microwave Imager/Sounder (SSMI/S) sensors. The 118-GHz channels on MWHS-2 have limited utility for temperature information within the present observing system given their relatively high noise levels when compared to other temperature sounding channels (Lawrence et al., 2018), but they have shown benefit through all-sky assimilation and add further robustness to the assimilation.
3
2.1.1. Data characteristics
To assess the overall quality of the humidity sounding observations, observations are compared with short-range model forecasts in Fig. 1. These statistics were compiled for used data points over ocean that pass cloud screening criteria. The cloud screening is applied because representation errors are dominant in cloudy regions, whereas clear-sky regions allow a better assessment of instrument performance. For the humidity sounders in all-sky (MWHS-2, MHS), the cloud screening follows Lawrence et al. (2018) with a symmetric cloud predictor using a scattering index from the 89- and 150-GHz channels; for humidity sounder channels in the clear-sky stream (MWHS-1, ATMS), no further cloud screening is applied. All three FY-3 series humidity sounders actively used in the assimilation experiment are shown, along with one MHS (MetOp-B) and one ATMS (NOAA-20) for comparison. For ATMS, 3×3 footprint averaging is applied before assimilation (Bormann et al., 2013). This is primarily to reduce the noise for the temperature-sounding observations, but it is also applied to the 183-GHz humidity-sounding channels. Since the 3×3 footprint averaging for ATMS significantly impacts the statistics, both averaged and non-averaged ATMS departure statistics are shown from NOAA-20.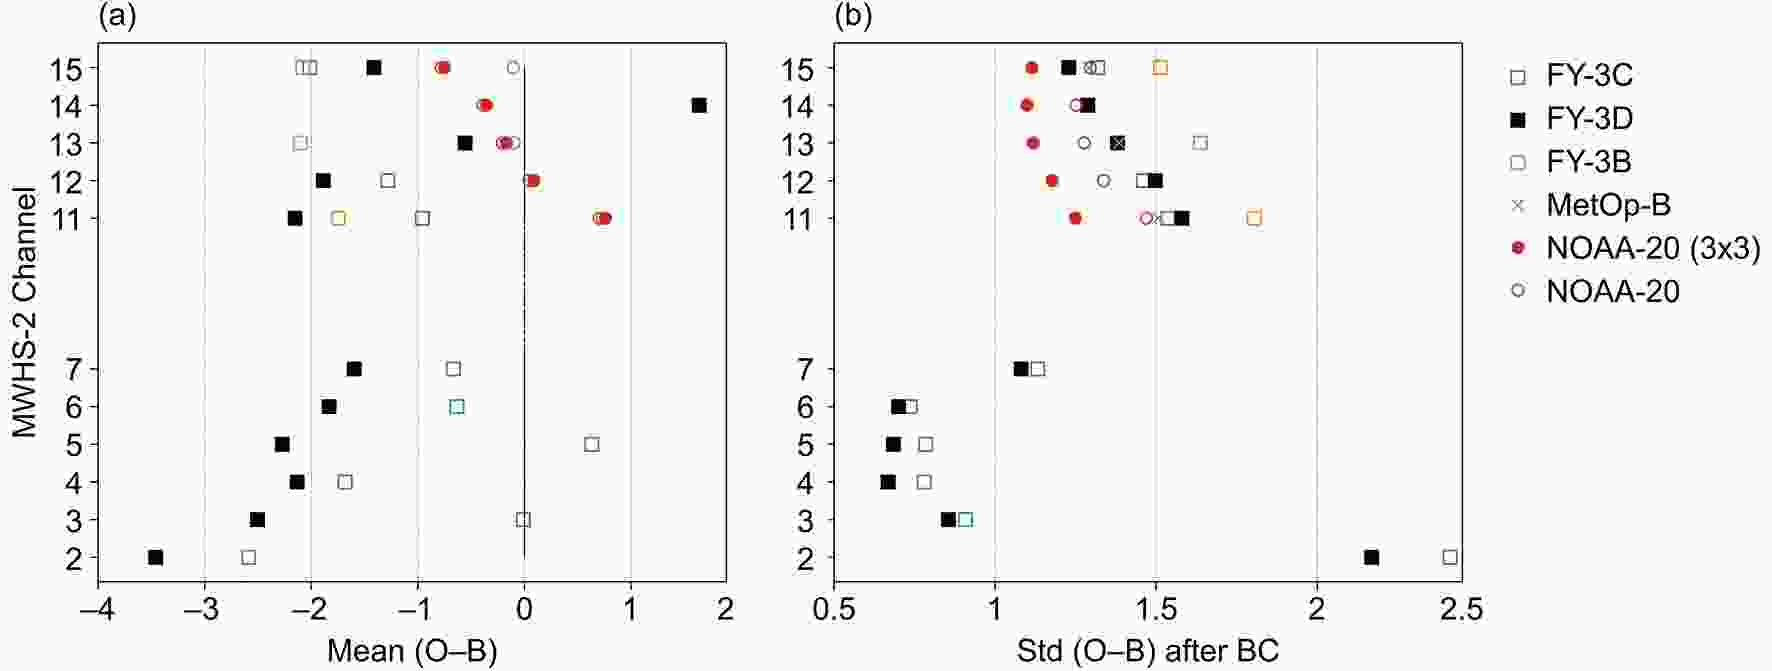 Figure1. Background departure statistics for selected microwave humidity sounders in the FY-3 experiment (section 3). Mean O-B before bias correction is given in panel (a), with the standard deviation of O-B after bias correction given in panel (b). The statistics are for used data over ocean that pass a cloud screening check, covering the period September 2019.
The standard deviations of background departures show that MWHS-2 performs similarly to MHS or unaveraged ATMS data for the 183-GHz channels (MWHS-2 channels 11–15), whereas MWHS-1 data exhibit higher values. The latter is consistent with Chen et al. (2015) who noted that the MWHS-1 noise performance is more similar to that of the older AMSU-B instruments. For the 118-GHz channels, the better performance from FY-3D relative to FY-3C is noteworthy. However, as pointed out by Lawrence et al. (2018), the statistics are still considerably larger than for traditional temperature-sounding channels in the 50–60-GHz range peaking at similar altitudes, for which standard deviations of background departures tend to be around 0.15–0.2 K. The high sensor noise of MWHS-2 channel 2 (peaking around 20 hPa) is particularly evident here. Note that after the 3×3 averaging used in the ECMWF system prior to assimilation, standard deviations of background departures for ATMS are significantly lower for the 183-GHz channels. As noted by Lawrence et al. (2018), a similar strategy may be attractive for MWHS-2, particularly for the 118-GHz channels, to reduce the effective noise, but this is left to future work.
Global mean biases against the background are mostly larger for MWHS-1 and MWHS-2 than typically encountered for other sounding instruments (Fig. 1). Note that, particularly for humidity, the background fields are not necessarily unbiased, so do not provide an absolute reference. However, evaluations against reference radiosondes show that absolute biases in the ECMWF fields for 183-GHz channels are less than 1 K (Newman et al., 2020). Most of the 183-GHz channels show negative biases exceeding this level, with FY-3D channel 14 instead showing a larger positive bias. Neither MWHS-2 instrument follows the spectral bias gradient previously observed for 183-GHz channels displayed by all other sensors carrying these channels (cf., Brogniez et al., 2016), also suggesting instrument bias is significantly different to these other 183-GHz observations. For the MWHS-2 118-GHz channels, no other instrument with similar channels is available for comparison. However, the negative biases seen here are considerably larger than biases typically found for traditional temperature-sounding channels on AMSU-A or ATMS in the 50–60-GHz range peaking at similar altitudes. The latter typically exhibit biases in the range of ±0.5 K. Evaluations using reference radiosonde observations suggest that the bias in ECMWF fields for 50–60-GHz channels is also typically within the range of ±0.5 K (Carminati et al., 2019b) and hence is unlikely to explain the large biases seen for the 118-GHz channels here. This suggests considerable instrument or radiative transfer biases for the 118-GHz channels. While the size of the biases seen here in all channels is somewhat larger than typically encountered in sounding instruments, these are corrected for during the assimilation of the data using variational bias correction (VarBC; Auligné et al., 2007). Practical experience shows that this adequately addresses the biases, as previously reported in Chen et al. (2015) and Lawrence et al. (2018).
Note that FY-3C MWHS-2 channels 13 and 14 are not shown in Fig. 1. This is because they were not actively used operationally at ECMWF and are therefore excluded from these experiments. As described in Lawrence et al. (2018), these two channels exhibited large changes in bias earlier in the lifetime of FY-3C, apparently correlated to occasional abrupt changes in the instrument temperature. These biases stabilized from late 2016 onward, but an orbital-dependent bias was subsequently noted, with clear differences in bias for the ascending and descending parts of the orbit. This is illustrated in the bottom panel of Fig. 2. Such orbital biases are not captured by the bias-correction model used for these channels. Examination of a long time-series from the operational monitoring of these biases (after bias correction) revealed a seasonal aspect to this signal (top panel). Similar biases are a common feature of conically scanning instruments, where they have been linked to reflector emission signatures (e.g., Bell et al., 2008); but to our knowledge, this bias pattern has not been described before for these cross-track MWHS-2 channels. The reasons for the orbital biases are unclear. They are likely linked to the thermal characteristics of the instrument due to the varying illumination by the sun during the orbit. Note that after a period of data outage in spring 2020 these biases seem to have been mitigated, but neither the physical cause nor solution were readily apparent. Despite this issue, the orbital bias is still small relative to observation errors typically assigned for clear-sky scenes at these channels (2.0 K), and much smaller than cloudy-sky errors.
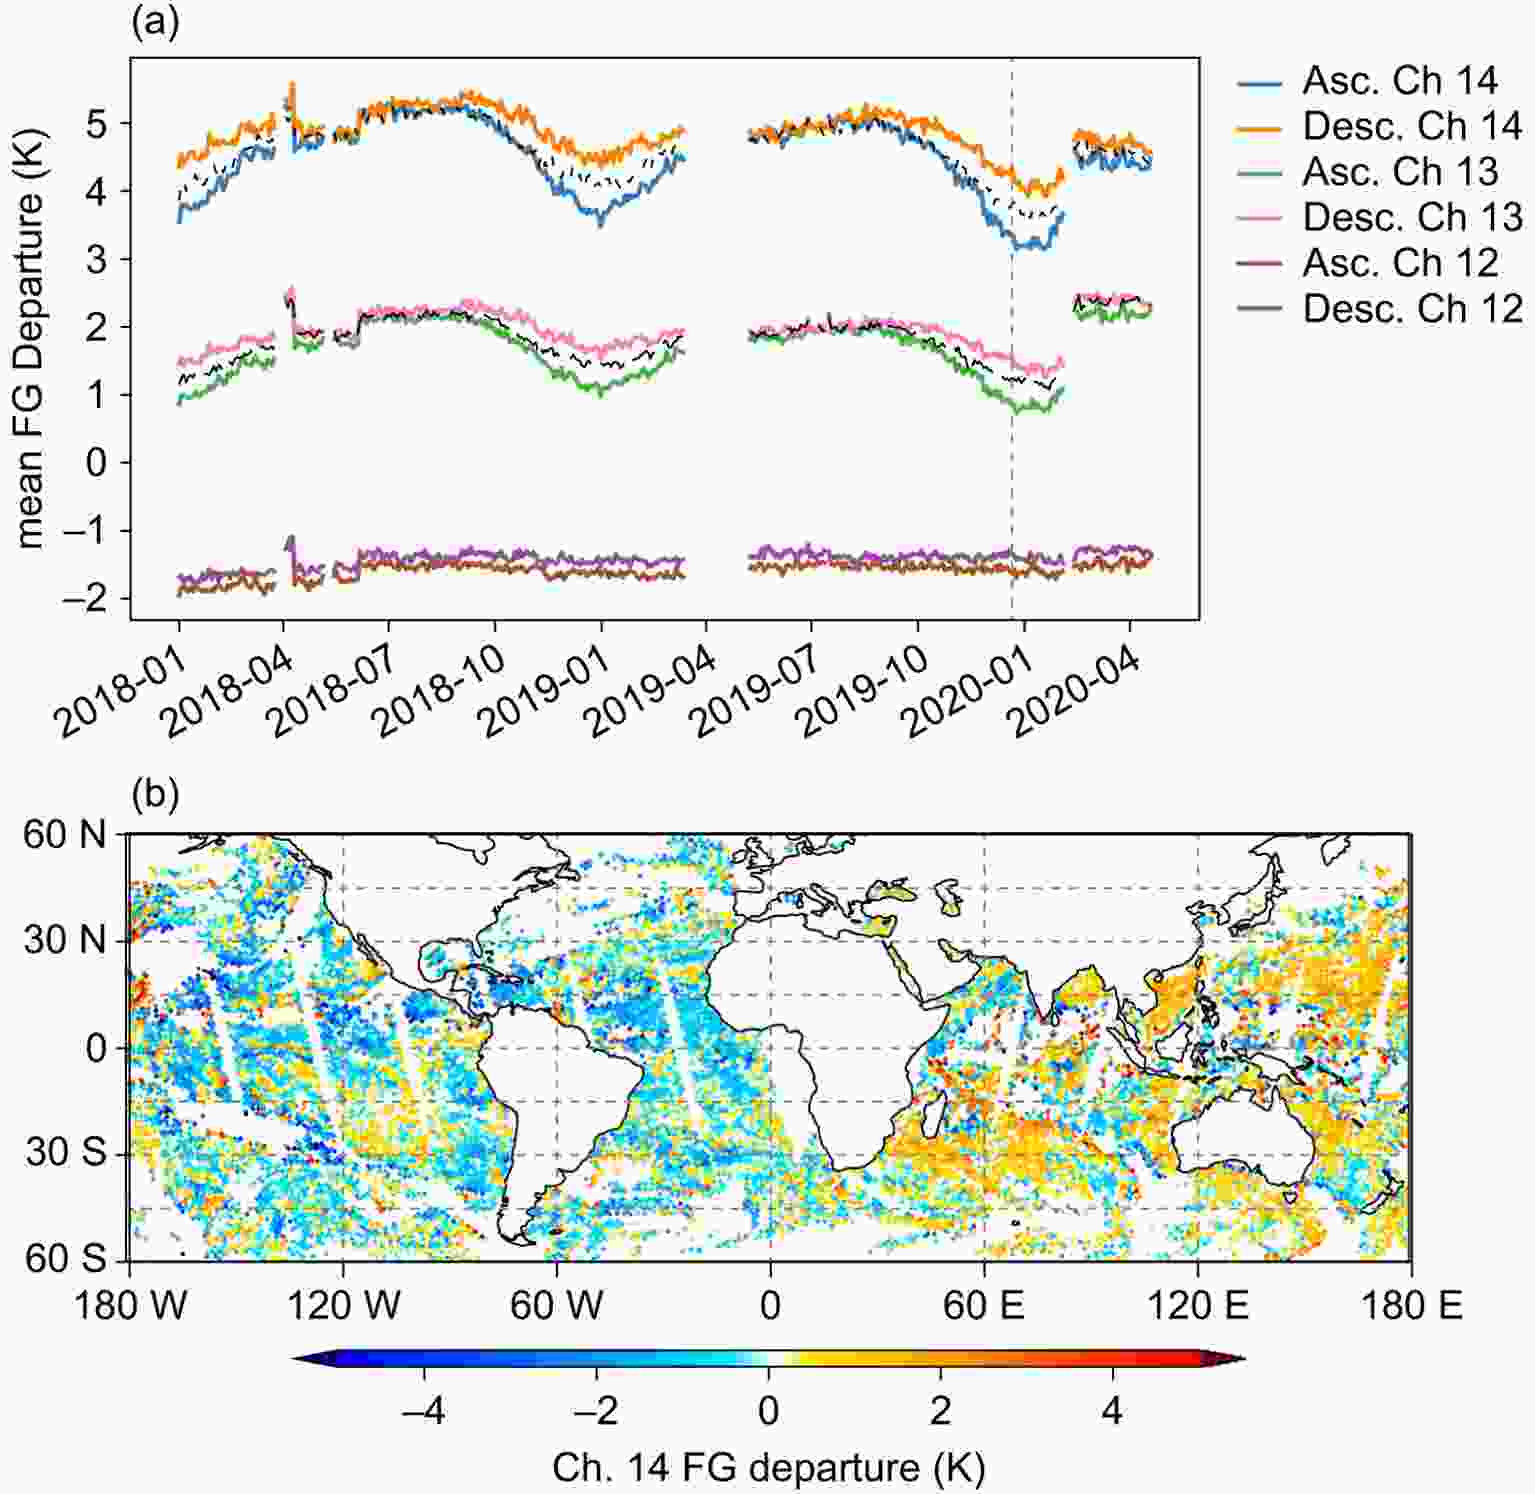 Figure2. Top panel: Mean background departure for FY-3C MWHS-2 channels 12, 13 and 14, before bias correction, with observations separated into those of ascending (Asc.) and descending (Desc.) orbital nodes. A dashed and dotted black line shows the mean bias correction applied to channels 13 and 14, respectively. Bottom panel: An example of background departures of assimilated data from FY-3C MWHS-2 channel 14, for the period 2100 UTC on 20- December to 0900 UTC on 21 December 2019. This date is indicated by a grey dashed line in the top panel.
2
2.2. MWRI
MWRI is a conically scanning microwave imager with five frequencies ranging from 10.65 to 89 GHz, each with horizontal (h) and vertical (v) polarization. With this set of frequencies, MWRI is sensitive to land and ocean surfaces, as well as water in the atmosphere in its various forms. The spatial resolution of the observations depends on the frequency, with 10.65 GHz having the largest footprint size of about 51×85 km and 89 GHz having the smallest with 9×15 km. MWRI has been onboard each of the FY-3 satellites, starting with FY-3A, though presently only data from FY-3D are available (MWRI on FY-3C was deactivated on 4 February 2020). In this study, we hence focus on MWRI onboard FY-3D, which is in a sun-synchronous orbit with an ECT of 1400. This is similar to the Advanced Microwave Scanning Radiometer-2 (AMSR-2), which has an ECT of about 1330 and a similar channel suite, providing a useful point of comparison as AMSR-2 has been actively assimilated at ECMWF for years (Kazumori et al., 2016). The zenith angle is 53.1° for MWRI, similar to AMSR-2’s 55° zenith angle.A particularly novel feature of MWRI is its three-point calibration process (Yang et al., 2012), which employs three reflectors, aimed at reducing some of the calibration issues commonly encountered with conical scanners (e.g., Bell et al., 2008; Geer et al., 2010). The Earth scene, cold-space, and a warm load calibration target are all viewed through the main reflector, such that errors due to the emission from the main reflector can be removed during the calibration. Two further reflectors are used for the warm-load view and for viewing cold space, respectively. The characteristics of these reflectors cannot be removed during the calibration process, and they were initially determined by pre-launch measurements. However, as the initial calibration resulted in ascending/descending biases (e.g., Lawrence et al., 2017), the calibration approach has subsequently been revised by Xie et al. (2019), using in-orbit estimates of some of the reflector characteristics.
Microwave imagers provide significant impact when used in an all-sky assimilation framework, including for total column water vapor and lower-tropospheric wind (Geer et al., 2017). At ECMWF, radiances measured at the 18.7 v/h, 23.8 v/h, 36.8v and 89v GHz channels from MWRI are actively assimilated over ocean between 60°S and 60°N, along with three other microwave imagers: the F17 SSMI/S, GMI, and AMSR-2 on the Global Change Observation Mission for Water (GCOM-W) satellite. The assimilation of all microwave imagers is done in all-sky (clear, cloudy, rainy, icy and snowy) conditions, again using the RTTOV-SCATT radiative transfer model. The assimilation of MWRI closely follows that of AMSR-2, described in detail in Kazumori et al. (2016). Experimentation at ECMWF has shown that in the absence of AMSR-2, MWRI can replicate a large proportion of the impact of AMSR-2, and best results are achieved with a combined use of MW imager data from SSMI/S, GMI, AMSR-2, and MWRI.
3
2.2.1. Data characteristics
To assess the performance of MWRI, Fig. 3 examines its O-B characteristics in a global sense within the ECMWF system. These data are screened for land, sea ice, and clouds to focus on radiometric rather than model performance. The absolute magnitude of mean departures is similar to those of AMSR-2 on GCOM-W before bias correction (about 1–3 K), though the 36.5v channel of FY-3D MWRI shows a large bias of about ?5 K. The strong positive bias of AMSR-2 cold sector brightness temperatures is well documented (Berg et al., 2016), but the magnitude of bias correction for MWRI is larger than for most microwave imagers. The standard deviation of background departures after bias correction (Fig. 3b) is also comparable to AMSR-2 for the channels actively assimilated on FY-3D MWRI, though for each assimilated channel the AMSR-2 performance for background departures is slightly better.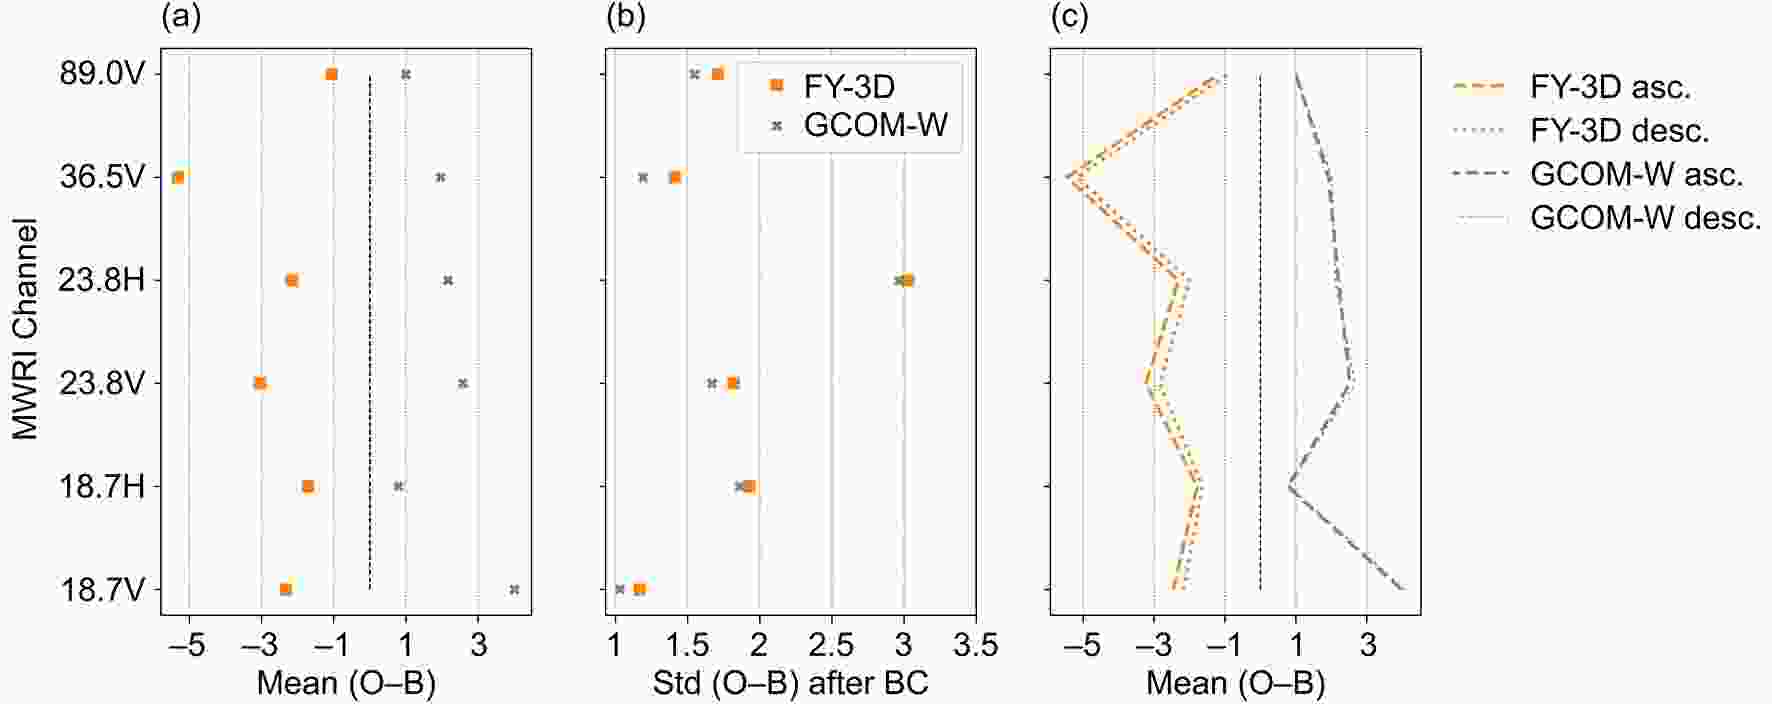 Figure3. Background departure statistics for selected microwave imagers in the FY-3 experiment (section 3). Mean O-B before bias correction is given in panel (a), with the standard deviation of O-B after bias correction given in panel (b), and mean O-B calculated for ascending (asc.) and descending (desc.) orbital nodes separately in panel (c). The statistics are for used data over ocean that pass a cloud screening check, covering the period September 2019. The cloud screening check applied requires a cloud amount of less than 0.01, using the average between the observed and modeled cloud amount estimated from the polarization difference in the 37-GHz channels.
Figure 4 further highlights the consistency of the background departures (after bias correction) for the FY-3D MWRI and AMSR-2 for one example data assimilation cycle from the FY-3 experiment for one of the 36.5-GHz channels. With the ECTs of the two satellites being about half an hour apart, the departure patterns are strikingly similar. For instance, the same positive departure signal is evident in the stratocumulus clouds west of South America; groups of positive and negative departures side by side are evident in the ITCZ.
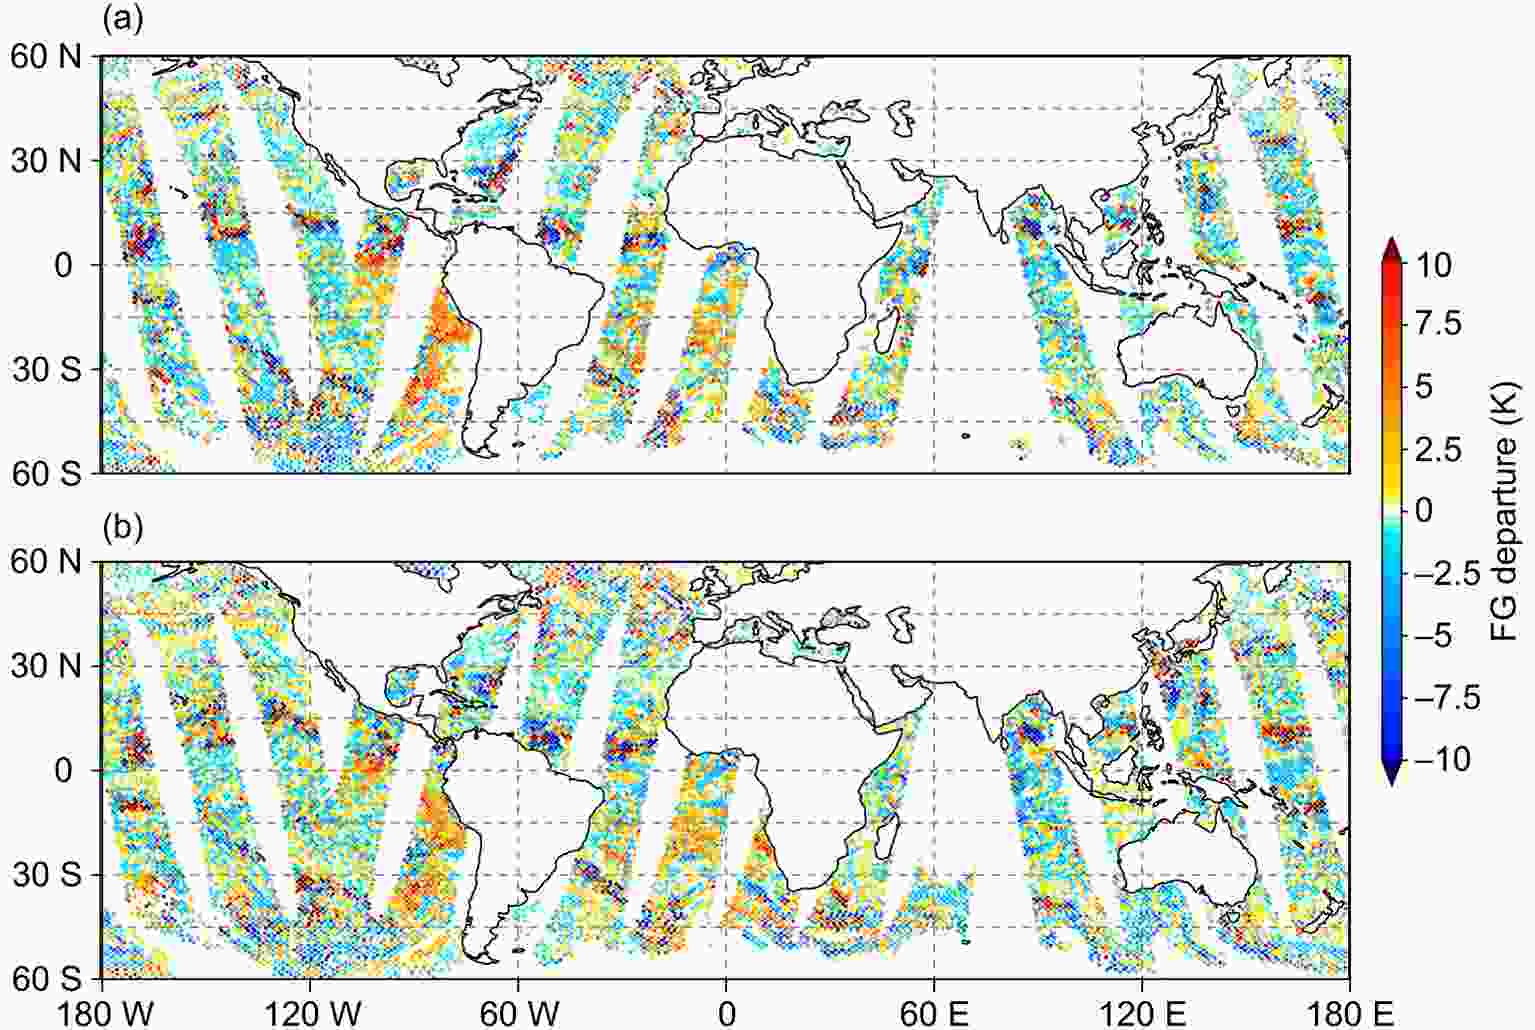 Figure4. Background departures for the 36.5v channels on FY-3D MWRI (top) and GCOM-W AMSR-2 (bottom) for the 0000 UTC cycle on 21 September 2019. Only assimilated data are shown.
For microwave imagers, orbital biases can be problematic (e.g., Bell et al., 2008). While no major orbital biases are apparent in Fig. 4, this is more quantitatively assessed for all channels in Fig. 3c, where we show biases for the ascending and descending orbital nodes separately. A small mean difference is noticeable for MWRI between the different orbital nodes that is not present in AMSR-2 data. However, these differences are typically around 0.5 K and hence smaller than noted previously during early assessments of the FY-3C MWRI (e.g., Xie et al., 2019). These differences are considered not significant enough to prohibit active assimilation or to require dedicated treatment in the bias correction model. The better performance seen here is consistent with findings by Carminati et al. (2020) and Xiao et al. (2020), and likely reflects improvements in the calibration of MWRI as described by Xie et al. (2019).
2
2.3. GNOS
The GNOS instrument on both FY-3C and FY-3D is a multi-GNSS satellite receiver able to measure both Global Positioning System (GPS) and BeiDou signals (see Bai et al., 2014; Liao et al., 2019). Currently, only bending angle profiles produced with GPS radio occultation (GPS-RO) measurements are used operationally at ECMWF. The GNOS instrument measures the L1 and L2 GPS signals at 50 Hz in closed loop and the L1 at 100 Hz in open loop. It provides both rising and setting occultations. The GNOS GPS-RO measurements are processed operationally with the Radio Occultation Processing Package (ROPP) (Culverwell et al., 2015). A geometrical optics retrieval (e.g., Kursinski et al., 1997) to bending angles is used above an impact height (impact parameter minus radius of curvature) of 25 km, and a CT2 (canonical transform 2) wave optics approach is used below (Gorbunov and Lauritsen, 2004). The GNOS L2 signal has lower signal-to-noise than other GPS-RO instruments, and the GNOS bending angle profiles have a greater reliance on the extrapolation of the L2 signal than other instruments, as discussed by Liao et al. (2019). Liao et al. (2019) also summarize various quality control steps used in the pre-processing of GNOS data.As with the other GPS-RO measurements, the GNOS bending angle profiles are simulated using a fast 2D ray-tracing operator, which calculates the bending of the signal path due to changes in the refractive index in the atmosphere, as further described in Healy et al. (2007). The GNOS measurements are not bias corrected, so they help constrain the bias corrections applied to satellite radiances. The same global observation uncertainty model is currently used to weight all GPS-RO measurements in the 4D-Var. The percentage of observation uncertainty is given as a function of the impact height. It is assumed to be 20% for an impact height of 0 km, falling linearly to 1.25% at 10 km. It stays at 1.25% above 10 km, until this reaches a lower limit of 3 microradians, typically at a height of around 32 km. Vertical error correlations are neglected for GNOS and the other GPS-RO instruments, so the error covariance matrix used to assimilate the data is diagonal. No GPS-RO bending angles with impact heights above 50 km are assimilated. The FY-3C/D GNOS measurements are not currently assimilated below 10 km in the latitude band between ±20°, and below 8 km elsewhere, because the FY-3C data degraded the fit to MW humidity-sounding radiances in pre-operational testing.
Figures 5a and b respectively show the mean and standard deviation of the globally averaged FY-3C, FY-3D and MetOp-B GNSS Receiver for Atmospheric Sounding (GRAS) (O-B)/B bending angle departures, in the vertical interval from 8 km to 50 km, for the period 1–30 September 2019. The GNOS and GRAS departures are reasonably consistent from 8 km up to 30 km. This vertical interval is sometimes referred to as the GPS-RO “core region”, and it is where the GPS-RO data have the highest information content and are given the most weight in the assimilation. Small consistent variations in the vertical in the mean departures are likely due to small variations in the temperature bias in the background fields. The GNOS/GRAS differences in the interval between 20 and 25 km are related to the transition between the geometrical optics and the wave optics processing in ROPP. The standard deviation of the GNOS departures is clearly larger than GRAS above 35 km, and the FY-3D noise is larger than FY-3C. However, the standard deviation of the FY-3D departures remains below the 3 microradians assumed in the uncertainty model used to assimilate the data. The MetOp-B and FY-3C biases are consistent up to 50 km with differences of less than 0.2%, but the FY-3D biases differ above 35 km. This FY-3D bias is caused by the setting occultations and it is not fully understood. Therefore, we do not assimilate the setting FY-3D measurements above 30 km in this study.
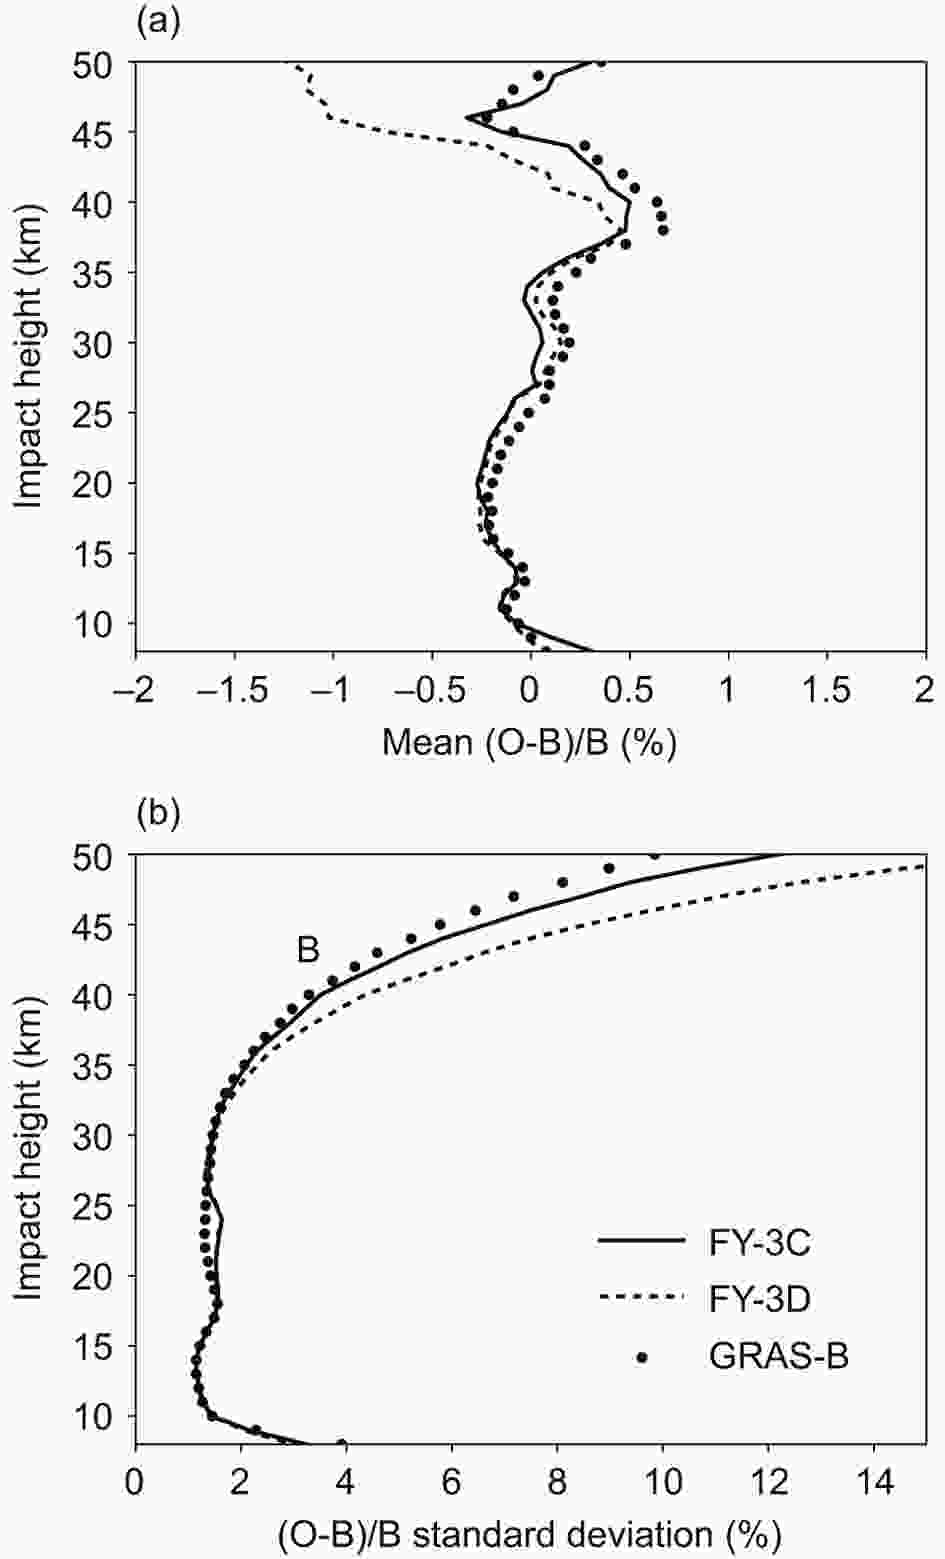 Figure5. Global mean (top) and standard deviation (bottom) of the bending angle departures for FY-3C and FY-3D GNOS and MetOp-B GRAS for the period 1–30 September 2019. Departures are normalized by the background values, and hence displayed in percent.
3.1. Design of observing system experiments
Observing system experiments have been run to assess the combined impact of the FY-3 observations listed in Table 1. The experiments use ECMWF’s 4D-Var assimilation system (Rabier et al., 2000), with a 12 h assimilation window, a model resolution of TCo 399 (approximately 25 km), a final incremental analysis resolution of TL 255 (approximately 80 km), and 137 model levels up to 0.01 hPa. The spatial resolution is hence lower than used in the operational system, in order to save computational cost, though the version of the assimilation system is the same as used in operations at the time. Ten-day forecasts were run from each 0000 UTC and 1200 UTC analysis. Further details on the ECMWF assimilation system can be found in Rabier et al. (2000) and Bonavita et al. (2012).The following assimilation experiments have been run: The Control experiment excludes all FY-3 observations, but otherwise assimilates the full observing system used operationally at the time. This includes the full set of in-situ observations, as well as a wide range of satellite data, including nine MW temperature-sounders, nine MW instruments with humidity-sounding capability, three MW imagers, five hyperspectral IR instruments, five geostationary IR imagers, and Atmospheric Motion Vectors from a variety of platforms, as well as radio occultation measurements from up to eight satellites. In a second experiment, data from FY-3B, -3C and -3D were added, using the instruments listed in Table 1, and this will be referred to as the FY-3 experiment. The experiments cover the six months of 1 September 2019 to 29 February 2020. In order to accelerate the experimentation, the experiment period was split into two subperiods of three months, which were run separately. Each of these was preceded by a 10-day spin-up period to allow VarBC to adapt, which was particularly necessary for the new FY-3D instruments because they had not been used operationally at the time. These spin-up periods are excluded in the forecast-impact evaluation presented below. The FY-3 experiment and the Control use the same background error specification, adapted from that used in operations at the time (Bonavita et al., 2012). Therefore, the effect of different observation usage on the background error is not taken into account. The effect of this is expected to be small, as the vast majority of observations used is unchanged and the change in the errors in the background will be comparatively minor.
In the following, we compare the performance of the FY-3 and the Control experiment to evaluate the impact of adding the FY-3 observations. This will be done by assessing background departure statistics for other assimilated observations, as well as by comparing forecasts at different forecast ranges against ECMWF’s operational analysis. The background departure statistics against other observations provide a useful evaluation of the performance of short-range forecasts (up to 12 hours), allowing a detailed attribution of the benefits of assimilating FY-3 data for a range of variables. They also avoid issues of correlations between errors in the forecasts and analyses commonly encountered in verification against analyses at the short range. For longer forecast ranges, this aspect is less important, as analysis errors become small compared to forecast errors.
2
3.2. Forecast impact results
Background departure statistics for a wide range of observations indicate benefits for most variables, reflecting the strengths and complementarities of the different instruments assimilated from FY-3. The clearest improvements are seen for many satellite observations sensitive to tropospheric humidity, such as water vapor channels from other passive MW or IR instruments (Figs. 6a–c). Standard deviations of background departures are reduced by typically 0.5%–1.0% for these channels. This reflects that all instruments considered in these experiments have some sensitivity to tropospheric humidity: the three MW humidity sounders have been shown in the past to provide the main impact for the mid- and upper troposphere (e.g., Chen et al., 2015; Lawrence et al., 2018), whereas GNOS and MWRI lead to further benefits for the upper and lower troposphere, respectively. Other MW imagers assimilated in all-sky conditions also show significantly reduced background departures (Fig. 6b), suggesting improvements in the short-range forecasts of total column water vapor or clouds. In contrast to the satellite observations, humidity observations from radiosondes, however, show a less clear impact (Fig. 7a). As the majority of radiosondes are based over land, this may suggest that the humidity benefits are strongest over oceanic regions.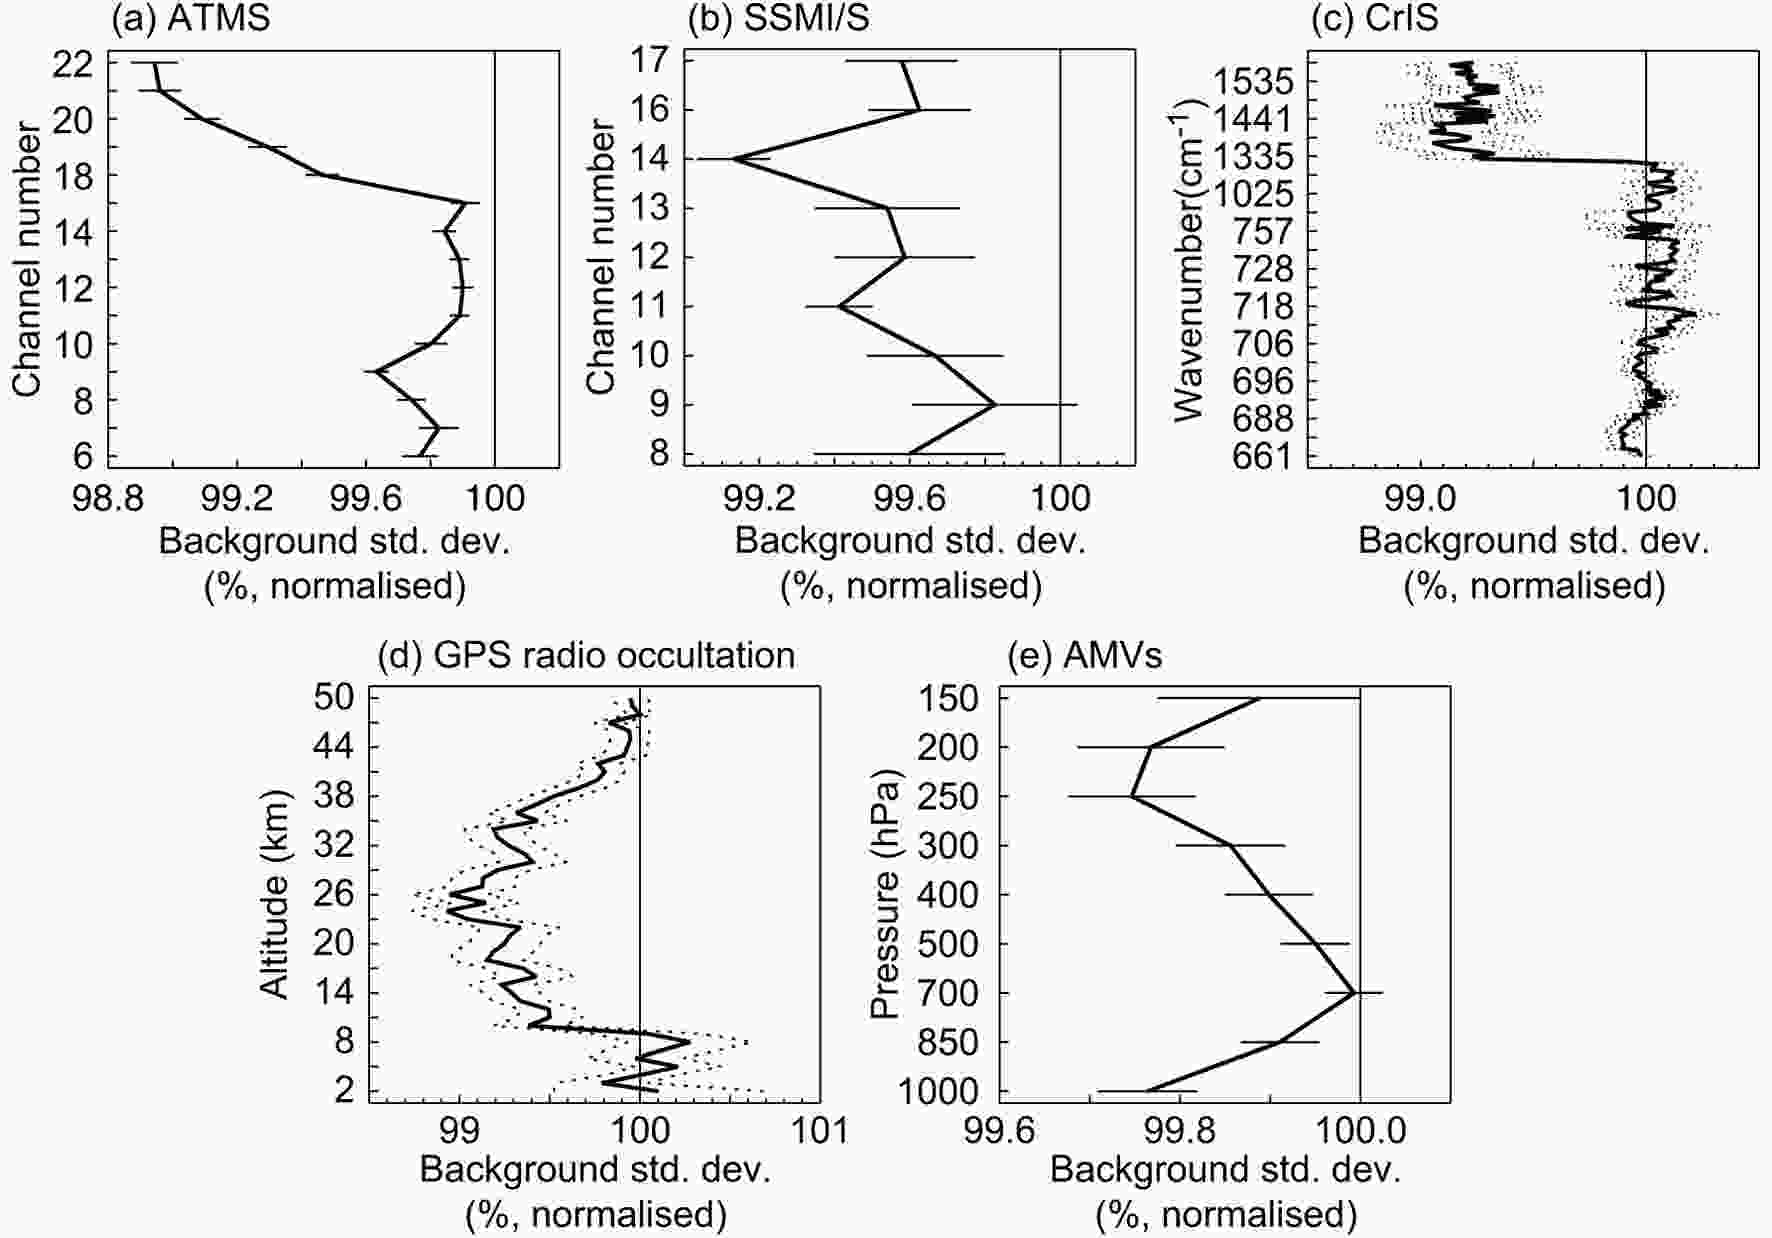 Figure6. (a) Standard deviations of background departures for used ATMS data for the FY-3 experiment, normalized by values of the Control. Channels 6–15 are temperature-sounding channels, whereas 18–22 are humidity-sounding channels. Statistics are global and cover the full six-month period. Horizontal lines indicate statistical significance at the 95% level. (b) As in (a) but for SSMI/S, with channels 8–10 humidity sounding and channel 11–17 traditional MW imager channels. (c) As in (a) but for CrIS, with wavenumbers above 1200 cm?1 representing water-vapor sounding channels. Significance intervals are shown by dotted lines in this case. (d) As in (c) but for GPS radio occultation instruments other than GNOS. (e) As in (a) but for atmospheric motion vectors (AMVs).
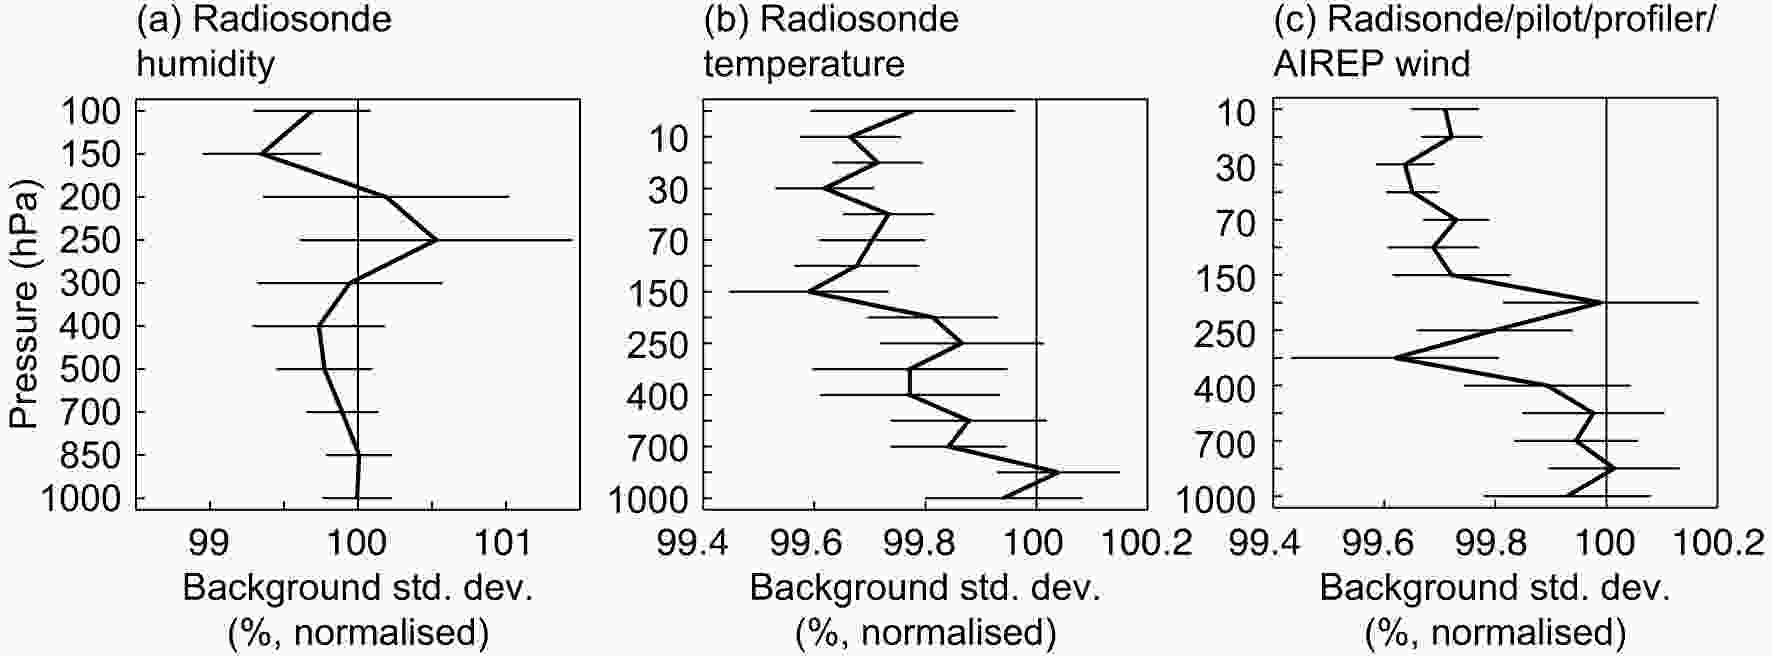 Figure7. (a) As in Fig. 6a but for humidity observations from radiosondes. (b) As in (a) but for temperature observations from radiosondes. (c) As in (a) but for wind observations from radiosondes, pilot balloons, profilers, or aircraft reports (AIREPs).
Linked to the benefits in humidity, several observations suggest statistically significant benefits in the short-range wind forecasts in the lower and upper troposphere (e.g., Fig. 6e, Fig. 7c). This is a common finding in 4D-Var experiments with humidity-sensitive observations, and it is the result of the so-called tracing effect (e.g., Peubey and McNally, 2009; Geer et al., 2017): 4D-Var is able to infer adjustments to the dynamics from observations of humidity or clouds over the 12-hour time window, and the addition of many observations sensitive to humidity in the FY-3 experiment is clearly beneficial in this respect. Slight differences in the level of impact shown in Figs. 6e and 7c reflect different geographical sampling and error characteristics of the two different observing systems.
Another area of clear benefits for short-range forecasts are temperature and wind in the upper troposphere/lower stratosphere (Figs. 6a and d, Figs. 7b and c). Radiosonde observations as well as MW temperature sounders show statistically significant reductions in standard deviations of background departures of around 0.2%–0.4% in this region. Improvements in these regions are a typical feature of the assimilation of GPS-RO (Healy and Thépaut, 2006). Linked to this are improvements in short-range wind forecasts, as indicated by conventional wind observations in this area (Fig. 7c). These are a common finding for the assimilation of GPS-RO data, with 4D-Var being able to exploit balance relationships between temperature and dynamics, including in the equatorial stratosphere (Healy et al., 2020).
Changes in the bias of the background fields against observations are negligible compared to the standard deviations of background departures (not shown). This suggests that the reduction of random forecast errors is the dominant benefit from introducing FY-3 data.
Verification of medium-range forecasts shows that the improvements in the short range are maintained up to the day-2 forecast range for the troposphere, and headline scores show statistically significant reductions of at most 2% for a wide range of variables and latitudes (e.g., Fig. 8). The latter translates to a gain of around an hour of forecast skill. Over the stratosphere and for total column water vapor, the benefits last somewhat longer, with statistically significant reductions in forecast errors out to day 4 or even beyond, particularly in the tropics.
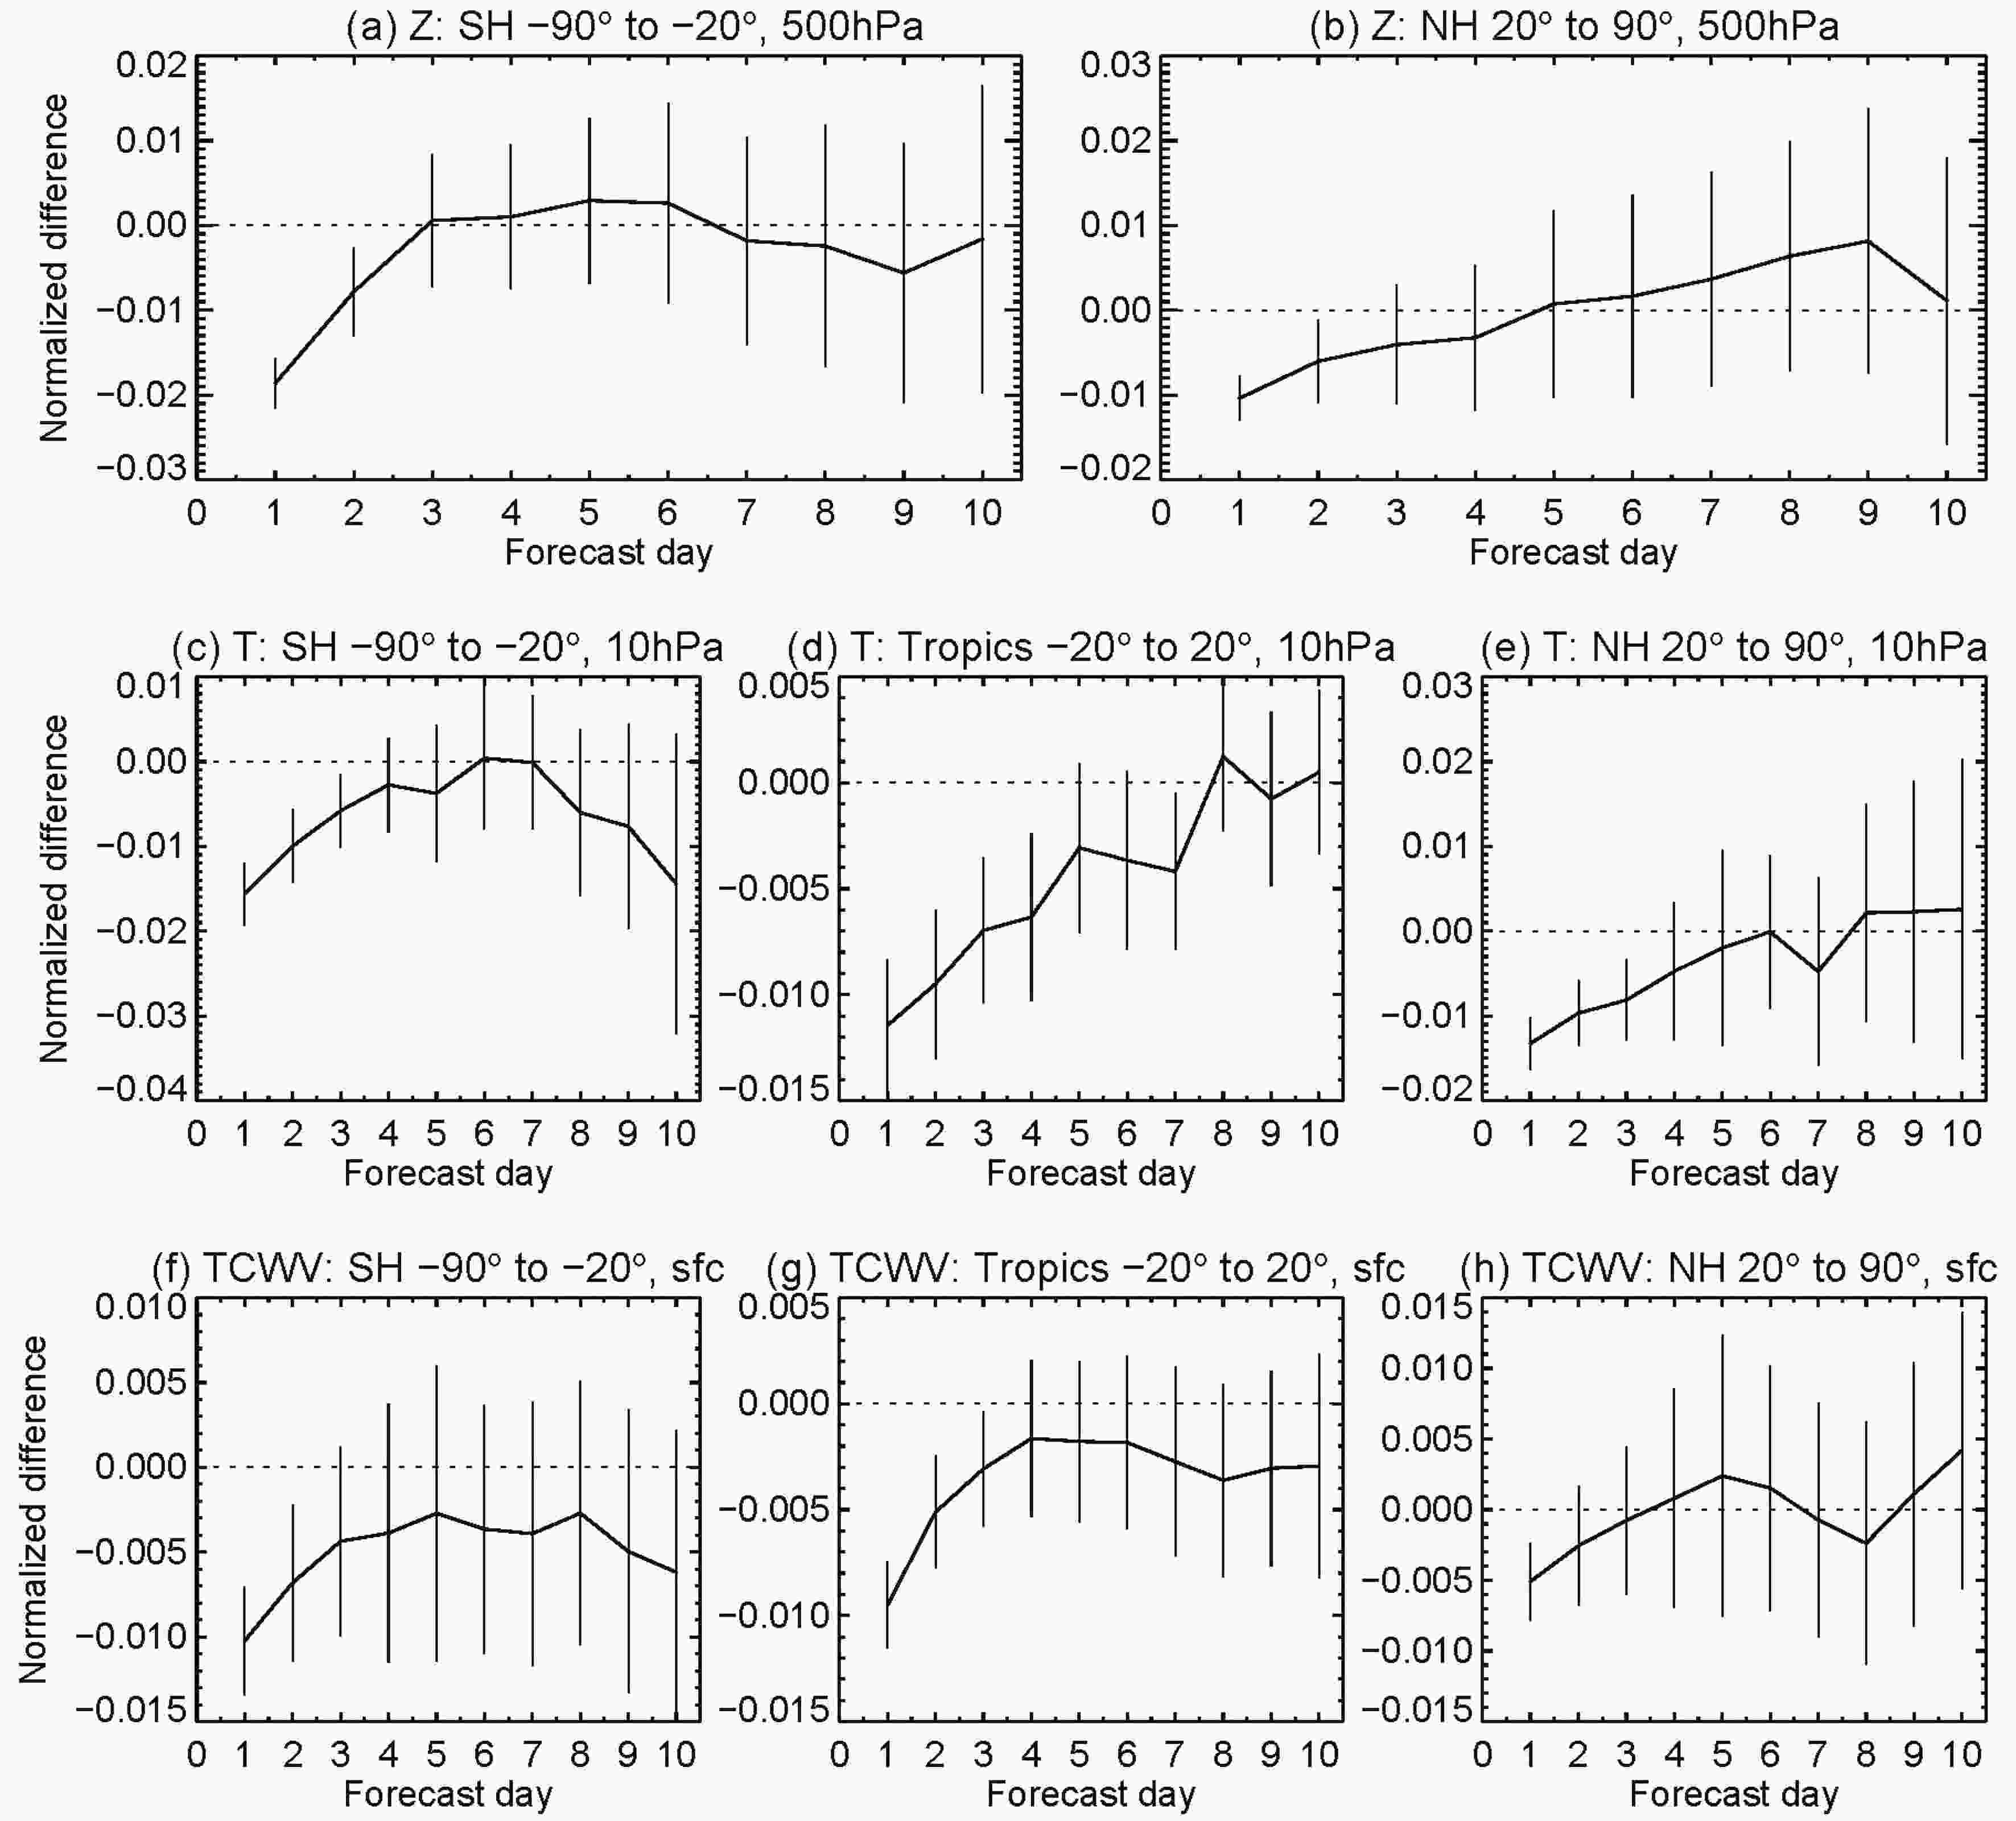 Figure8. Normalized difference in the standard deviation of forecast errors between the FY-3 experiment and the Control for the six-month study period. Negative values indicate a reduction in forecast error from using the FY-3 data. Vertical bars depict confidence intervals at the 95% level. Verification is against ECMWF’s operational analysis. The three rows of plots show statistics for the 500-hPa geopotential (top), 10-hPa temperature (middle), and total column water vapor (bottom), with the Southern Hemisphere extratropics on the left, the Northern Hemisphere extratropics on the right, and, for the two lower rows, the tropics in the middle.
The GNOS measurements represent a useful addition to the global GPS-RO dataset. They have similar bending angle departure statistics to MetOp GRAS measurements in the GPS-RO “core region”, in the vertical interval from around 8 km to 30 km, where the GPS-RO information content is largest. However, both FY-3C and FY-3D are noisier than MetOp-B GRAS above 35 km, with the FY-3D departures clearly larger than FY-3C. In addition, the FY-3D setting bending angles appear to be biased negatively above 35 km, compared to the other two instruments. The cause of this bias is not yet fully understood, so the FY-3D setting bending angles above 30 km are not assimilated.
An observing system experiment shows that the FY-3 instruments jointly contribute significantly to the forecast skill in the ECMWF system. Positive impact of up to 2% is seen for most variables out to the day-2 forecasts over hemispheric scales, with significant benefits for total column water vapor or in the stratosphere out to day 4. As expected, the impact is enhanced compared to previously reported results for the assimilation of observations from only one of the FY-3 sensors (cf., Chen et al., 2015; Lawrence et al., 2018; Duncan et al., 2019). The more persistent impact in the stratosphere most likely reflects that the two GNOS instruments provide around 15% of the GPS-RO observations assimilated during the study period, and FY-3D samples local times that are otherwise not well-covered by GPS-RO instruments from other satellites. It should be noted here that the provision of data from GNOS on FY-3C and MWHS-1 on FY-3B was stopped on 17 May and 1 June 2020, respectively. So, at the time of writing, the impact of FY-3B-D instruments in the operational ECMWF system will be smaller than presented here.
The forecast impacts are remarkable, as they are obtained in a system with a large number of similar sounding instruments, which hence displays a certain amount of robustness. In addition, FY-3C and -3D sample orbits that are already rather well-covered by the three MetOp satellites and S-NPP (Suomi National Polar-orbiting Partnership)/NOAA-20/GCOM-W, respectively, carrying a wide range of instruments with similar sensitivities. On the one hand, our results demonstrate that continued forecast benefits can be achieved through providing and assimilating more passive MW and radio occultation observations. On the other hand, previous studies suggest that the assimilation of data from the much less-well observed early morning orbit is particularly beneficial (Di Tomaso and Bormann, 2011). The present results in terms of data quality as well as forecast impact are therefore promising for the future assimilation of observations from FY-3E, due to be launched in 2020 into an early-morning orbit.
The present paper has focused on the instruments assimilated operationally in the ECMWF system. Not covered here are the MWTS or IR instruments provided. These instruments are also of interest to NWP, but their evaluation or data characteristics have not quite reached maturity of operational assimilation yet (Lu et al., 2015; Carminati et al., 2019a; Duncan et al., 2019). In addition, FY-3E will feature a scatterometer instrument, which will greatly complement the present coverage available from the ASCAT (Advanced Scatterometer) instrument on the MetOp satellites. With improving data quality and capabilities for future satellites, as well as more complementary orbital sampling, there is hence strong potential for further increases in forecast impact from FY-3 satellite data in the future.
Acknowledgements. We acknowledge funding from the EUMETSAT Fellowship Programme for Heather LAWRENCE, Katrin LONITZ and David DUNCAN. The collaboration with the China Meteorological Administration on data evaluation and utilization is also gratefully acknowledged.
