HTML
--> --> -->To avoid the complication and difficulties caused by the local non-ellipticity in solving the NBE, one can simply enforce the ellipticity condition to a certain extent by slightly smoothing or adjusting the given geopotential field. This type of treatment has been commonly used in iterative methods to solve the NBE as a boundary value problem (Bolin, 1955, 1956; Shuman, 1955, 1957; Bushby and Huckle, 1956; Miyakoda, 1956; Arnason, 1958; Bring and Charasch, 1958; Liao and Chow, 1962; Asselin, 1967; Bijlsma and Hoogendoorn, 1983). However, regardless of the above treatment, the convergence properties of these or any other iterative methods can be not only scale-dependent but also flow-dependent and thus very difficult to study theoretically and rigorously.
The above reviewed iterative methods can be classified into two types. In the first type (originally proposed by Bolin, 1955), the NBE is transformed into a linearized equation for a presumably small correction to the initial guess or to the subsequent updated solution when this linearized equation is solved iteratively. In the second type (originally proposed by Shuman, 1955, 1957; Miyakoda, 1956), the NBE is rearranged into a quadratic form of the absolute vorticity and the positive root of this quadratic form is used in the form of a Poisson equation to solve for the streamfunction iteratively. The initial guess for both types is the geostrophic streamfunction. Their convergence properties have been analyzed theoretically, but the analysis lacks rigor and generality, because the coefficients of the linearized differential operator for the first type and the forcing terms on the right-hand side of the iterative form of the linearized equation for the second type were functions of space but treated as constants (Arnason, 1958; Bijlsma and Hoogendoorn, 1983). Therefore, the convergence properties of the previously iterative methods were examined mainly through numerical experiments. Besides, due to the very limited computer memories and speed at that time, these earlier iterative methods employed the memory-saving sequential relaxation scheme based on the classical Liebmann-type iteration algorithm (Southwell, 1946) and applied to coarse resolution grids for large-scale flows. The sequential relaxation and successive over-relaxation (SOR) schemes have been used in the second type of iterative method (Shuman, 1955, 1957) to solve the NBE for hurricane flows (Zhu et al., 2002). However, using these iterative methods to solve the NBE still faces various difficulties especially when the spatial scale is smaller than the sub-synoptic scale. In particular, there are unaddressed challenging issues concerning whether and how the solutions can be obtained approximately and efficiently through a limited numbers of iterations, especially when the NBE becomes locally hyperbolic (due mainly to reduced spatial scales) and thus the iterative methods fail to converge.
This paper aims to address the above challenging issues. In particular, we will rederive the above two types of iterative methods formally and systematically by expanding the solution asymptotically upon a small Rossby number and substituting it into the NBE. Since the asymptotic expansion is not ensured to converge, especially when the Rossby number is not sufficiently small, the concept of optimal truncation of asymptotic expansion is employed and a criterion is proposed to obtain the super-asymptotic approximation of the solution based on the heuristic theory of asymptotic analysis (Boyd, 1999). As will be seen in this paper, by employing the optimal truncation, the issue of non-convergence of the iterative methods caused by the increase of Rossby number can be addressed to a certain extent. Besides, the recently developed Poisson solver based on integral formulas (Cao and Xu, 2011; Xu et al., 2011) will be used in comparison with the aforementioned classical SOR scheme to solve the boundary value problem in each iterative step. In particular, for flows of sub-synoptic scale or meso-α scale, the NBE can become locally hyperbolic and the solution will be checked in this paper via the proposed optimal truncation under certain conditions.
The paper is organized as follows. The next section presents formal and systematical derivations of the above reviewed two iterative methods. Section 2 formulates the criterion for optimal truncation, and section 3 constructs four different iterative procedures with optimal truncation and designs numerical experiments for testing the iterative procedures. Section 4 examines and compares the results of experiments performed with the four iterative procedures, followed by conclusions in section 5.
2.1. Scaling and asymptotic expansion based on small Rossby number
The NBE can be expressed in the following form (Charney, 1955):where


where


Formally, we can scale x and y by L, scale f = f0 + f′ by f0, and scale ψ and ? by UL and f0UL, respectively, where U is the horizontal velocity scale, L is the horizontal length scale, f0 is a constant reference value of f which can be the value of f at the domain center. The scaled variables are still denoted by their respectively original symbols, so the NBE can have the following non-dimensional form:
where Ro

where F = f′/(f0Ro) ≤ O(1) and O() is the “order-of-magnitude” symbol. Thus, ψ can have the following asymptotic expansion:
where ψ0 = ψg and


By substituting Eq. (4) into Eq. (3) and Eq. (1b), and then collecting terms of the same order of ε, we obtain
Here, Eq. (5) gives a formal series of linearized equations for computing δψk consecutively from δψ1 to increasingly higher-order term in the expansion of ψ with the boundary conditions of δψk = 0 (on


2
2.2. Derivation of method-1
The equations in Eq. (5) can be combined with


Formally ψk is accurate up to O(εk) and so is

If ε is sufficiently small to ensure the convergence of the asymptotic expansion in Eq. (4), then ψk → ψ gives the solution of the NBE in the limit of k → ∞.
Substituting


For f = constant, Eq. (8a) recovers Eq. (5) of Bushby and Huckle (1956), but this recursive form of equation is derived here formally and systematically via the asymptotic expansion of the solution in Eq. (4). Substituting the dimensional form of ψk = ψk?1 + εkδψk, that is, ψk = ψk?1 + δψk into Eq. (8) gives
where N() is the nonlinear differential operator defined in Eq. (1a). Analytically, Eq. (9a) is identical to Eq. (8a) but expressed in an incremental form. Numerically, however, solving δψk from Eq. (9) and updating ψk?1 to ψk = ψk?1 + δψk iteratively does not give exactly the same solution as that obtained by solving ψk from Eq. (8) iteratively. According to our additional numerical experiments (not shown), the solutions obtained from Eq. (8) are less accurate (by about an order of magnitude for the case of Ro = 0.1) than their counterpart solutions obtained from Eq. (9), so the non-incremental form of boundary value problem in Eq. (8) will not be considered in this paper.
2
2.3. Derivation of method-2
The equation for ψk in Eq. (6.4) can be multiplied by 2 and rewritten aswhere ψk = ψk?1 + εkδψk = ψk?1 + O(εk) and


This leads to the following recursive form of equation that is accurate up to O(εk):
Substituting


The non-negative condition of (f + ζk)2 ≥ 0 requires Mk?1 ≥ 0 on the right-hand side of Eq. (12b). Also, as a quadratic equation of f + ζk for given ? and ψk?1, Eq. (12b) has two roots, but only the positive root, given by f + ζk = Mk?11/2, is physically acceptable (because f + ζk ≥ 0 is required for stably balanced flow). This leads to the following recursive form of equation and boundary condition for solving the NBE iteratively:
where Mk?1 ≥ 0 is ensured by setting Mk?1 = 0 when the computed Mk?1 from the previous step becomes negative. Here, Eq. (13a) gives essentially the same recursive form of equation as that in Eq. (8) of Shuman (1957) for solving the NBE iteratively, but this recursive form of equation is derived here via the asymptotic expansion of the solution in Eq. (4).
3.1. Criterion for optimal truncation
When the Rossby number is not sufficiently small to ensure the convergence of the asymptotic expansion, the optimal truncation of the asymptotic expansion of ψ in Eq. (4) can be determined (Boyd, 1999) by an empirical criterion in the following dimensional form:where N() is the function form defined in Eq. (1a), K is the number of optimal truncation, E[N(ψk)]


2
3.2. Iterative procedures
The iterative procedure for method-1 performs the following steps:1. Start from k = 0 and set ψ0 = ψg


2. Substitute ψk?1 (= ψ0 for k = 1) into N(ψk?1) to compute the right-hand-side of Eq. (9a), and then solve the boundary value problem in Eq. (9) for δψk.
3. Substitute ψk = ψk?1 + αδψk into ||N(ψk) ?


4. If k ≥ 2m, then find min||N(ψk′) ?

When the Poisson solver (or SOR scheme) is used to solve the boundary value problem in the above step 2, the iterative procedure designed for method-1 is named M1a (or M1b). For the Poisson solver used in this paper, the internally induced solution is obtained by using the scheme S2 described in section 2.1 of Cao and Xu (2011) and the externally induced solution obtained by using the Cauchy integral method described in section 4.1 of Cao and Xu (2011). For M1a with Ro < 0.4 (or Ro = 0.4), it is sufficient to set m = 1 and α = 1 (or 1/2). For M1b, it is sufficient to set m = 3 and α = 1.
The iterative procedure for method-2 performs the following steps:
1. Start from k = 0 and set ψ0 = ψg


2. Substitute ψk?1 into Mk?1 defined in Eq. (12b) to compute the right-hand-side of Eq. (13a), and then solve the boundary value problem in Eq. (13) for ψk.
3. Compute and save ||N(ψk) ?

4. Perform this step as described above for step 4 of method-1.
When the Poisson solver (or SOR scheme) is used to solve boundary value problem in the above step 2, the iterative procedure designed for method-2 is named M2a (or M2b). For M2a and M2b, it is sufficient to set m = 1 and α = 1.
2
3.3. Experiment design
To examine and compare the accuracies and computational efficiencies of the four iterative procedures, the true streamfunction field is formulated for a wavering jet flow byand the associated velocity components are given by
and
where U = 20 m s?1 is the maximum zonal speed of the wavering jet flow, y = ?0.25Lcos(πx′/L) is the longitudinal location (in y-coordinate) of the wavering jet axis as a function of x′ = x ? x0, and x0 is the zonal location of wave ridge. By setting the half-wavelength L to 2000, 1000 and 500 km, the flow fields formulated in Eqs. (15) and (16) resemble wavering westerly jet flows on the synoptic, sub-synoptic and meso-α scales, respectively (as often observed on northern-hemisphere mid-latitude 500 hPa weather maps).
Four sets of experiments are designed to test and compare the iterative procedures with ψt given in Eq. (15) over a square domain of D

The true geopotential field, ?, is obtained by solving the Poisson equation,


This error is 3.25×10?3 (or 4.33×10?3) for ? obtained by using the Poisson solver with L = 2000 (or 1000) km but increases to 5.58×10?3 (or 5.78×10?3) for ? obtained by using the SOR scheme. Thus, the solution obtained by using the Poisson solver is used as the input field of ? in the NBE to test the iterative procedures in each set of experiments.
4.1. Results from first set of experiments
For this set of experiments, ψt and (ut, vt) are plotted in Fig. 1a, ψg and (ug, vg)


 Figure1. (a) ψt plotted by color contours every 4.0 in the unit of 106 m2 s?1 and (ut, vt) plotted by black arrows over domain D


The relative error of ψk with respect to ψt can be denoted and defined by
where || || denotes the RMS of discretized field of the variable inside || || computed over all the grid points (including the boundary points) of domain D. The accuracy of the solution ψk obtained during the iterative process in each experiment can be evaluated by the RMS of ε(ψk), denoted and defined by
where || || is defined in Eq. (18). The accuracy to which the NBE is satisfied by ψk can be measured by E[N(ψk)] defined in Eq. (14).
Table 1 lists the values of E(ψk) and E[N(ψk)] for the initial guess ψ0 (= ψg) in row 1 and the optimally truncated solutions ψK from the four experiments in rows 2?5. As shown in row 2 versus row 1 of Table 1, M1a reaches the optimal truncation at k = K = 6 where E[N(ψk)] is reduced (from 0.120 at k = 0) to its minimum [= 2.411×10?3 < E(

| E(ψk) | E[N(ψk)] | k | |
| ψ0 | 2.43×10?2 | 0.120 | k = 0 |
| M1a | 4.87×10?4 | 2.41×10?3 | k = K = 6 |
| M1b | 1.68×10?3 | 1.81×10?2 | k = K = 38493 |
| M2a | 4.55×10?3 | 3.55×10?2 | k = K = 19 |
| M2b | 2.69×10?3 | 2.66×10?2 | k = K = 26 |
Table1. Values of E(ψk) and E[N(ψk)] listed in row 1 for the initial guess ψ0 (= ψg) with k = 0 and in rows 2?5 for ψK from the four iterative procedures in the first set of experiments (with Ro = 0.1). Here, E(ψk) is defined in Eq. (19), E[N(ψk)] is defined in Eq. (14), k is the iteration number, and ψK is the optimally truncated solution at k = K.
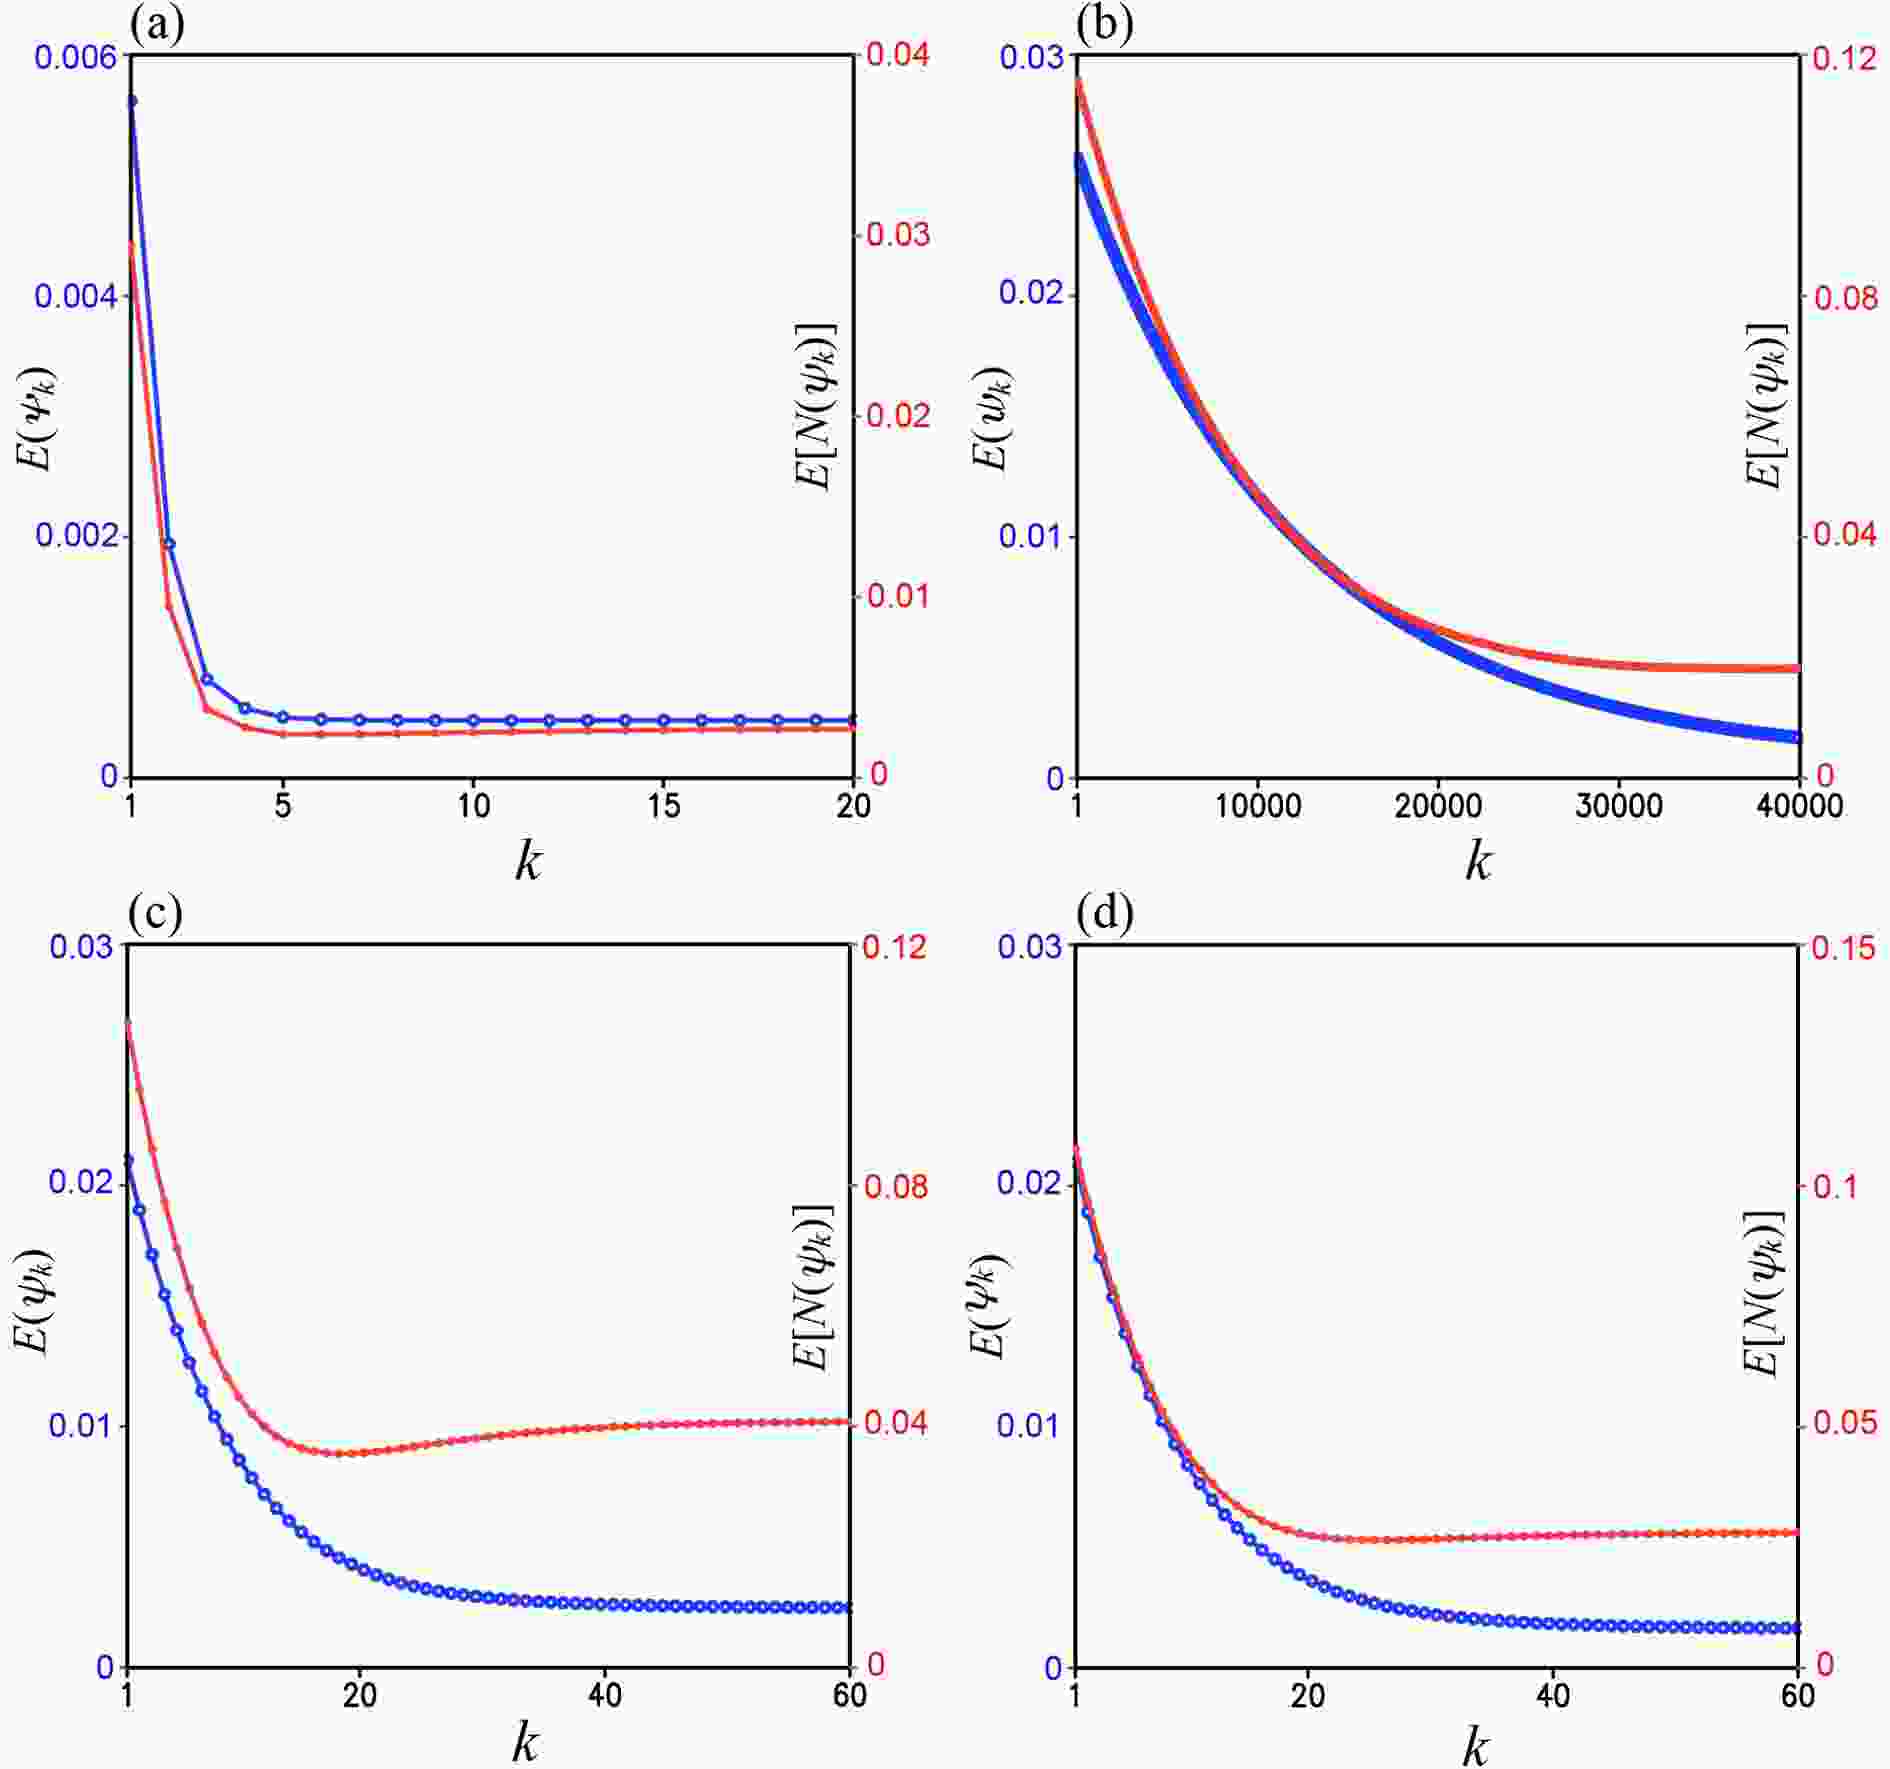 Figure2. (a) E[N(ψk)] and E(ψk) from M1a in the first set of experiments plotted by red and blue curves, respectively, as functions of k over the range of 1 ≤ k ≤ 20. (b) As in (a) but from M1b plotted over the range of 1 ≤ k ≤ 4×10⁴. (c) As in (a) but from M2a plotted over the range of 1 ≤ k ≤ 60. (d) As in (c) but from M2b. In each panel, the ordinate of E[N(ψk)] is on the left side labeled in red and the ordinate of E(ψk) is on the right side labeled in blue.
| E(ψk) | E[N(ψk)] | k | |
| ψ0 | 4.86×10?2 | 0.243 | k = 0 |
| M1a | 1.24×10?3 | 5.23×10?3 | k =K = 13 |
| M1b | 5.14×10?3 | 2.20×10?2 | k = K = 48057 |
| M2a | 6.31×10?3 | 4.17×10?2 | k = K = 26 |
| M2b | 3.96×10?3 | 2.94×10?2 | k = K = 35 |
Table2. As in Table 1 but for the second set of experiments (with Ro = 0.2).
| E(ψk) | E[N(ψk)] | k | |
| ψ0 | 9.72×10?2 | 0.57 | k = 0 |
| M1a | 8.20×10?2 | 0.13 | k = K = 2 |
| M1b | 8.31×10?2 | 0.15 | k = K = 10325 |
| M2a | 8.25×10?2 | 0.11 | k = K = 26 |
| M2b | 8.26×10?2 | 0.10 | k = K = 29 |
Table3. As in Table 1 but for the third set of experiments (with Ro = 0.4 and x0 = 0).
On the contrary, as shown in row 3 of Table 1 and Fig. 2b, M1b reaches the optimal truncation very slowly at k = K = 38493 where E[N(ψk)] is reduced to its global minimum (= 1.81×10?2) with E(ψk) reduced to 1.68×10?3. Here, E[N(ψk)] has three extremely shallow and small local minima (at k = 32408, 38490 and 38497) not visible in Fig. 2b. These local minima are detected and passed by setting m = 3 in Eq. (14) for M1b. Clearly M1b is less accurate and much less efficient than M1a.
Figure 2c (or 2d) shows that M2a (or M2b) reaches the optimal truncation at k = K = 19 (or 26) where E[N(ψk)] is reduced to its global minimum [= 3.55×10?2 (or 2.66×10?2)] with E(ψk) reduced to 4.55×10?3 (or 2.69×10?3), and E(ψk) decreases continuously toward its minimum [= 2.45×10?3 (or 1.62×10?3)] as k increases beyond K. Thus, M2a and M2b are less efficient and much less accurate than M1a for Ro = 0.1.
2
4.2. Results from second set of experiments
For this set of experiments, ψt and (ut, vt) have the same patterns as those in Fig. 1a, and ψg and (ug, vg) are similar to those in Fig. 1b, but the contour intervals of ψt and ψg are reduced by 50% as L is reduced from 2000 to 1000 km with Ro increased to 0.2, so the wavering jet flow is on the sub-synoptic scale. In this case, the nonlinearly balanced jet flow is still inertially stable over the entire domain since ζt > ?f everywhere as shown in Fig. 3a, but ζg < ?f/2 in the two small yellow colored areas as shown in Fig. 3b, so the NBE becomes hyperbolic locally in this small area and the boundary value problem in Eq. (1) is not fully well posed.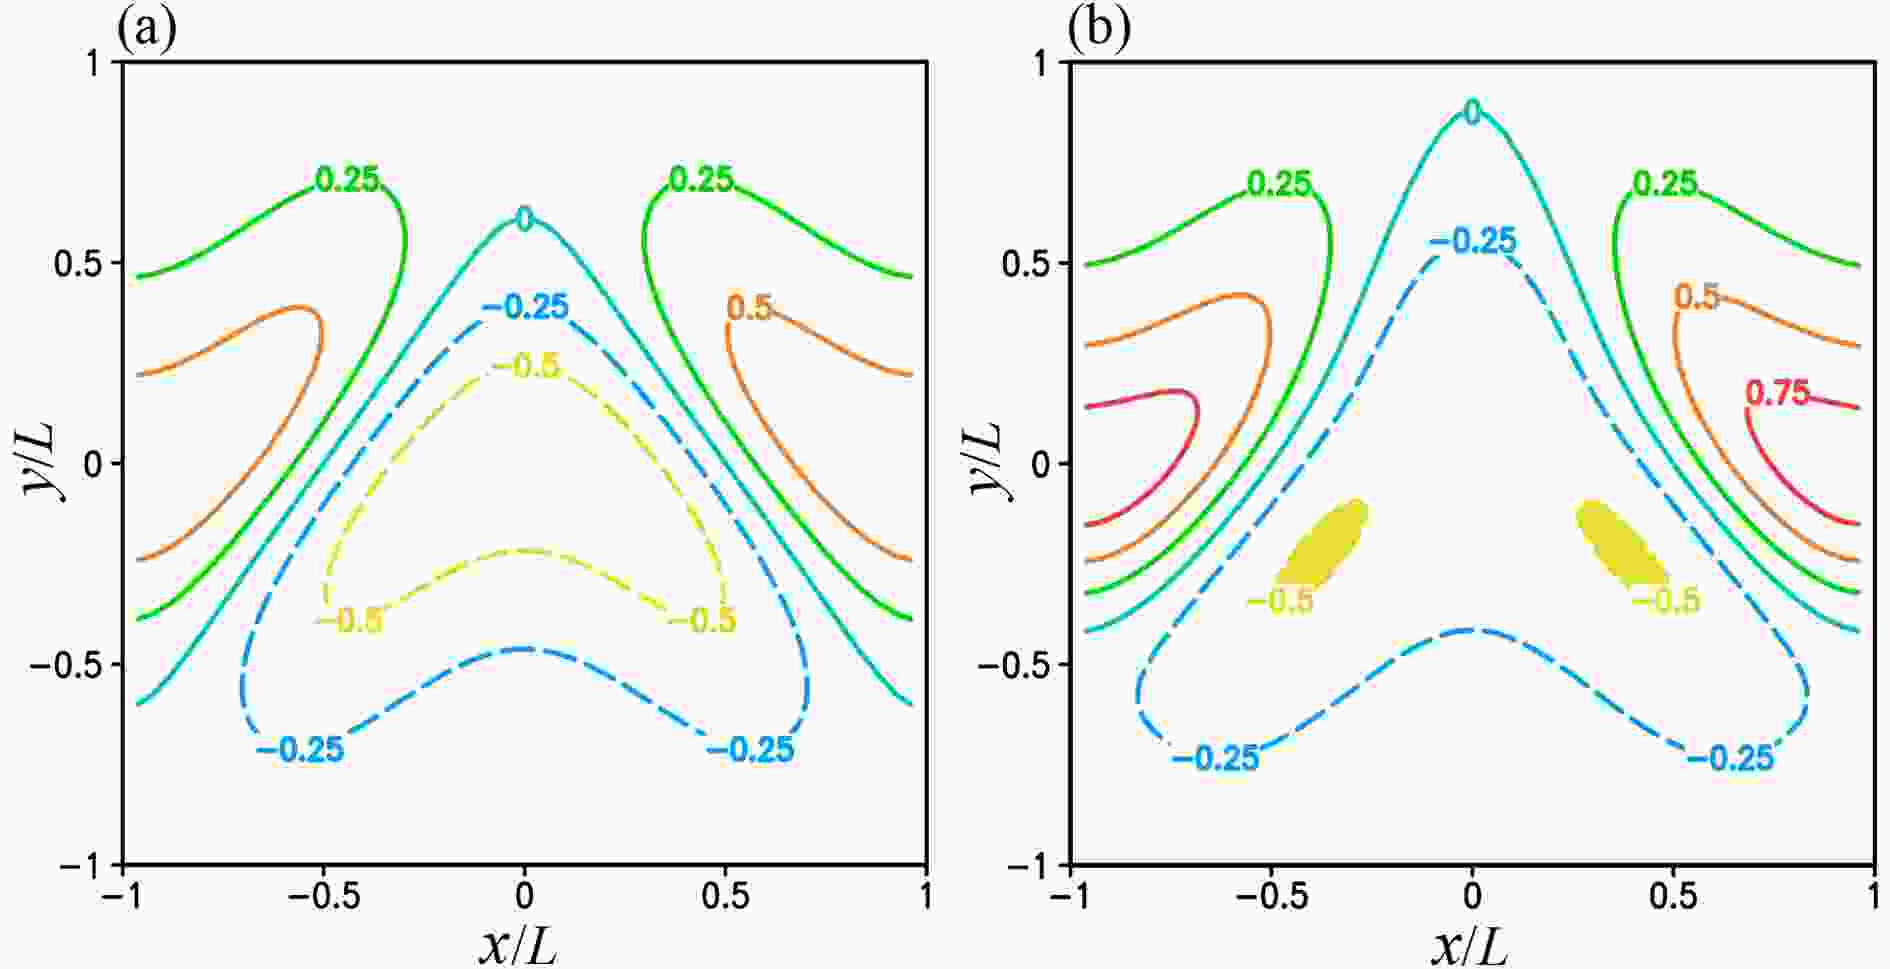 Figure3. (a) ζt plotted by color contours every 0.25 in the unit of 10?4 s?1 in domain D with L = 1000 km and Ro = 0.2 for the second set of experiments. (b) As in (a) but for ζg. As shown in (b), ζg < ?f/2 (= ?f0/2) in the two small yellow colored areas where the NBE becomes locally hyperbolic.
In this case, as shown in row 2 versus row 1 of Table 2, M1a reaches the optimal truncation at k = K = 13 where E[N(ψk)] is reduced (from 0.243 at k = 0) to its minimum [= 5.23×10?3 close to E(

As shown in row 3 of Table 2, M1b takes K = 48057 iterations to reach the optimal truncation and the values of E[N(ψk)] and E(ψk) at k = K are about four times larger than those from M1a. The extremely slow descending processes of E(ψk) and E[N(ψk)] (not shown) are similar to those in Fig. 2b for M1b in the first set of experiments. As shown in row 4 (or 5) of Table 2, M2a (or M2b) reaches the optimal truncation at k = K = 26 (or 35) and the values of E[N(ψK)] and E(ψK) are more than (or about) 4 times of those from M1a. Thus, M1a is still more accurate and much more efficient than M1b and is more efficient and much more accurate than M2a and M2b for Ro = 0.2, although the boundary value problem in Eq. (1) in this case is not fully (but nearly) well posed.
2
4.3. Results from third set of experiments
For this set of experiments, ψt and (ut, vt) have the same patterns as those in Fig. 1a but the contour interval of ψt is reduced 4 times as L is reduced from 2000 to 500 km with Ro increased to 0.4, so the wavering jet flow is on the meso-α scale. Figure 4a shows the fields of ψg and (ug, vg) for the nonlinearly balanced jet flow. This nonlinearly balanced jet flow is inertially unstable in the yellow colored area south of the ridge of wavering jet axis in the middle of domain D where ζt < ?f as shown in Fig. 4c. Figure 4d shows that ζg < ?f/2 in the long and broad yellow colored area along and around the wavering jet, so the NBE is hyperbolic in this area and the boundary value problem in Eq. (1) becomes seriously ill-posed.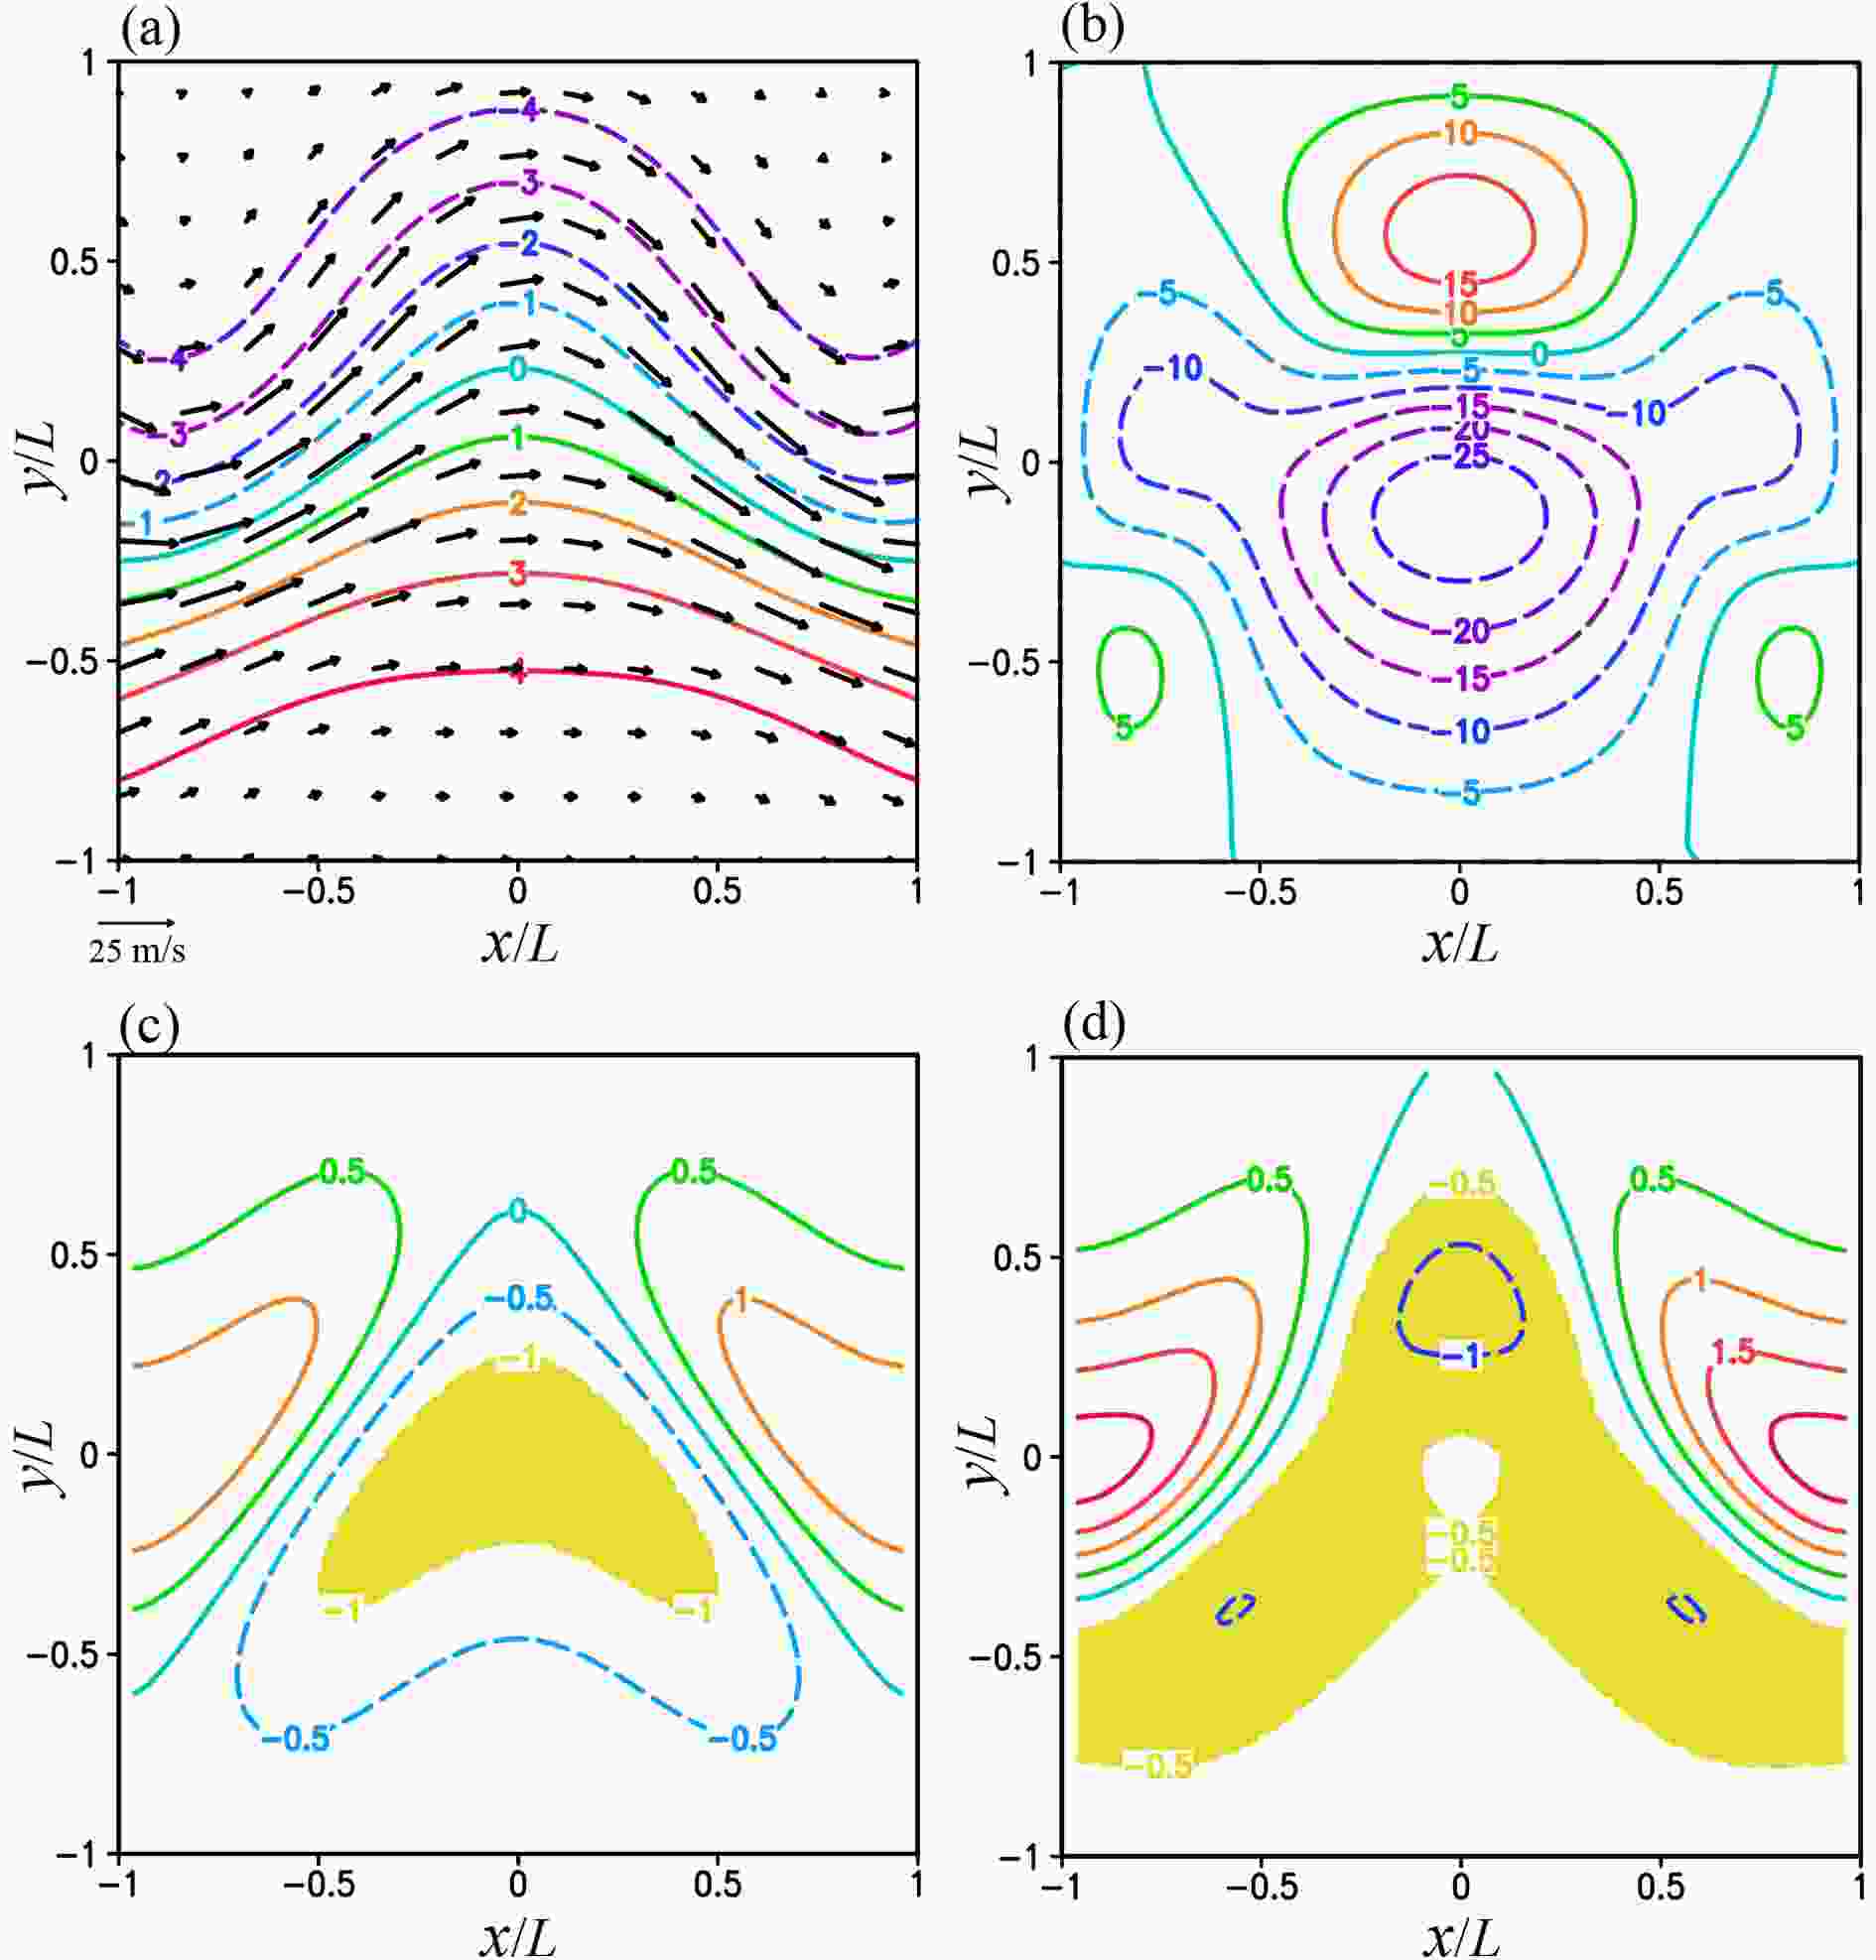 Figure4. (a) ψg plotted by color contours every 1.0 in the unit of 106 m2 s?1 and (ug, vg) plotted by black arrows over domain D with L = 500 km and Ro = 0.4 for the third set of experiments. (b) As in (a) but for ε(ψ0) = ε(ψg) plotted by color contours every 5.0 in the unit of 10?2. (c) As in (a) but for ζt plotted by color contours every 0.5 in the unit of 10?4 s?1 in domain D. (d) As in (c) but for ζg. As shown in (c), ζt < ?f in the yellow colored area south of the ridge of wavering jet axis where the jet flow becomes inertially unstable. As shown in (c), ζg < ?f/2 (= ?f0/2) in the long and broad yellow colored area (along and around the wavering jet) where the NBE becomes hyperbolic.
In this case, as shown in row 2 of Table 3 and Fig. 5a, M1a reaches the optimal truncation at k = K = 2 where E[N(ψk)] is decreased (from 0.57 at k = 0) to its minimum (= 0.13), while E(ψk) decreases from 9.72×10?2 at k = 0 to 8.20×10?2 at k = K = 2 and then to its minimum (= 7.38×10?2) at k = 6. As k increases beyond 6, M1a diverges. Its optimally truncated solution ψK is merely slightly more accurate than the initial guess ψ0. As shown in row 3 of Table 3 and Fig. 5b, M1b reaches the optimal truncation at k = K = 10325 where E[N(ψk)] is decreased to its global minimum (= 0.15), while E(ψk) decreases to 8.31×10?2 at k = K and then to its minimum (= 7.68×10?2) at k = 23515. Thus, M1b is still less accurate and much efficient than M1a.
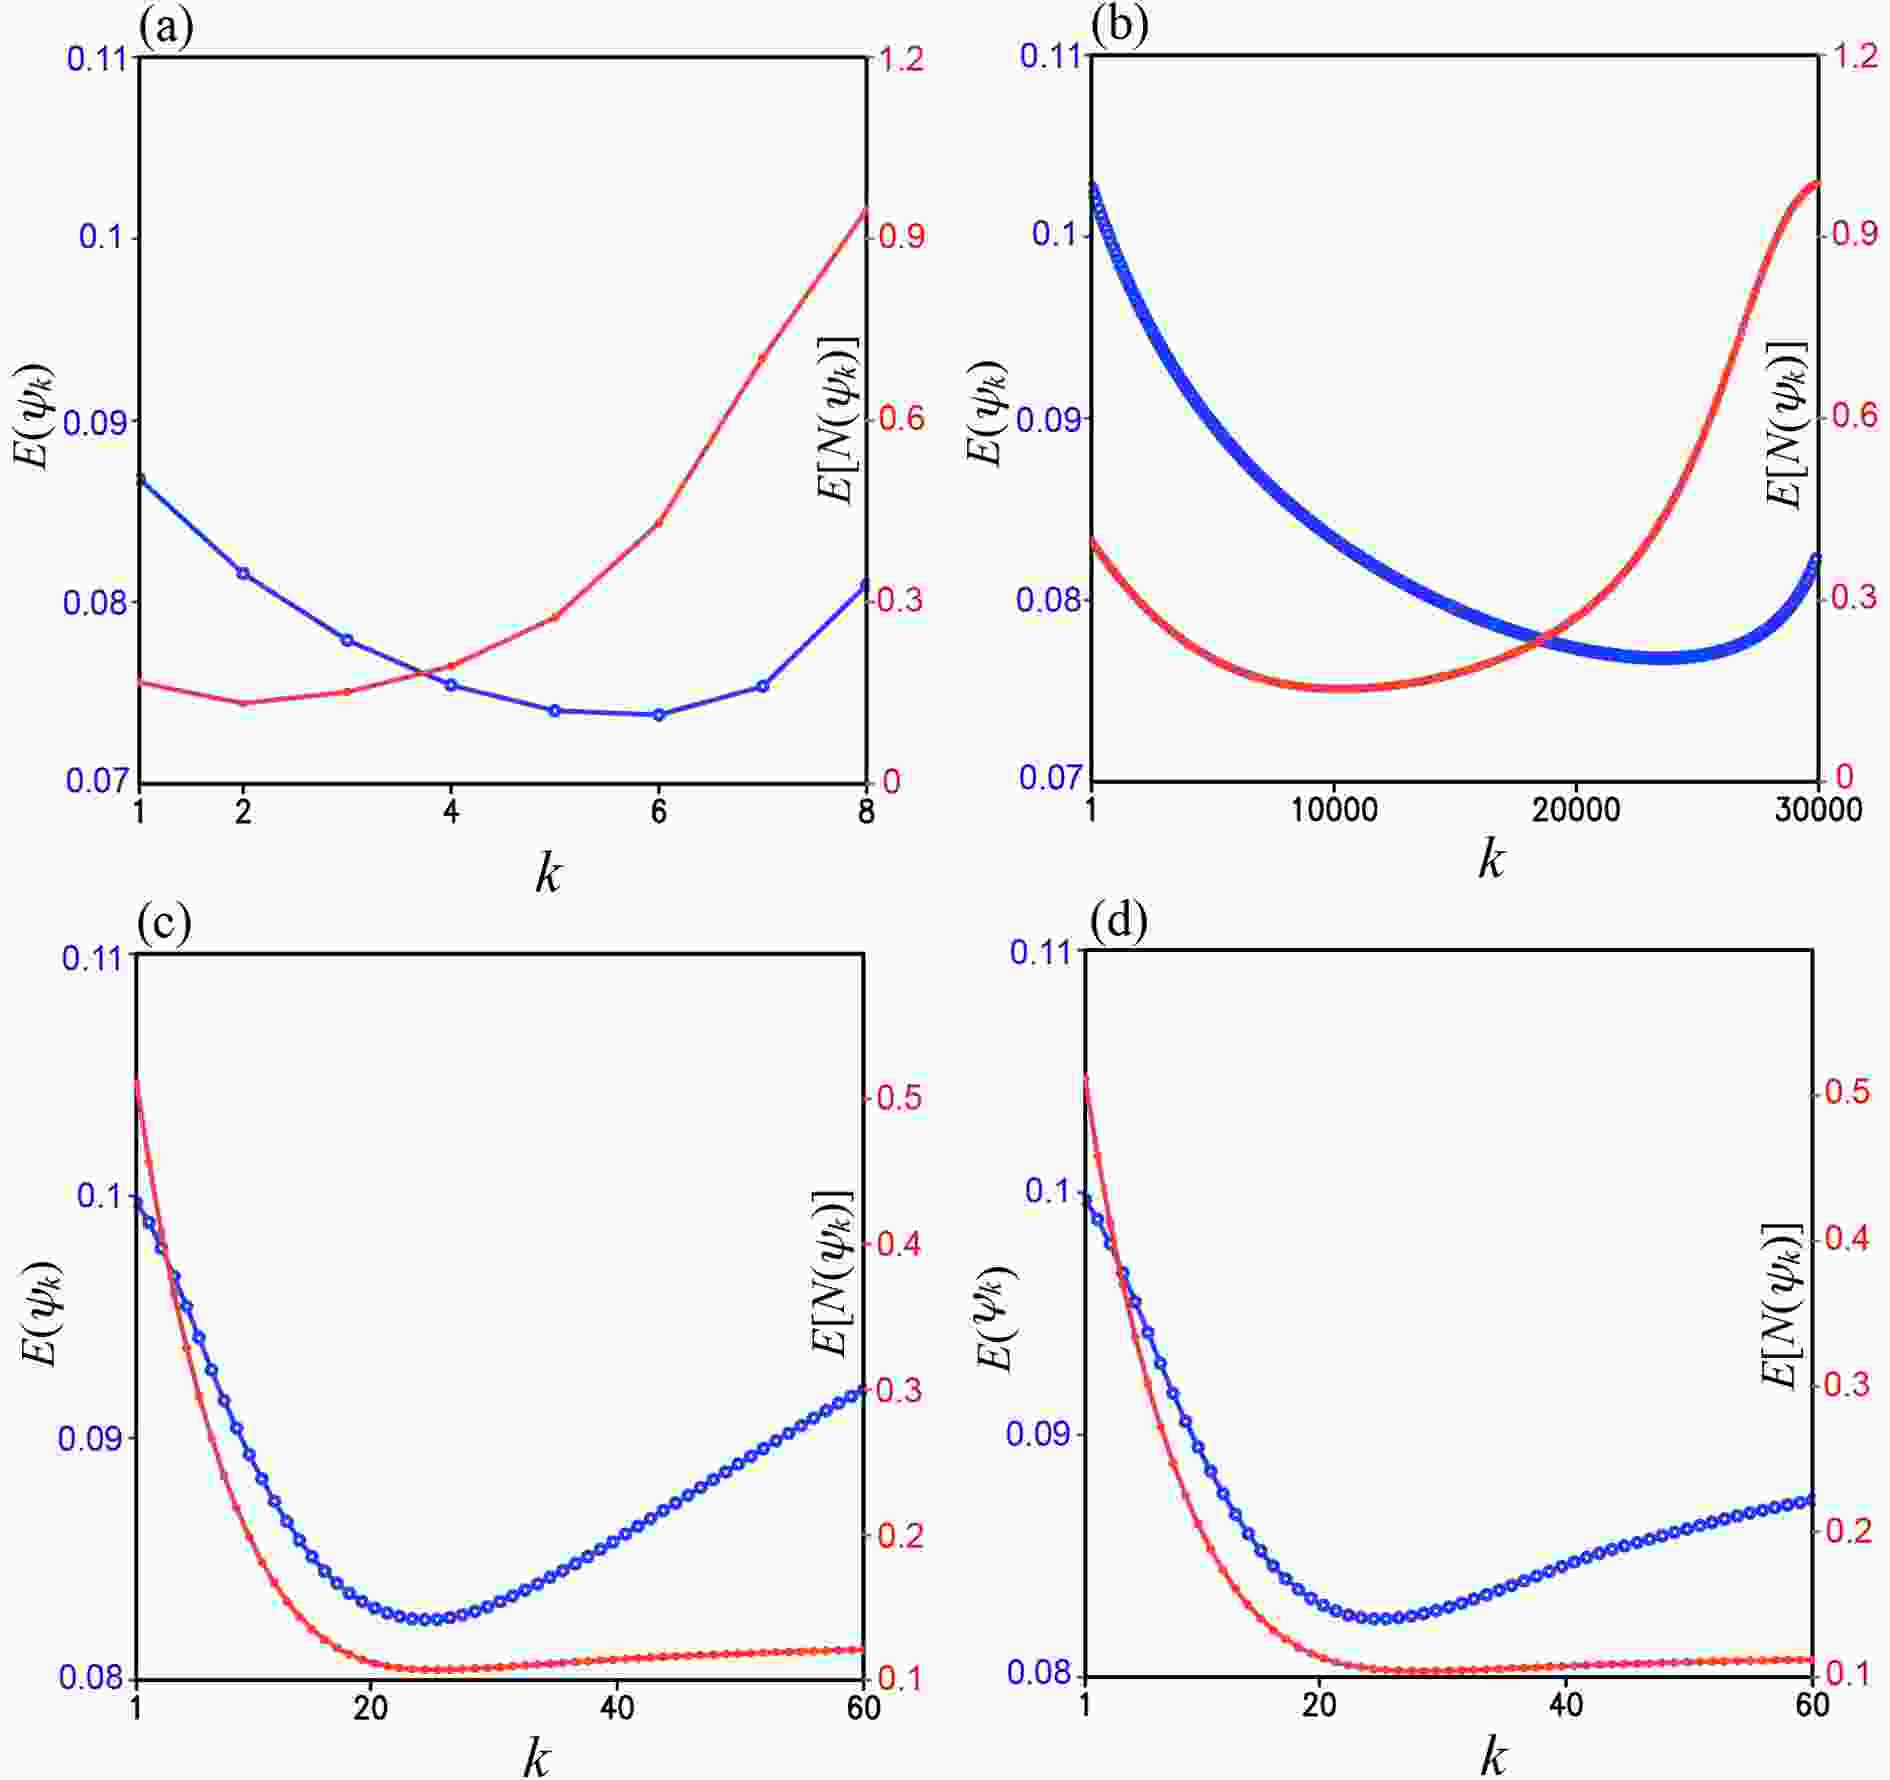 Figure5. (a) E[N(ψk)] and E(ψk) from M1a in the third set of experiments plotted by red and blue curves, respectively, as functions of k over the range of 1 ≤ k ≤ 8, (b) As in (a) but from M1b plotted over the range of 1 ≤ k ≤ 3×10⁴. (c) As in (a) but from M2a plotted over the range of 1 ≤ k ≤ 60. (d) As in (c) but from M2b. In each panel, the ordinates of E[N(ψk)] and E(ψk) are placed and labeled as in Fig. 2.
Figure 5c (or 5d) shows that M2a (or M2b) reaches the optimal truncation at k = K = 26 (or 29) where E[N(ψk)] is reduced to its minimum [= 0.11 (or 0.10)], while E(ψk) is reduced to its minimum [= 8.24×10?2 (or 8.24×10?2)] at k = 25 (or 26) and then increases slightly to 8.25×10?2 (or 8.26×10?2) at k = K = 26 (or 29). As shown in row 4 (or 5) versus row 2 of Table 3, E(ψK) from M2a (or M2b) is larger than that from M1a, so M2a (or M2b) is still less accurate than M1a in this case.
Figure 6a (or 6b) shows that ε(ψK) from M1a (or M1b) peaks positively and negatively in the middle of domain D as ε(ψ0) does in Fig. 4b but with slightly reduced amplitudes. Figure 6c (or 6d) shows that ε(ψK) from M2a (or M2b) has a broad negative peak south of the ridge of wavering jet axis similar to that of ε(ψ0) in Fig. 4b but with a slightly enhanced amplitude. In this case, M1a is still slightly more accurate than the other three iterative procedures, but it cannot effectively reduce the solution error in the central part of the domain where not only is NBE hyperbolic (with ζg < ?f/2 as shown in Fig. 4d), but also the jet flow is strongly anti-cyclonically curved and subject to inertial instability (with ζt < ?f as shown in Fig. 4c).
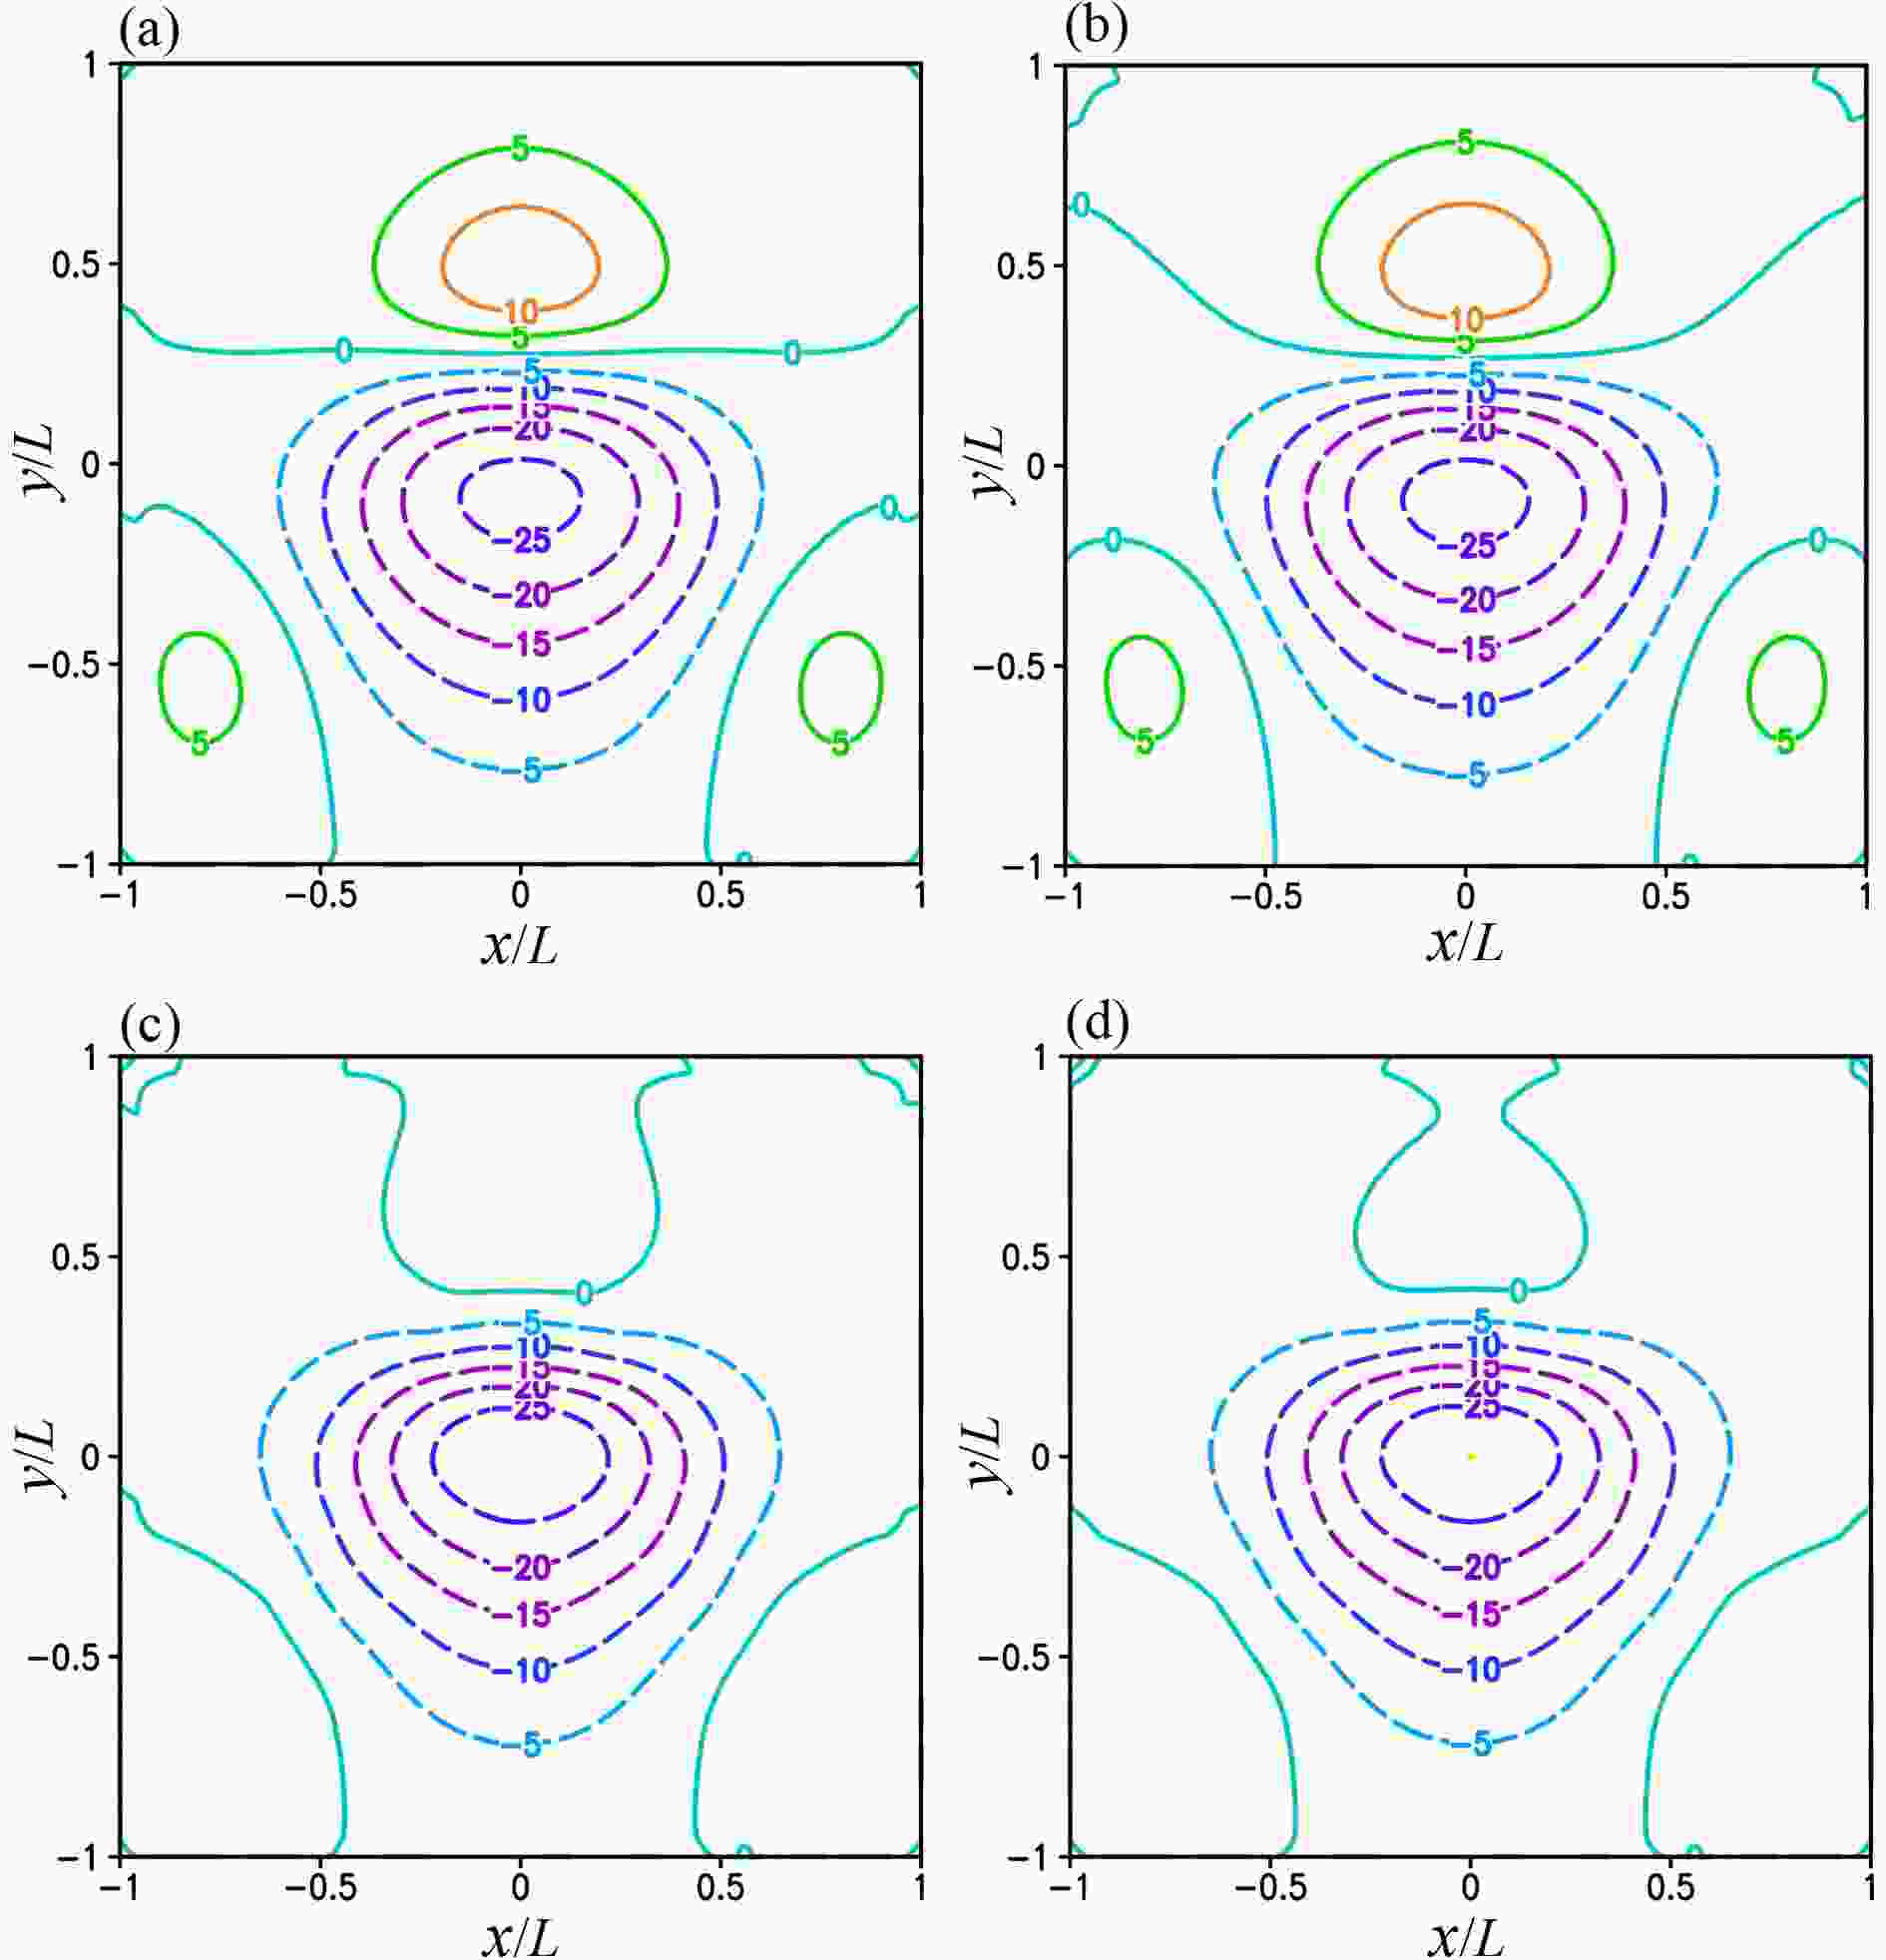 Figure6. ε(ψK) plotted by color contours every 0.5 in the unit of 10?2 for ψK from (a) M1a, (b) M1b, (c) M2a and (d) M2b in the third set of experiments.
2
4.4. Results from fourth set of experiments
For this set of experiments, ψt and (ut, vt) are plotted in Fig. 7a. These fields represent the same nonlinearly balanced wavering westerly jet flow as that in the third set of experiments except that the wave fields are shifted by a half-wavelength so the jet flow is curved cyclonically in the middle of domain D. In this case, ψg and (ug, vg) are nearly the same as the half-wavelength shifted fields (not shown) from Fig. 4a but with small differences, mainly along and around the trough and ridge lines due to the boundary condition, ?

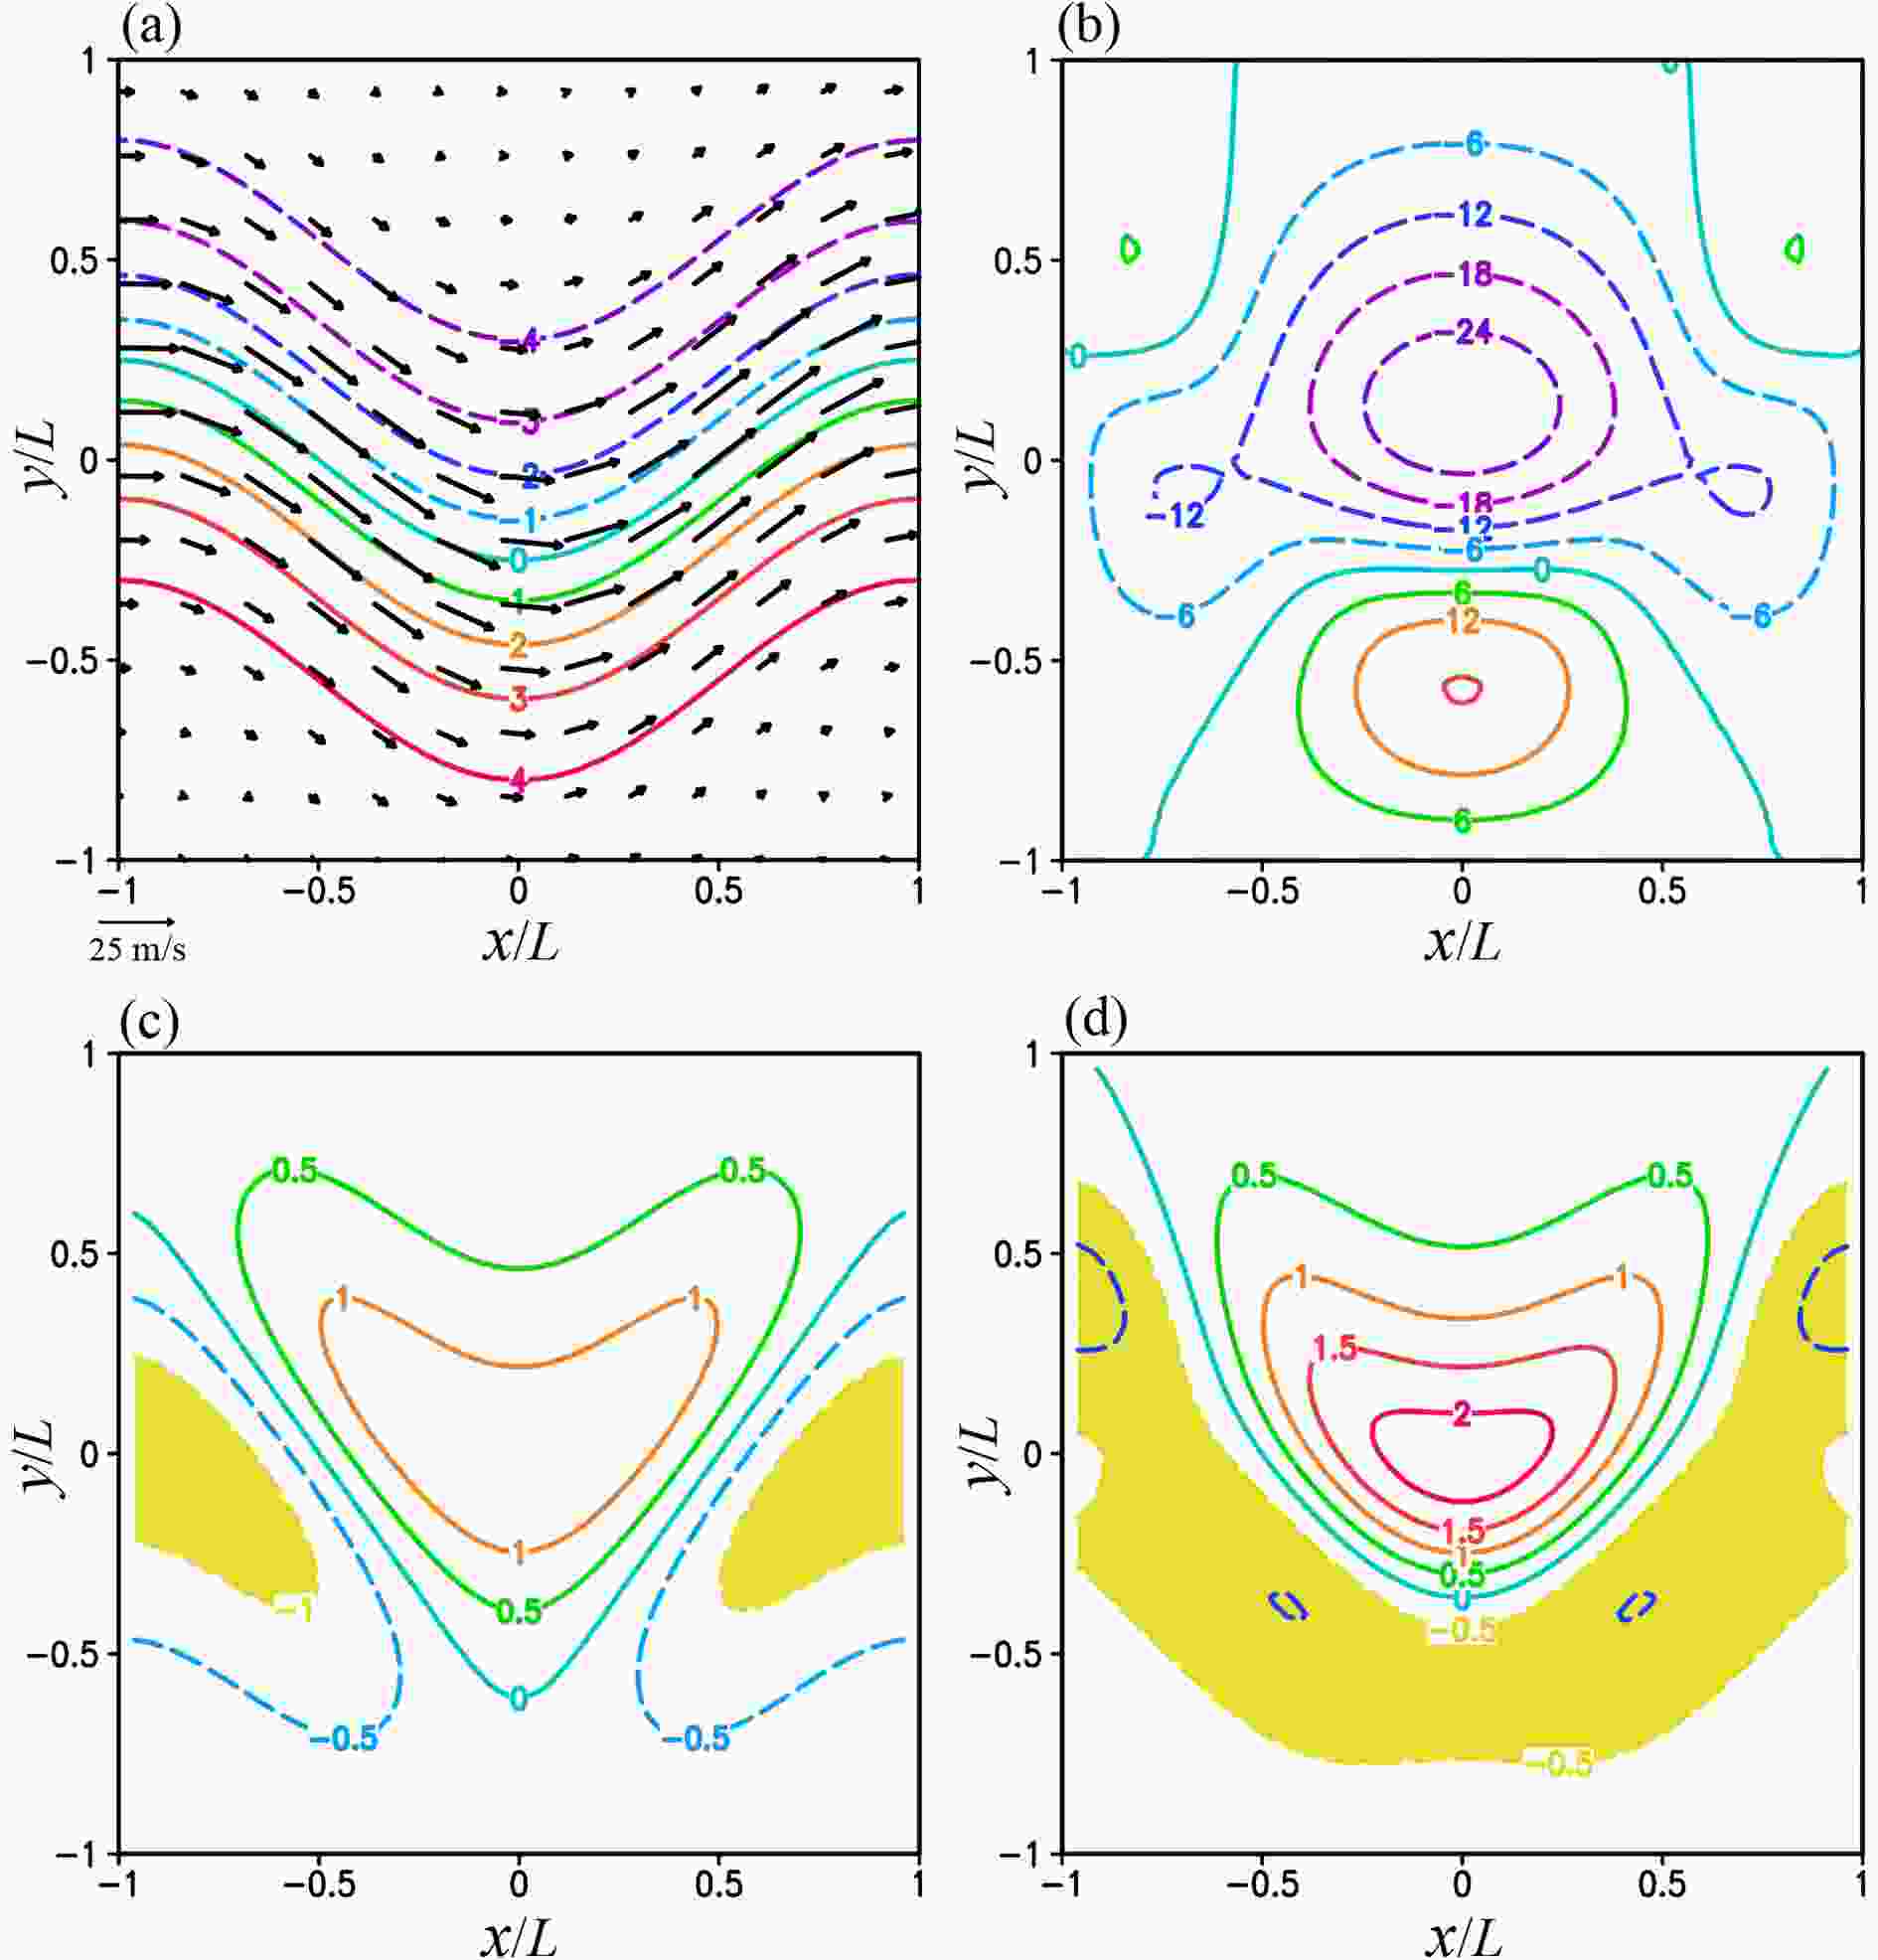 Figure7. (a) As in Fig. 4a but for ψt and (ut, vt) in the fourth set of experiments with L = 500 km and x0 = L (instead of x0 = 0). (b) As in (a) but for ε(ψ0) = ε(ψg) plotted by color contours every 6.0 in the unit of 10?2. (c) As in (a) but for ζt plotted by color contours every 0.5 in the unit of 10?4 s?1 in domain D. (d) As in (c) but for ζg.
In this case, as shown in row 2 of Table 4 and Fig. 8a, M1a reaches the optimal truncation at k = K = 7 where E[N(ψk)] is decreased (from 0.76 at k = 0) to its minimum (= 3.81×10?2), while E(ψk) decreases from 9.71×10?2 at k = 0 to 2.29×10?2 at k = K = 7 and then to its flat minimum (= 2.25×10?2) at k = 12, so ψK is significantly more accurate than ψ0 and slightly less accurate than ψk at k = 12 (which is undetectable in real-case applications). As shown in row 3 of Table 4 and Fig. 8b, M1b reaches the optimal truncation at k = K = 31830 where E[N(ψk)] is decreased to its global minimum (= 4.54×10?2), while E(ψk) decreases to 2.37×10?2 at k = K and then to its minimum (= 2.21×10?2) at k = 57 586. Thus, M1b is still much less efficient and less accurate than M1a.
| E(ψk) | E[N(ψk)] | k | |
| ψ0 | 9.71×10?2 | 0.76 | k = 0 |
| M1a | 2.29×10?2 | 3.81×10?2 | k = K = 7 |
| M1b | 2.37×10?2 | 4.54×10?2 | k=K= 31830 |
| M2a | 3.03×10?2 | 5.42×10?2 | k = K = 27 |
| M2b | 2.64×10?2 | 4.66×10?2 | k = K = 32 |
Table4. As in Table 1 but for the fourth set of experiments (with Ro = 0.4 and x0 = L).
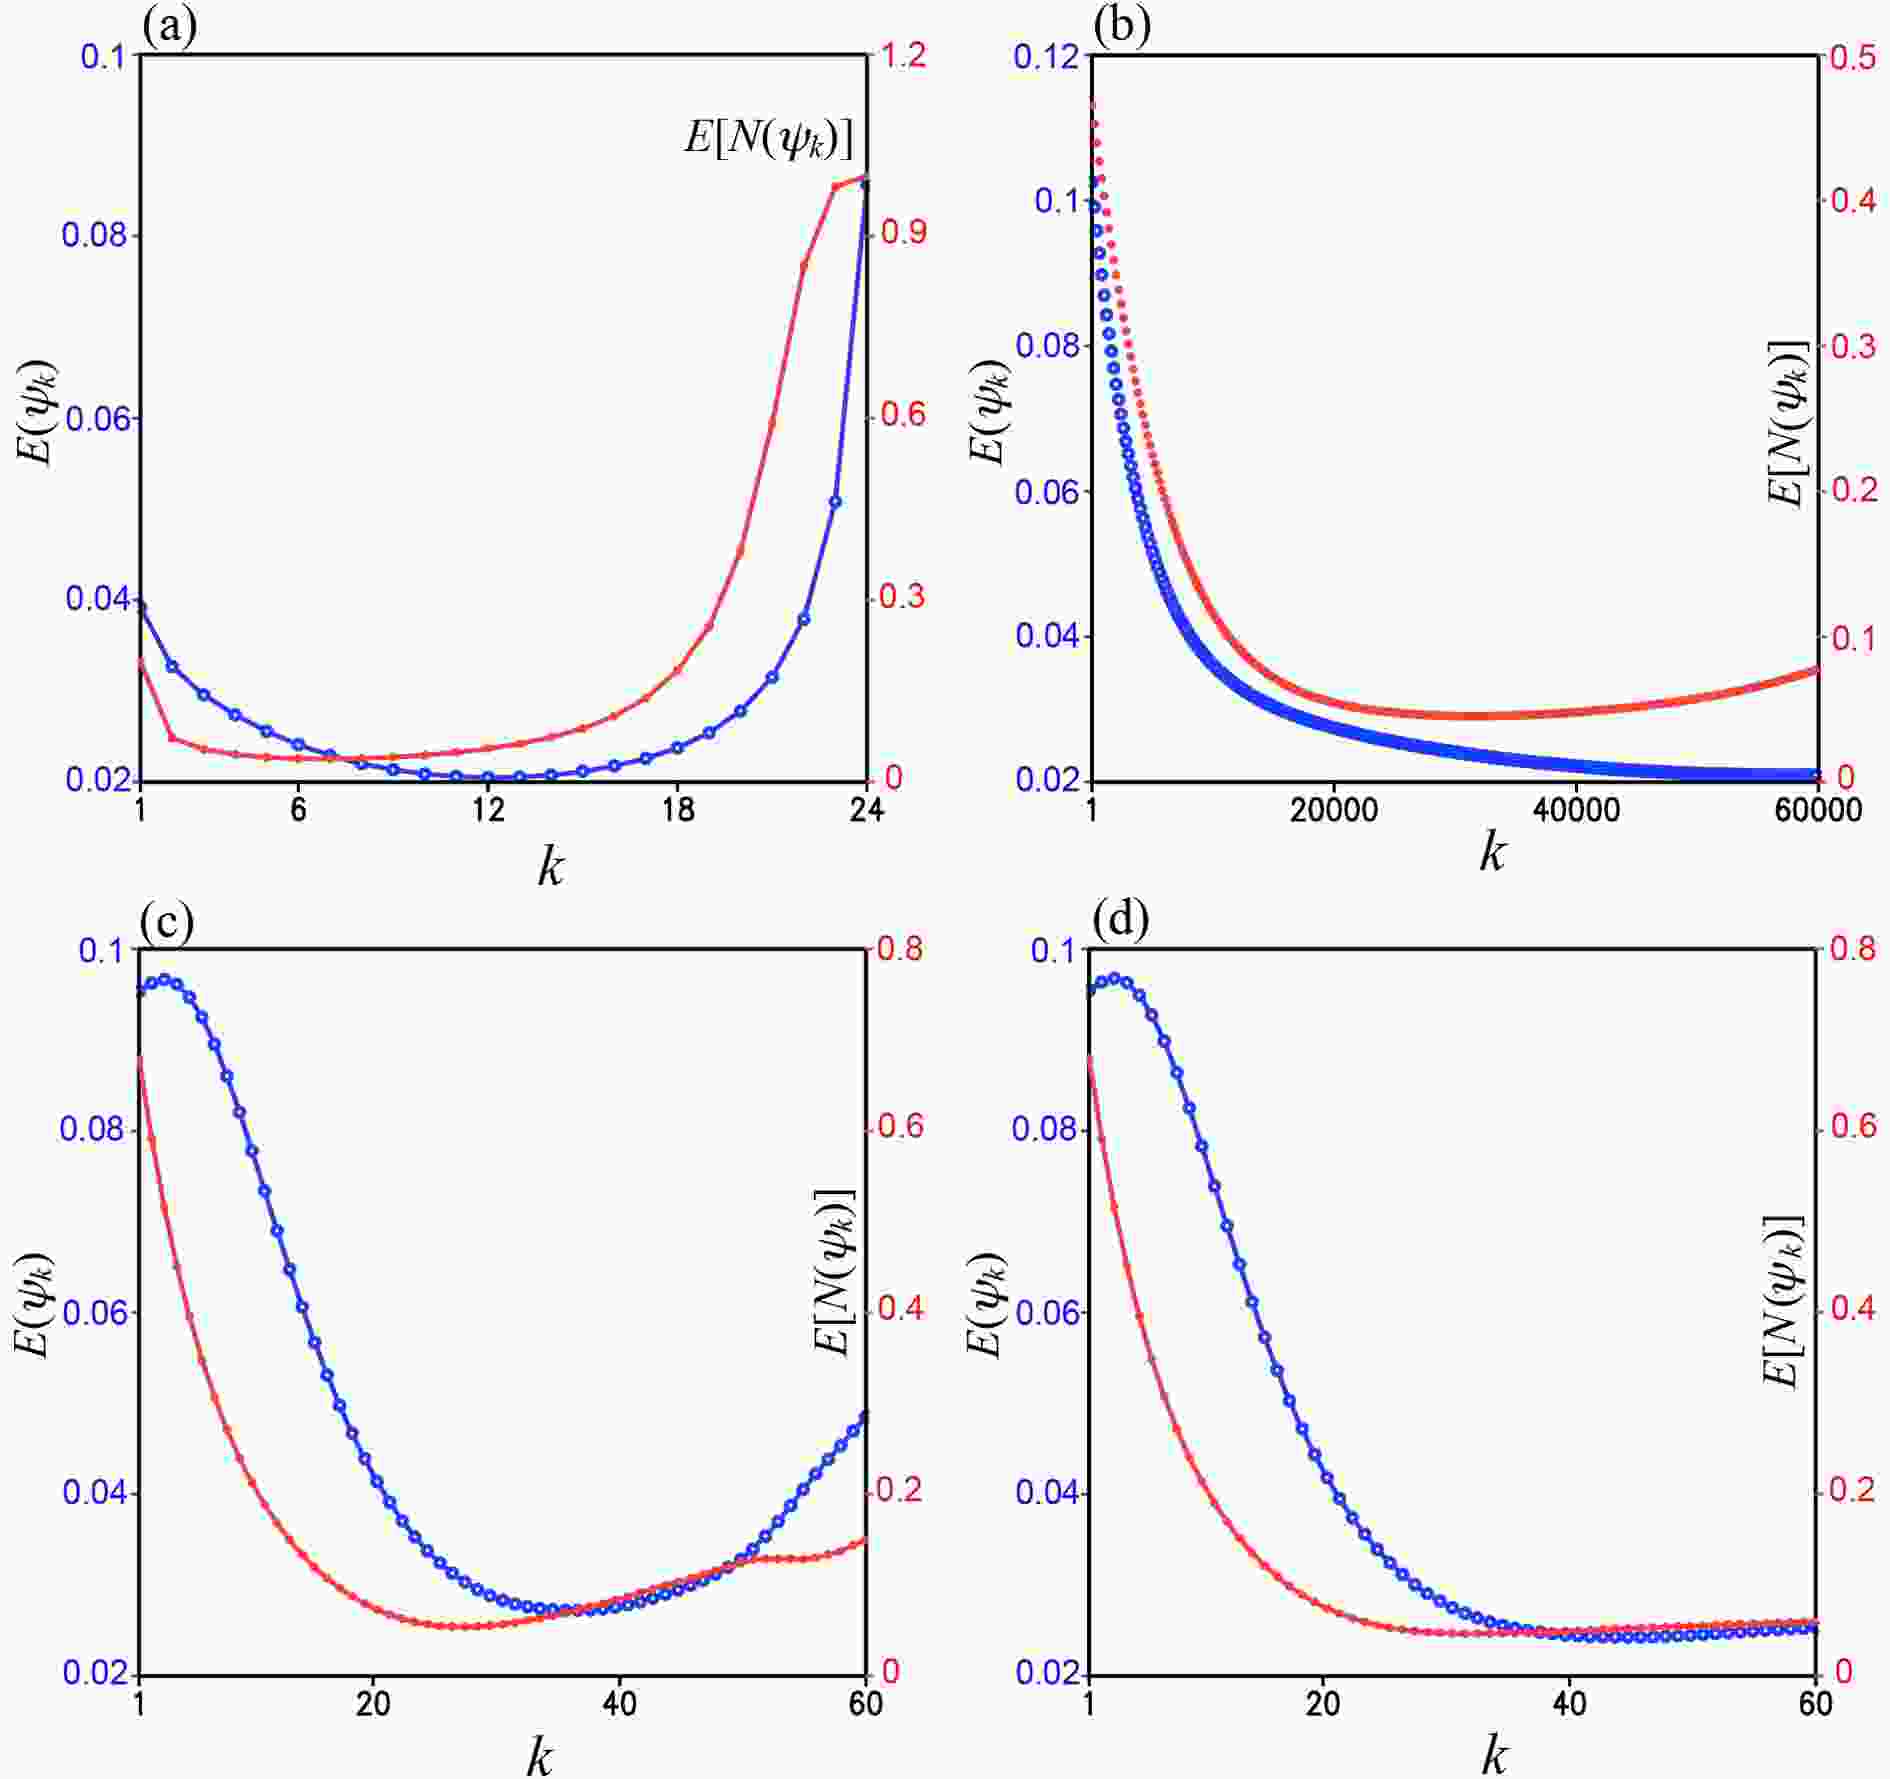 Figure8. (a) E[N(ψk)] and E(ψk) from M1a in the fourth set of experiments plotted by red and blue curves, respectively, as functions of k over the range of 1 ≤ k ≤ 24, (b) As in (a) but from M1b plotted over the range of 1 ≤ k ≤ 6×10⁴. (c) As in (a) but from M2a plotted over the range of 0 ≤ k ≤ 60. (d) As in (c) but from M2b. In each panel, the ordinates of E[N(ψk)] and E(ψk) are placed and labeled as in Fig. 2.
Figure 8c (or 8d) shows that M2a (or M2b) reaches the optimal truncation at k = K = 27 (or 32) where E[N(ψk)] is reduced to its minimum [= 5.42×10?2 (or 4.66×10?2)], E(ψk) reduces to 3.03×10?2 (or 2.64×10?2) at k = K and then to its minimum [= 2.72×10?2 (or 2.43×10?2)] at k = 36 (or 44), so M2a (or M2b) is still less efficient and less accurate than M1a in this case.
Figure 7b shows that ε(ψ0) has a broad positive (or negative) peak south (or north) of the trough of wavering jet axis in the middle of domain D. These broad peaks are mostly reduced by M1a as shown by ε(ψK) in Fig. 9a but slightly less reduced by M1b as shown in Fig. 9b and less reduced by M2a (or M2b) as shown in Fig. 9c (or 9d). However, the small secondary negative peak of ε(ψg) near the west or east boundary in Fig. 7b is reduced only about 30% by M1a (or M1b) as shown by ε(ψK) in Fig. 9a (or 9b) and even less reduced by M2a (or M2b) as shown in Fig. 9c (or 9d). Thus, all the four iterative procedures have difficulties in reducing the errors of their optimally truncated solutions near the west and east boundaries where not only is the NBE hyperbolic (with ζg < ?f/2 as shown in Fig. 7d), but also the jet flow is subject to inertial instability (with ζt < ?f as shown in Fig. 7c). Nevertheless, since the area of ζt < ?f is moved with the ridge of wavering jet axis to the domain boundaries in Fig. 7c, all of the four iterative procedures perform significantly better in this set of experiments than in the previous third set, as shown in Fig. 9 and Table 4 versus Fig. 6 and Table 3. In this case, M1a is still most accurate and M1b is still least efficient among the four iterative procedures.
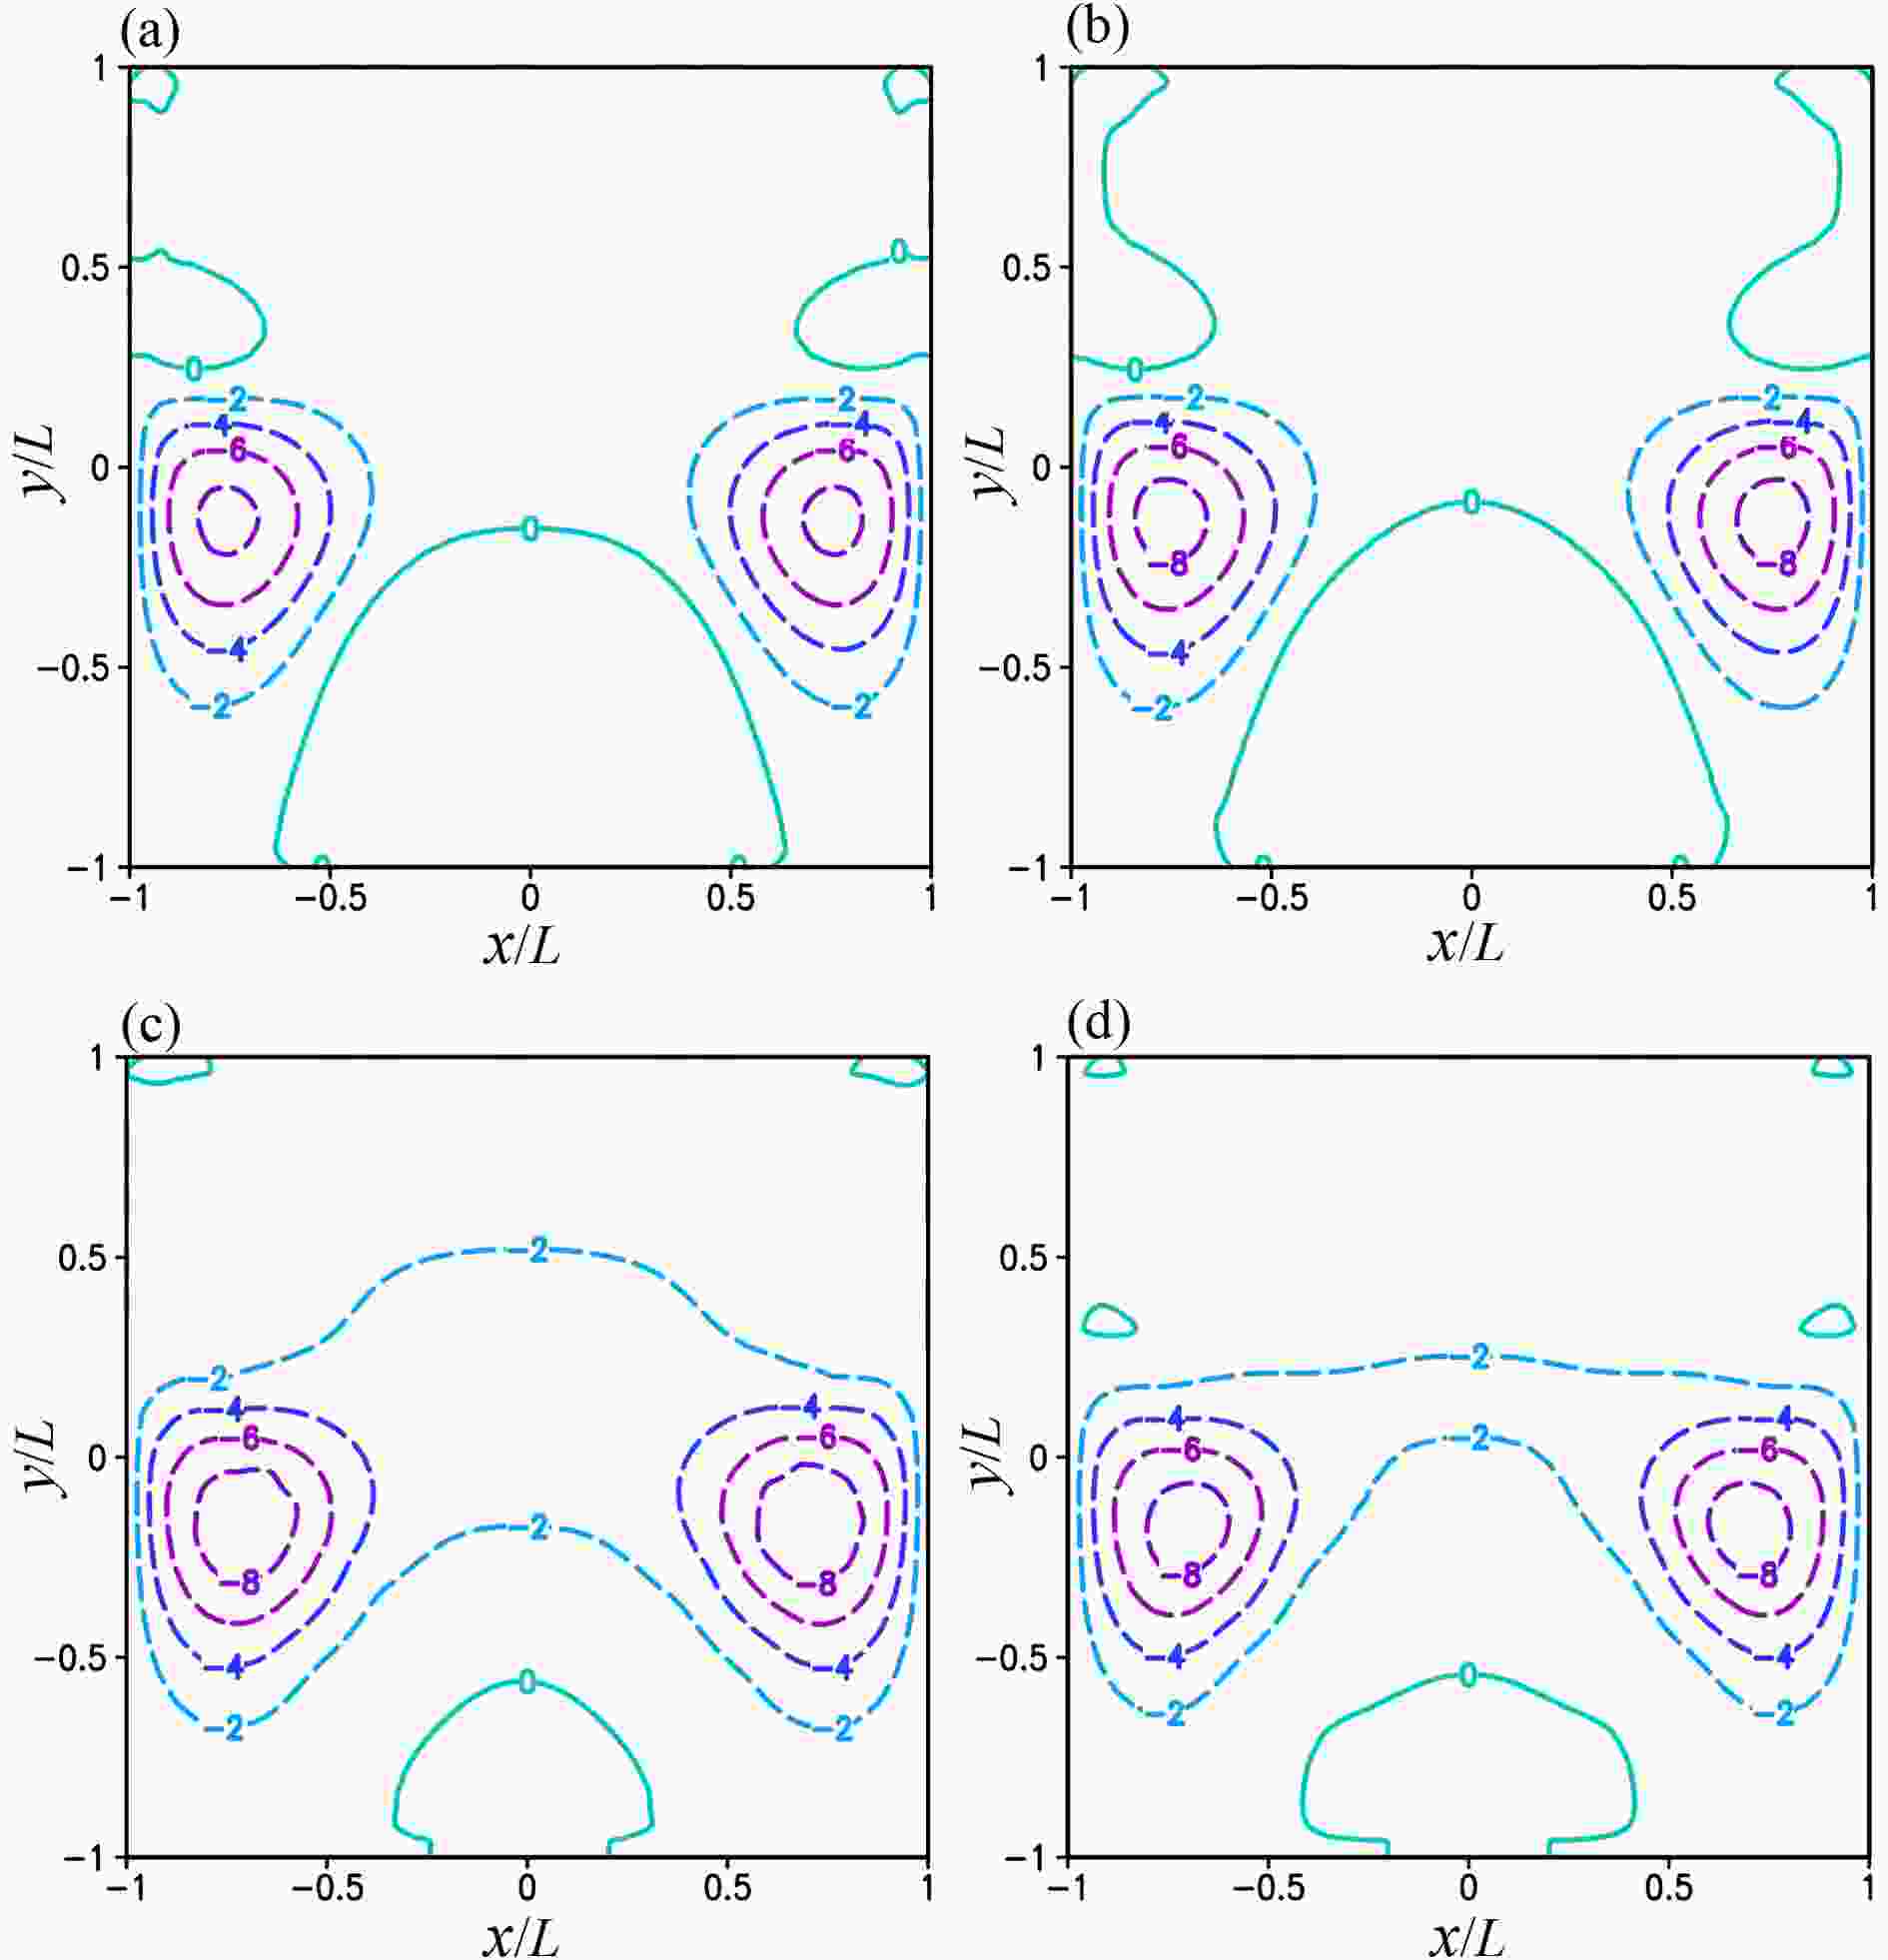 Figure9. ε(ψK) plotted by color contours every 2.0 in the unit of 10?2 for ψK from (a) M1a, (b) M1b, (c) M2a and (d) M2b in the fourth set of experiments.
Since the rearranged asymptotic expansion is not ensured to converge, especially when the Rossby number is not sufficiently small, a criterion for optimal truncation of asymptotic expansion is proposed [see Eq. (14)] to obtain the super-asymptotic approximation of the solution based on the heuristic theory of asymptotic analysis (Boyd, 1999). In addition, the Poisson solver based on the integral formulas (Cao and Xu, 2011; Xu et al., 2011) is used versus the SOR scheme to solve the boundary value problem in each iterative step.
The four iterative procedures are tested with analytically formulated wavering jet flows on different spatial scales in four sets of experiments. The computational domain covers one full wavelength and is centered at the ridge of the wavering jet in the first three sets of experiments but centered at the trough in the last set. In the first set of experiments, the wavering jet flow is formulated on the synoptic scale [with the half wavelength L = 2000 km and the associated Rossby number Ro = 0.1]. In this case, the NBE is of the elliptic type over the entire domain and therefore its boundary value problem is well posed. In the second set of experiments, the wavering jet flow is formulated on the sub-synoptic scale [with L = 1000 km and Ro = 0.2]. In this case, the NBE is of the elliptic type over nearly the entire domain so that its boundary value problem is nearly well posed. In the third (and fourth) sets of experiments, the wavering jet flow is formulated on the meso-α scale with Ro = 0.4, and the wavering jet flow is curved anti-cyclonically (or cyclonically) in the middle of the domain where the absolute vorticity is locally negative (or strongly positive). In this case, the NBE becomes hyperbolic broadly along and around the wavering jet so that its boundary value problem is seriously ill-posed.
The test results can be summarized as follows: For wavering jet flows on the synoptic and sub-synoptic scales, all four iterative procedures can reach their respective optimal truncations and the solution error (originally from the initial guess—the geostrophic streamfunction) can be reduced at the optimal truncation by an order of magnitude or nearly so even when the NBE is not entirely elliptic. Among the four iterative procedures, M1a is most accurate and efficient while M1b is least efficient. The results for wavering jet flows on the synoptic and sub-synoptic scales are insensitive to the location of the wavering jet in the computational domain. In particular, according to our additional experiments (not shown in this paper), when the wavering jet is shifted zonally by a half of wavelength (with the trough moved to the domain center), the solution errors become slightly smaller and the optimal truncation numbers for M1a and M1b (or M2a and M2b) become slightly smaller (or larger) than those listed in Tables 1 and 2. For wavering jet flows on the meso-α scale in which the NBE’s boundary value problem is seriously ill-posed, the four iterative procedures still can reach their respective optimal truncations with the solution error reduced effectively for cyclonically curved part of the wavering jet flow but not for the anti-cyclonically curved part. In this case, M1a is still most accurate and efficient while M1b is least efficient.
In comparison with M1b, the high accuracy and efficiency of M1a can be explained by the fact that the solution obtained by the Poisson solver based on the integral formulas is not only more accurate but also smoother than the solution obtained by the SOR scheme in each step of nonlinear iteration. Consequently, in each next step, the nonlinear differential term on the right-hand side of the incremental-form iteration equation [see Eq. (9a)] is computed more accurately in M1a than in M1b and so is the entire right-hand side. This is especially true and important when the entire right-hand side becomes very small (toward zero) in the late stage of iterations, as it also explains why M1b reaches the optimal truncation much slower than M1a (see Tables 1-4). In comparison with M2a and M2b, the high accuracy and efficiency of M1a can be explained by the fact that the solution in M1a is updated incrementally and the increment is small relative to the entire solution, and so is the error of the increment computed in each step of nonlinear iteration. On the other hand, the solution in M2a or M2b is updated entirely and the entire solution is large relative to the increment and so is the error of the entire solution computed in each step of nonlinear iteration. Moreover, the recursive form of equation [see Eq. (13)] used by M2a and M2b contains a square root term on its right-hand side, so it cannot be converted into an incremental form. Furthermore, this square root term must set to zero when the term inside the square root becomes negative, although the term inside the square root corresponds to the squared absolute vorticity. This problem is caused by the non-negative absolute vorticity assumed in the derivation of the recursive form of equation for M2a and M2b.
Cyclonically curved meso-α scale jet flows in the middle and upper troposphere are often precursors of severe weather especially when the curved jet flow evolves into a cut-off cyclone atop a meso-α scale low pressure system in the lower troposphere. In this case, M1a can be potentially and particularly useful for severe weather analyses in the context of semi-balanced dynamics (Xu, 1994; Xu and Cao, 2012). In addition, since the mass fields can be estimated from Advanced Microwave Sounding Unit (AMSU) observations, using the NBE to retrieve the horizontal winds in and around tropical cyclones (TC) from the estimated mass fields have potentially important applications for TC warnings and improving TC initial conditions in numerical predictions (Velden and Smith, 1983; Bessho et al, 2006). Applications of M1a in the aforementioned directions deserve continued studies. In particular, the gradient wind can be easily computed for the axisymmetric part of a cutoff cyclone (or TC) and used to improve the initial guess for the iterative procedure. This use of gradient wind can be somewhat similar to the use of gradient wind associated with the axisymmetric part of a hurricane to improve the basic-state potential vorticity (PV) construction for hurricane PV diagnoses (Wang and Zhang, 2003; Kieu and Zhang, 2010). Furthermore, either the gradient wind or the optimal truncated solution from M1a can be used as a new improved initial guess. In this case, the asymptotic expansion can be reformulated upon a new small parameter associated with the reduced error of the new initial guess and this new small parameter can be smaller or much smaller than the Rossby number used for the asymptotic expansion in this paper. The reformulated asymptotic expansion may be truncated to yield a more accurate “hyper-asymptotic” approximation of the solution according to the heuristic theory of asymptotic analysis (see section 5 of Boyd, 1999). This approach deserves further explorations.
Acknowledgements. The authors are thankful to Dr. Ming XUE for reviewing the original manuscript and to the anonymous reviewers for their constructive comments and suggestions. This work was supported by the NSF of China Grants 91937301 and 41675060, the National Key Scientific and Technological Infrastructure Project "EarthLab", and the ONR Grants N000141712375 and N000142012449 to the University of Oklahoma (OU). The numerical experiments were performed at the OU supercomputer Schooner. Funding was also provided to CIMMS by NOAA/Office of Oceanic and Atmospheric Research under NOAA-OU Cooperative Agreement #NA110AR4320072, U.S. Department of Commerce.
