

�й���ѧԺ��ѧ���Ͽ�ѧ���缼��ѧԺ, ���� 100049
ժҪ: �����װ��ĸ�����������������Ϊ�����ڽ���������廯ʮ���������泥�CTAB��˫���Ӳ㵼�µġ������ܶȷ������ۣ�DFT���о��������ڣ�100������110���ͣ�111��3�ֽ�����Ͽ��ܵ�����λ�㣬���������������CTAB˫���Ӳ�ģ�ͣ������÷��Ӷ���ѧģ�ⷽ���о�������������ཻ���Ų���˫���Ӳ�Ľṹ�����⣬����ѧ�����о��������CTAB�������Եĺ�����ɢ�����ڷ���������������������Ƚ϶��ԣ��ڣ�111�������ϵ�˫���Ӳ�ṹ�ĺ�����ɢ�ͷ��������������������㵥��CTA+����˫���Ӳ�����Ҫ���������������CTAB˫���Ӳ���ȶ��ԡ����������111�������CTAB˫���Ӳ���ȶ��������������ֽ�����ϵ�CTAB˫���Ӳ㡣��Ϊ������Ϊ��111�������ϵ�CTAB˫���Ӳ���Ų��ܶ���Խϵͣ�������������������ֱ����˫���Ӳ��и��ߵ���ɢ�Ժͽϵ͵��ȶ��ԡ�������ǽ��������������أ�111������������ԭ��
�ؼ���: CTAB˫���Ӳ�������������ܶȷ������۷��Ӷ���ѧģ��
Surfactants are commonly used in the synthesis[1-9], stabilization[4-5, 9-11], and crystallization[3-4, 10-13] of colloidal nanoparticles including gold nanorods. The adsorbed surfactant molecules can self-assemble on the surface of gold nanoparticles[4, 9-10, 14]. Such supported assemblies also play critical roles in increasing the dispersity and colloid stability of nanoparticles[5]. In addition, the surface assemblies tailor the surface properties and regulate the biocompatibility and toxicity of gold nanoparticles[5, 9, 12, 15]. For example, the surfactant cetyltrimethyl ammonium bromide (CTAB) is demanded for the synthesis of gold nanorods[7-8, 16-18]. The supported CTAB self-assemblies act as the protecting agent, and are involved in the formation of rod-like structure, serving as the structure-directing agent[8, 11, 16, 18-22]. Because of its unique optical properties, gold nanorods inspire a variety of biomedical applications including sensing and imaging[5, 11, 20-21, 23-24]. On the other hand, gold nanorods disturb the structure of cellular membrane and induce apoptosis[15, 25-26]. Many evidences suggest that surfactant CTAB molecules are highly related to the cytotoxicity of gold nanorods[15, 25-29].
In the light of the importance of supported CTAB assembly, there have been many experimental studies to characterize the structure of CTAB assembly. According to the results of small angle x-ray (SAXS), neutron scattering (SANS) and transmission election microsocope (TEM), the thickness of surfactant CTAB bilayer is around 3.0 to 3.9 nm[30-32]. On the other hand, the length of CTAB molecule is about 2.2 nm[30, 33]. An uncommon interdigitated bilayer structure was then proposed[30]. Much has been learned about the supported CTAB bilayer, while the molecular arrangement and the stability of CTAB bilayer still remain elusive. More importantly, the studies on the CTAB assemblies on various gold surfaces, i.e., (100), (110), and (111), are desired to understand their structure-directing role[34] and the cytotoxicity of gold nanorods. Meanwhile, there have been many attempts to replace CTAB molecules with alkanethiols[31] or phospholipids[29, 35] to achieve various functionalities and reduce toxicity. The comparison of the structure and dynamics properties as well as the stabilities of CTAB bilayers on different surfaces may be also helpful in understanding why such replacements tend to occur at the ends of nanorod, giving rise to a�?two-toneda�? nanorod[9] (i.e., the functional groups on the rod ends are then different from those on the rod sides). Besides, the gold nanorod exhibits the capacity to deliver hydrophobic drugs which are concentrated and sequestered within CTAB assembly[17, 26], and the corresponding mechanism is also associated with the molecular arrangement of CTAB molecules.
Molecular dynamics simulations have been widely used to investigate surfactants self-assembly under various conditions e.g., adsorbed on substrates[36] or formed at the air/water interface[37]. In this work we studied the structure and stability of CTAB bilayer on Au (100), Au (110), and Au (111) facets by means of density function theory (DFT) calculations and molecular dynamics (MD) simulation. As suggested in experiments of in situ X-ray diffraction and STM studies of bromide adsorption on noble metals, Br ions are chemisorbed on gold nanorods[38-39]. Accordingly, we performed DFT calculations to investigate the adsorption sites of Br ions, and constructed the corresponding CTAB bilayer. Then the structure and stability of the CTAB bilayers were studied by using MD simulation. CTAB bilayer exhibits a unique structure, wherein two layers interdigitate with each other[17]. The dynamical behavior of such interdigitated bilayer is distinct from the lipid bilayer. For example, the diffusion coefficient of CTAB molecule within outer layer is three orders of magnitude slower than normal bilayer. In addition, the stabilities of CTAB bilayers were estimated by calculating the energies of pulling a CTAB molecule from outer layer on various gold surfaces. The CTAB assembly on Au (111) surface is less stable than on the other two surfaces. The difference in binding stability of CTAB assemblies on various gold surfaces is related to the fitting of the packing of CTAB assemblies to the arrangement of binding sites on gold surface. Weaker binding stability of the assembly on Au (111) surface may be one reason for directive growth of gold nanorod, and the assembly is also vulnerable to the replacement with other molecules.
1 Systems and methods1.1 Density functional theory (DFT) calculationsWe performed DFT calculations using the Dmol3 package in Material Studio, version 4.4, employing the exchange-correlation functional local density approximation (LDA) with the PWC function. All calculations were carried out in spin-unrestricted fashion, which included the DFT-based relative semi-core pseudo-potential (DSPP). The electronic wave functions were expanded in a double numerical plus polarization basis set (DNP) truncated at a real space cut-off of 4.8?. 3?-3?-1 k-points samplings in Brillouin zone were used. Fully relaxed structures were obtained by optimizing all atomic positions until energy minimized. The tolerances of energy, gradient, and displacement convergences were less than 2?-10-5 Ha, 0.002 Ha/?, and 0.005?, respectively.
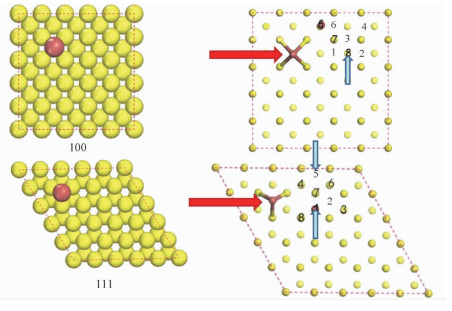
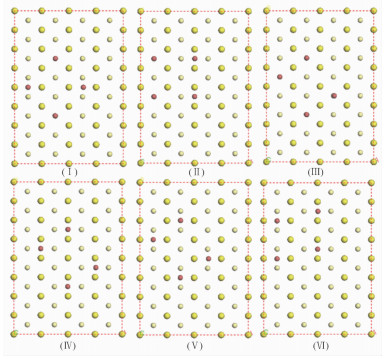
We constructed the slabs consisting of 5?-5?-3, 5?-5?-3, and 4?-8?-4 closely packed Au atoms to model the Au (100), Au (110), and Au (111) surfaces, respectively (see Fig. 1). The distance between repeated slabs is 2.5 nm. For convenience of the discussion of probable adsorption sites of Br ions, the sites on the top of gold atom, on the bridge site of adjacent gold atoms, and on the center of unit cell of Au (100) and Au (111) facets were denoted as the atop, bridge, and hollow sites, respectively (Fig. 1(c), 1(f)). In the case of Au (110) facets, there are two kinds of bridge sites, i.e., the bridge sites across or adjacent to the neighbor Au atoms (Fig. 1(i)). Br ion was put on these sites separately, and the resulting energies (see Table 1) were compared to investigate the most stable adsorption site of Br ion.
Fig. 1
 | Download: JPG larger image |
Fig. 1 Illustrations of putative adsorption sites of Br ion on gold facets | |
Table 1
| Table 1 Computed adsorption energies of single Br ions on gold facets a | |||||||||||||||||||||||||||||||||||||||
Once the most stable adsorption site of single Br ion was determined, another DFT calculation was performed to search the stable adsorption site of the secondary Br ion.
1.2 Molecular dynamics (MD) simulationsThe stability of CTAB bilayer on gold surfaces was subsequently studied by means of MD simulation. The sizes of Au (100), Au (110), and Au (111) substrates are 6.525 nm?-6.525 nm?-1.020 nm, 6.117 nm?-6.922 nm?-0.721 nm, and 7.210 nm?-6.494 nm?-1.177 nm, respectively. According to the DFT calculation results, there are 128, 130, and 120 adsorption sites of Br ion on these gold surfaces. The Br ions adsorbed on the gold surfaces were restrained in the MD simulation to mimic chemisorption. The constructed CTAB bilayers adsorbed on gold surfaces were solvated in TIP3P water boxes of 6.525 nm?-6.525 nm?-11.34 nm, 6.117 nm?-6.922 nm?-11.85 nm, and 7.21 nm?-6.494 nm?-11.70 nm size, respectively. Then the sodium bromide was added to neutralize the system and yielded the ionic strength of 0.65 M. Three initial configurations of CTAB bilayer on Au (100) surface with different overlapping extents were first considered, i.e., sys1, sys2, and sys3 (Fig.S1). The width of the overlapping region was 1.4 (sys1), 0.9 (sys2), and 0.4 nm (sys3), respectively. For each system, a 2-ns MD simulation was carried out after energy minimization, and the final structure was used to decide which system should be chosen in further investigation. We found that only the CTAB bilayer with the overlapping region of 1.4 nm (sys1) maintained its structure during the simulation. Secondly, The CTAB bilayers on the other gold surfaces were also constructed with similar overlapping. We examined the structure of CTAB bilayer with 1.4 nm overlap on Au (100), Au (110), and Au (111) surfaces after 5-ns simulation in NVT ensemble at 298 K for equilibration. Eventually, a 150-ns simulation was carried out using NPT ensemble at 298 K temperature and 1 bar pressure and the last 60-ns trajectories were used for analysis.
The Lennard-Jones parameters of Au and Br atoms are r0, Au=2.951?, ?��Au=5.29 kcal/mol[36, 40-42], r0, Br=5.190?, and ?��Br=0.09 kcal/mol[43-45], and the parameters of CTA+ molecule were adapted from CHARMM22 force field[46-47]. Period boundary conditions were applied in three directions. Particle Mesh Ewald (PME) method[48] was used to treat electrostatic interaction. A spherical cutoff of van der Waals interactions was at 1.2 nm. A time step of 2 fs was adopted, and the data were collected every 1 ps. All the MD systems were performed on the NAMD 2.8 package and then analyzed by VMD[49-50].
2 Results and discussion2.1 Adsorption of Br ion on gold facetsThe computed adsorption energies of single Br on various sites of gold facets are presented in Table 1. The stability of adsorption on hollow site is superior to bridge site and atop site on Au (100) and Au (111) facets. On Au (110) facet, the stability of adsorption on bridge site adjacent to neighbor Au atoms is superior to the others. Subsequently, we investigated the adsorption sites of secondary Br ion on Au (100) and Au (111) facets by means of DFT calculations (see Fig.S2), and calculated the adsorption energies (in Table S1). For each of the two facets, the hollow site is the most stable adsorption site. Accordingly, the unit cell of adsorbed Br was constructed (see Fig. 2). The parameters of the unit cell on Au (100) are a=b=5.768?, and the area is 33.270?2. The parameters on Au (111) are a=4.995? and b=7.258?, and the area is 36.014?2. Both unit cells are slightly larger than the CTAB head group with the size of 32 A2[36]. As for the case of Au (110), we investigated six possible unit cells of adsorbed Br ions (see Fig. S3), and calculated the adsorption energies (in Table S2). The parameters of proper unit cell we selected are a=4.995? and b=7.064?, and the area is 35.283 ?2, also slightly larger than the CTAB head group. In summary, the packing densities for CTAB bilayer on Au (100), Au (110), and Au (111) surfaces are 3.01, 2.83, and 2.78 number/nm3, respectively, which is in line with the experimental observations that there is a closely packed CTAB bilayer on gold surfaces. Hence, we were able to construct reasonable MD simulation models of CTAB bilayer adsorbed on gold nanorod surfaces.
Fig. 2
 | Download: JPG larger image |
The outer layer of bilayer was colored in blue and the inner layer was colored in green. The Br and Na ions in solution were shown in pink and light yellow. Fig. 2 Proposed arrangements of adsorbed Br ions on gold facets (a, b, c), and snapshots of CTAB bilayer on gold surfaces at the equilibrium points (d, e, f) | |
2.2 Z-axis distributions of CTAB bilayerThe structures of constructed CTAB bilayers were then relaxed by subsequent MD simulation. The distance between nitrogen of CTAB in the outer layer and the gold surface was calculated. In the cases of Au (111) and Au (110), the distance quickly changed from 2.96 to 2.88 nm (Au (111)) and from 2.84 to 2.90 nm (Au (110)) within 5 ns (see Fig. S4). While the structural relaxation is relatively slow on Au (100), the distance progressively decreased from 3.09 to 3.02 nm till t=50 ns (see Fig. S4). The configurations of CTAB bilayers after equilibrium are shown in Fig. 2.
Subsequently, we characterized the structure of equilibrated CTAB bilayers on three gold surfaces by calculating the density distributions of nitrogen of CTA+ in outer layer, Br ion, and water (see Fig. 3).
Fig. 3
 | Download: JPG larger image |
Number density profiles of N of CTA+ and Br- and normalized water density profiles Fig. 3 Normalized water density ??(z)/??0, where ??0 is bulk water density. | |
In the case of Au (100) surface (see Fig. 3(a)), there are four palpable peaks along the distribution density function curve for the head groupsa�? nitrogen atoms. The positions of the peaks are at z=2.65, 2.91, 3.15, and 3.4 nm. The gap spacings between adjacent peaks are almost the same, i.e., ?��z=0.25 nm, which is roughly equal to the spacing between carbon atoms which are bonded to the common third carbon atom in the extended alkane chain. Hence, the outer layer consists of four sub-layers, denoted as SL1(100), SL2(100), SL3(100), and SL4(100), respectively. There are three peaks along the distribution curve for Br anions and the major peak is at z=2.79 nm. Interestingly, these peaks are located in-between the peaks of CTA+ head groups. The Br ions seem to insert between CTA+ sub-layers because of electrostatic attraction. There is a separated peak along normalized water density profile at z=2.72 nm. It implies that some water molecules are entrapped in the outer layer.
In the case of Au (110) (see Fig. 3(b)), there are five palpable peaks along the distribution density function curve for nitrogen. The positions of the peaks are at z=2.63, 2.73, 2.90, 3.00, and 3.12 nm, and we denote the respective sub-layers as SL1(110), SL2(110), SL3(110), SL4(110), and SL5(110), respectively. The peaks corresponding to SL1(110) and SL4(110) are much higher than the others. There is only one peak along the density profile of Br ions at z=2.79 nm, i.e., at the interval between SL1(110) and SL4(110). Also, there is a separated peak along normalized water density profile at z=2.60 nm.
In Fig. 3(c), we note that there are also five palpable peaks along the distribution density function curve for nitrogen on the Au (111) surface. The positions of the peaks are at z=2.64, 2.74, 2.90, 3.01, and 3.12 nm. Interestingly, these peaks share the same positions as the CTAB bilayer on Au (110) surface. Similarly, we denoted the respective sub-layers as SL1(111), SL2(111), SL3(111), SL4(111), and SL5(111). The density distribution of Br ions also shows only one dominant peak at z=2.79 nm. There is a separated peak along normalized water density profile at z=2.60 nm. According to the water distribution, the hydrophobic region of CTAB bilayer on these gold surfaces is around 2.5 nm, which is very close to the experimentally observed thickness of 2.4 nm for the hydrophobic region[17, 51].
The thickness of the CTAB bilayer was estimated by calculating the distance from the gold surface to the position of the outermost sub-layer, i.e., SL3(100), SL4(110), or SL4(111). Accordingly, the thicknesses of CTAB bilayer on the Au (100), Au (110), and Au (111) surfaces are 3.15, 3.00, and 3.01 nm, respectively. The estimated values of thickness are also consistent with the experimental results which suggested the thickness range between 3.0 and 3.9 nm.
As for the inner layer, the average distances between the nitrogen of CTA+ head groups and gold surfaces are 0.362 nm (Au (100)), 0.330 nm (Au (110)), and 0.359 nm (Au (111)), respectively. The results suggest that the CTA+ head groups are in direct contact with the gold surfaces via the gap betwen the bromide ions, rather than adsorbing over the adsorbed Br ions.
2.3 Lateral diffusion coefficients of CTA+ ionsWe studied the lateral diffusion behavior of interdigitated CTAB bilayer. Because of the electrostatic attraction between CTA+ inner layer and the chemisorbed Br ions, the lateral diffusion of CTAB bilayer is mainly attributed to its outer layer. The diffusion coefficients were calculated by mean square displacement (MSD) method. The calculation was based on last 60-ns trajectories. The MSDs of nitrogen of CTA+ head groups on Au (100), Au (110), and Au (111) surfaces are shown in Fig. 4(a). The lateral diffusion of CTA+ molecules in the outer layer is very slow and the spontaneous fluctuation induces the deviation of MSD from linearity in the region of t between 0 and 4 ns. Consequently, the lateral diffusion coefficients were obtained by using a least squares fit to the MSDs from t=4 to 10 ns
Fig. 4
 | Download: JPG larger image |
Fig. 4 Dynamical properties of CTAB bilayer | |
| $D = \frac{{\left\langle {{{\left| {{r_i}\left( t \right)-{r_i}\left( 0 \right)} \right|}^2}} \right\rangle }}{{4t}}, $ | (1) |
2.4 Fluctuations of outer layer in z-axisIn addition, we studied the fluctuation of the CTA+ along the surface normal. We calculated the distribution of z-position of each CTA+ head group in the outer layer. Several representative distributions are shown in Fig. S5. Moreover, the distributions of every CTA+ head group were averaged to obtain the probability distribution of the whole layer (see Fig. 4(b)). The probability distribution is close to the normal distribution. The full width at half maximum (FWHM) of the distribution was calculated and used to characterize the amplitude of the fluctuation along the surface normal. The FWHM of CTAB bilayers on Au (100), Au (110), and Au (111) are 0.44, 0.53, and 0.67?, respectively. Hence, the CTAB bilayer on Au (111) surface undergoes larger fluctuation than that on the other surfaces.
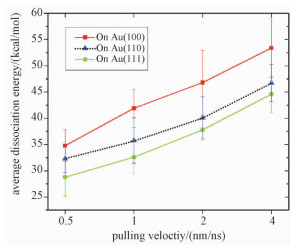
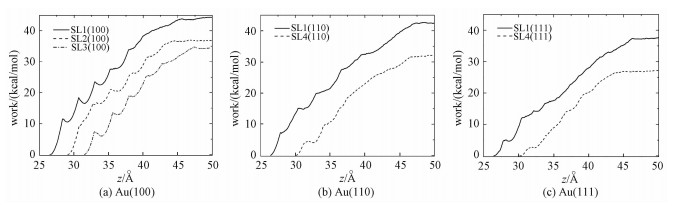
2.5 Average dissociation energyWe estimated the stability of CTAB bilayers by calculating the energy required for dissociation of a CTA+ molecule from the adsorbed bilayer. More specifically, steered molecular dynamics (SMD) simulations were performed for dissociation of a single CTA+ molecule from the outer layer, and the corresponding work was calculated. As shown above, there are several sub-layers in the outer layer. The CTA+ molecules in all the primary sub-layers were chosen. The dissociation energy profiles with the pulling velocity of 0.5 nm/ns were calculated (Fig. S6). For the CTAB bilayers on all three gold surfaces, the dissociation energy of the outmost sub-layer is considerably smaller than that of the other sub-layers. In other word, the CTA+ molecule in the outmost sub-layer is more incline to dissociate. Hence, the dissociation energy of CTA+ molecules in these sub-layers (i.e., SL3(100), SL4(110), SL4(111)) was adopted to evaluate the stability of CTAB bilayer. For each system, six CTA+ molecules were selected and the average dissociation energies with four different pulling velocities, i.e., 0.5, 1.0, 2.0, and 4.0 nm/ns were calculated separately.
As shown in Fig. 5, the relative stability order of CTAB bilayer on these gold surfaces is presented as follows (100)>(110)>(111). For example, the dissociation energies of CTA+ molecules with the pulling velocity of 0.5 nm/ns are 34.8 kcal/mol (Au (100)), 32.3 kcal/mol (Au (110)), and 28.8 kcal/mol (Au (111)). The results are in good agreement with the experimental observation that CTAB tends to adsorb on the (100) or (110) surface rather than the (111) surface[13, 53].
Fig. 5
 | Download: JPG larger image |
Fig. 5 Dissociation energy of CTAB bilayer | |
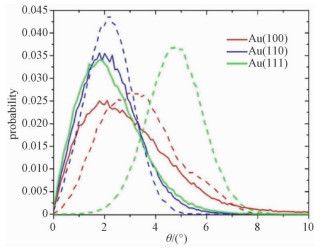
2.6 Angle distribution functionsAs shown above, the stability of CTAB bilayer on Au (111) is considerably weaker than on Au (110) even though their arrangements are quite similar. To further study the mechanism of their stabilities, we investigated the orientations of CTA+ molecules by calculating the angle ?? between CTA+ and surface normal. The probability distributions of CTA+ orientation in the inner and outer layers are shown in Fig. 6. In the case of Au (110), the average ?? values for both layers are 2.1?��, and CTA+ molecules in both layers are well perpendicular to the gold surface. As for the CTAB bilayer on Au (111), the average ?? value of the outer layer is 2.0?��, and it is parallel to the surface normal. However, the average ?? value for the inner layer is up to 5.0?��, which suggests that the CTA+ molecules adopt more tilting orientation. The CTA+ molecules in two layers are no longer parallel to each other. Hence, the weaker stability of CTAB bilayer on Au (111) is due to the fact that two CTAB layers are not well aligned.
Fig. 6
 | Download: JPG larger image |
The solid line and dash line represented outer layer and inner layer of the CTAB bilayer, respectively. Fig. 6 Angle distributions of the CTA+ ions | |
3 ConclusionIn this study, we first investigated possible arrangements of adsorption sites of bromide ion on Au (100), Au (110), and Au (111) facets by performing DFT calculations. Subsequently, molecular dynamics simulations of CTAB bilayers on the three gold surfaces were performed. We showed a novel interdigitated bilayer formed on gold surface. The thickness of bilayer, as the distance between periphery sub-layer and gold surface, was estimated, and the hydrophobic region of CTAB bilayer was defined as the region in the absence of water. The estimated values for the thickness of both bilayers and the hydrophobic region are in agreement with the experimental results. We also employed MSD method to obtain the diffusion coefficient of the CTAB bilayer. The diffusion within such interdigitated bilayer is much slower than that in normal bilayers. The diffusion within CTAB bilayer on Au (111) surface is relatively faster than that on the other surfaces. Besides, the fluctuation along surface normal is more considerable on Au (111) surface. In addition, the stability of CTAB bilayers was estimated in terms of the dissociation energy of single CTA+ molecule. Similarly, the stability of CTAB bilayers on Au (111) is considerably lower than that on the other two surfaces. The differences in stability of CTAB bilayer on different gold surfaces should contribute to the anisotropic growth of the gold nanorod along the (111) direction.
Appendix:Fig. S1
 | Download: JPG larger image |
At t=0 (on top) and t=2ns (on bottom). The Br- and Na+ ions are shown in pink and yellow, respectively. Fig. S1 Configurations of three constructed model of CTAB bilayers on (100) surfaces | |
Fig. S2
 | Download: JPG larger image |
Fig. S2 Possible adsorption sites of secondary Br ion on Au (100) and Au (111) facets | |
TableS1
| TableS1 Computed energies of adsorption of two Br ions on (100) and (111) facetsa | |||||||||||||||||||||||||||||||||||||||||||||
Fig. S3
 | Download: JPG larger image |
Fig. S3 Six possible unit cells of adsorbed Br ions on Au (110) facet | |
TableS2
| TableS2 Computed energies of the possible unit cells of adsorbed Br ions on (110) faceta | ||||||||||||||||||||||||||||
Fig. S4
 | Download: JPG larger image |
Fig. S4 Evolution of thickness of CTAB bilayer on gold surfaces | |
Fig. S5
 | Download: JPG larger image |
For each CTAB bilayer, three CTA+ molecules were selected, and the distributions are represented solid line, dash line, and dash dot line, respectively. Fig. S5 Distributions of the fluctution along surface normal | |
Fig. S6
 | Download: JPG larger image |
Fig. S6 Dissociation work of CTA+ ion in different primary CTAB outer sub-layer | |
References
| [1] | Dreaden E C, Alkilany A M, Huang X H, et al. The golden age:gold nanoparticles for biomedicine[J].Chem Soc Rev, 2012, 41(7):2740�C2779.DOI:10.1039/C1CS15237H |
| [2] | Murphy C J, San T K, Gole A M, et al. Anisotropic metal nanoparticles:synthesis, assembly, and optical applications[J].J Phys Chem B, 2005, 109(29):13857�C13870.DOI:10.1021/jp0516846 |
| [3] | Xiao J Y, Qi L M. Surfactant-assisted, shape-controlled synthesis of gold nanocrystals[J].Nanoscale, 2011, 3(4):1383�C1396.DOI:10.1039/c0nr00814a |
| [4] | Smith R K, Lewis P A, Weiss P S. Patterning self-assembled monolayers[J].Prog Surf Sci, 2004, 75(1/2):1�C68. |
| [5] | Daniel M C, Astruc D. Gold nanoparticles:Assembly, supramolecular chemistry, quantum-size-related properties, and applications toward biology, catalysis, and nanotechnology[J].Chem Rev, 2004, 104(1):293�C346.DOI:10.1021/cr030698+ |
| [6] | Ye X C, Gao Y Z, Chen J, et al. Seeded growth of monodisperse gold nanorods using bromide-free surfactant mixtures[J].Nano Lett, 2013, 13(5):2163�C2171.DOI:10.1021/nl400653s |
| [7] | Jana N R, Gearheart L, Murphy C J. Seed-mediated growth approach for shape-controlled synthesis of spheroidal and rod-like gold nanoparticles using a surfactant template[J].Adv Mater, 2001, 13(18):1389�C1393.DOI:10.1002/(ISSN)1521-4095 |
| [8] | Johnson C J, Dujardin E, Davis S A, et al. Growth and form of gold nanorods prepared by seed-mediated, surfactant-directed synthesis[J].J Mater Chem, 2002, 12(6):1765�C1770.DOI:10.1039/b200953f |
| [9] | Murphy C J, Thompson L B, Alkilany A M, et al. The many faces of gold nanorods[J].J Phys Chem Lett, 2010, 1(19):2867�C2875.DOI:10.1021/jz100992x |
| [10] | Nikoobakht B, El-Sayed M A. Evidence for bilayer assembly of cationic surfactants on the surface of gold nanorods[J].Langmuir, 2001, 17(20):6368�C6374.DOI:10.1021/la010530o |
| [11] | Gao J X, Bender C M, Murphy C J. Dependence of the gold nanorod aspect ratio on the nature of the directing surfactant in aqueous solution[J].Langmuir, 2003, 19(21):9065�C9070.DOI:10.1021/la034919i |
| [12] | Sardar R, Funston A M, Mulvaney P, et al. Gold nanoparticles:past, present, and future[J].Langmuir, 2009, 25(24):13840�C13851.DOI:10.1021/la9019475 |
| [13] | Wang Z L, Mohamed M B, Link S, et al. Crystallographic facets and shapes of gold nanorods of different aspect ratios[J].Surf Sci, 1999, 440(1/2):L809�CL814. |
| [14] | Nakahara H, Shibata O, Moroi Y. Examination of surface adsorption of cetyltrimethylammonium bromide and sodium dodecyl sulfate[J].J Phys Chem B, 2011, 115(29):9077�C9086.DOI:10.1021/jp202940p |
| [15] | Alkilany A M, Nagaria P K, Hexel C R, et al. Cellular uptake and cytotoxicity of gold nanorods:molecular origin of cytotoxicity and surface effects[J].Small, 2009, 5(6):701�C708.DOI:10.1002/smll.v5:6 |
| [16] | Perez-Juste J, Liz-Marzan L M, Carnie S, et al. Electric-field-directed growth of gold nanorods in aqueous surfactant solutions[J].Adv Funct Mater, 2004, 14(6):571�C579.DOI:10.1002/(ISSN)1616-3028 |
| [17] | Alkilany A M, Thompson L B, Boulos S P, et al. Gold nanorods:their potential for photothermal therapeutics and drug delivery, tempered by the complexity of their biological interactions[J].Adv Drug Deliver Rev, 2012, 64(2):190�C199.DOI:10.1016/j.addr.2011.03.005 |
| [18] | Khan Z, Singh T, Hussain J I, et al. Au (��)-CTAB reduction by ascorbic acid:preparation and characterization of gold nanoparticles[J].Colloid Surface B, 2013, 104:11�C17.DOI:10.1016/j.colsurfb.2012.11.017 |
| [19] | Murphy C J, Jana N R. Controlling the aspect ratio of inorganic nanorods and nanowires[J].Adv Mater, 2002, 14(1):80�C82.DOI:10.1002/(ISSN)1521-4095 |
| [20] | Hu W X, Wiria, Ong W L, et al. High yield shape control of monodispersed Au nanostructures with 3D self-assembly ordering[J].Colloid Surface A, 2010, 358(1/3):108�C114. |
| [21] | Mlambo M, Mdluli P S, Shumbula P, et al. Synthesis and characterization of mixed monolayer protected gold nanorods and their Raman activities[J].Mater Res Bull, 2013, 48(10):4181�C4185.DOI:10.1016/j.materresbull.2013.06.076 |
| [22] | Merrill N A, Sethi M, Knecht M R. Structural and equilibrium effects of the surface passivant on the stability of Au nanorods[J].Acs Appl Mater Inter, 2013, 5(16):7906�C7914.DOI:10.1021/am401997q |
| [23] | Gole A, Murphy C J. Seed-mediated synthesis of gold nanorods:role of the size and nature of the seed[J].Chem Mater, 2004, 16(19):3633�C3640.DOI:10.1021/cm0492336 |
| [24] | Link S, Mohamed M B, El-Sayed M A. Simulation of the optical absorption spectra of gold nanorods as a function of their aspect ratio and the effect of the medium dielectric constant[J].J Phys Chem B, 1999, 103(16):3073�C3077.DOI:10.1021/jp990183f |
| [25] | Connor E E, Mwamuka J, Gole A, et al. Gold nanoparticles are taken up by human cells but do not cause acute cytotoxicity[J].Small, 2005, 1(3):325�C327.DOI:10.1002/(ISSN)1613-6829 |
| [26] | Qiu Y, Liu Y, Wang L M, et al. Surface chemistry and aspect ratio mediated cellular uptake of Au nanorods[J].Biomaterials, 2010, 31(30):7606�C7619.DOI:10.1016/j.biomaterials.2010.06.051 |
| [27] | Cortesi R, Esposito E, Menegatti E, et al. Effect of cationic liposome composition on in vitro cytotoxicity and protective effect on carried DNA[J].Int J Pharm, 1996, 139(1/2):69�C78. |
| [28] | Mirska D, Schirmer K, Funari S S, et al. Biophysical and biochemical properties of a binary lipid mixture for DNA transfection[J].Colloid Surface B, 2005, 40(1):51�C59.DOI:10.1016/j.colsurfb.2004.10.007 |
| [29] | Takahashi H, Niidome Y, Niidome T, et al. Modification of gold nanorods using phospatidylcholine to reduce cytotoxicity[J].Langmuir, 2006, 22(1):2�C5.DOI:10.1021/la0520029 |
| [30] | Sreeprasad T S, Samal A K, Pradeep T. One-, two-, and three-dimensional superstructures of gold nanorods induced by dimercaptosuccinic acid[J].Langmuir, 2008, 24(9):4589�C4599.DOI:10.1021/la703523s |
| [31] | Zhong L B, Zhou X, Bao S X, et al. Rational design and SERS properties of side-by-side, end-to-end and end-to-side assemblies of Au nanorods[J].J Mater Chem, 2011, 21(38):14448�C14455.DOI:10.1039/c1jm11193k |
| [32] | Gomez-Grana S, Hubert F, Testard F, et al. Surfactant (Bi) layers on gold nanorods[J].Langmuir, 2012, 28(2):1453�C1459.DOI:10.1021/la203451p |
| [33] | Weidemaier K, Tavernier H L, Fayer M D. Photoinduced electron transfer on the surfaces of micelles[J].J Phys Chem B, 1997, 101(45):9352�C9361.DOI:10.1021/jp972245c |
| [34] | Henkel A, Schubert O, Plech A, et al. Growth Kinetic of a Rod-Shaped Metal Nanocrystal[J].J Phys Chem C, 2009, 113(24):10390�C10394.DOI:10.1021/jp810979r |
| [35] | Bakshi M S, Kaur G, Thakur P, et al. Surfactant selective synthesis of gold nanowires by using a DPPC-surfactant mixture as a capping agent at ambient conditions[J].J Phys Chem C, 2007, 111(16):5932�C5940.DOI:10.1021/jp070759y |
| [36] | Meena S K, Sulpizi M. Understanding the microscopic origin of gold nanoparticle anisotropic growth from molecular dynamics simulations[J].Langmuir, 2013, 29(48):14954�C14961.DOI:10.1021/la403843n |
| [37] | Yuan S L, Ma L X, Zhang X Q, et al. Molecular dynamics studies on monolayer of cetyltrimethylammonium bromide surfactant formed at the air/water interface[J].Colloid Surface A, 2006, 289(1/3):1�C9. |
| [38] | Wandlowski T, Wang J X, Magnussen O M, et al. Structural and kinetic aspects of bromide adsorption on Au (100)[J].J Phys Chem-Us, 1996, 100(24):10277�C10287.DOI:10.1021/jp9600064 |
| [39] | Magnussen O M, Ocko B M, Wang J X, et al. In-situ X-ray diffraction and STM studies of bromide adsorption on Au (111) electrodes[J].J Phys Chem-Us, 1996, 100(13):5500�C5508.DOI:10.1021/jp953281j |
| [40] | Heinz H, Vaia R A, Farmer B L, et al. Accurate simulation of surfaces and interfaces of face-centered cubic metals using 12-6 and 9-6 Lennard-Jones potentials[J].J Phys Chem C, 2008, 112(44):17281�C17290.DOI:10.1021/jp801931d |
| [41] | Feng J, Pandey R B, Berry R J, et al. Adsorption mechanism of single amino acid and surfactant molecules to Au {111} surfaces in aqueous solution:design rules for metal-binding molecules[J].Soft Matter, 2011, 7(5):2113�C2120.DOI:10.1039/c0sm01118e |
| [42] | Wang L M, Li J Y, Pan J, et al. Revealing the binding structure of the protein corona on gold nanorods using synchrotron radiation-based techniques:understanding the reduced damage in cell membranes[J].J Am Chem Soc, 2013, 135(46):17359�C17368.DOI:10.1021/ja406924v |
| [43] | Lybrand T P, Ghosh I, Mccammon J A. Hydration of chloride and bromide anions-determination of relative free-energy by computer-simulation[J].J Am Chem Soc, 1985, 107(25):7793�C7794.DOI:10.1021/ja00311a112 |
| [44] | Thomas A S, Elcock A H. Molecular dynamics simulations of hydrophobic associations in aqueous salt solutions indicate a connection between water hydrogen bonding and the Hofmeister effect[J].J Am Chem Soc, 2007, 129(48):14887�C14898.DOI:10.1021/ja073097z |
| [45] | Ferrer-Tasies L, Moreno-Calvo E, Cano-Sarabia M, et al. Quatsomes:vesicles formed by self-assembly of sterols and quaternary ammonium surfactants[J].Langmuir, 2013, 29(22):6519�C6528.DOI:10.1021/la4003803 |
| [46] | Mackerell A D, Bashford D, Bellott M, et al. All-atom empirical potential for molecular modeling and dynamics studies of proteins[J].J Phys Chem B, 1998, 102(18):3586�C3616.DOI:10.1021/jp973084f |
| [47] | Mackerell A D, Feig M, Brooks C L. Extending the treatment of backbone energetics in protein force fields:limitations of gas-phase quantum mechanics in reproducing protein conformational distributions in molecular dynamics simulations[J].J Comput Chem, 2004, 25(11):1400�C1415.DOI:10.1002/jcc.v25:11 |
| [48] | Darden T, York D, Pedersen L. Particle mesh Ewald:an NlogN method for Ewald sums in large systems[J].J Chem Phys, 1993, 98(12):10089�C10092.DOI:10.1063/1.464397 |
| [49] | Phillips J C, Braun R, Wang W, et al. Scalable molecular dynamics with NAMD[J].J Comput Chem, 2005, 26(16):1781�C1802.DOI:10.1002/(ISSN)1096-987X |
| [50] | Humphrey W, Dalke A, Schulten K. VMD:visual molecular dynamics[J].J Mol Graph Model, 1996, 14(1):33�C38.DOI:10.1016/0263-7855(96)00018-5 |
| [51] | Alkilany A M, Frey R L, Ferry J L, et al. Gold nanorods as nanoadmicelles:1-naphthol partitioning into a nanorod-bound surfactant bilayer[J].Langmuir, 2008, 24(18):10235�C10239.DOI:10.1021/la8018343 |
| [52] | Bockmann R A, Hac A, Heimburg T, et al. Effect of sodium chloride on a lipid bilayer[J].Biophys J, 2003, 85(3):1647�C1655.DOI:10.1016/S0006-3495(03)74594-9 |
| [53] | Xia Y N, Xiong Y J, Lim B, et al. Shape-controlled synthesis of metal nanocrystals:simple chemistry meets complex physics?[J].Angew Chem Int Edit, 2009, 48(1):60�C103.DOI:10.1002/anie.200802248 |
