刘铁新,董自岩,郭怡宁
(大连海事大学 交通运输工程学院,辽宁 大连 116600)
摘要:
结构面广泛分布于岩体之中,难以逐一进行分析。现有研究方法存在对初始信息敏感,分组结果可靠性差,以及难以准确对产状相近的结构面进行分组等不足。针对上述问题,提出了一种基于鹈鹕优化算法(POA)的岩体结构面分组方法。首先,利用POA算法全局寻优初始聚类中心,结合模糊C均值算法(FCM)将结构面产状数据进行完全分组。其次,利用蒙特卡罗模拟技术,生成符合Fisher分布的产状数据。最后,基于正交设计,对比传统FCM算法,以识别错误率为指标,研究了新算法在不同结构面数量、结构面组数、聚类中心、离散度情况下分组精度的变化规律。结果表明:聚类中心对分组精度具有显著影响;所提方法能对产状极点边界不清晰的结构面数据进行有效分组,可有效提高分组精度和分组结果的可靠性。以大连某水库边坡结构面数据为基础,对其进行分组处理,验证了新方法的工程实用性。研究结果可以为结构面三维网络计算机模拟和岩体工程稳定性分析提供依据。
关键词: 岩体力学 鹈鹕优化算法 模糊C均值算法 结构面分组 正交设计
DOI:10.11918/202304025
分类号:TU452
文献标识码:A
基金项目:国家自然科学基金(U19A8,4)
Application of pelican optimization algorithm to clustering analysis of rock mass structural plane
LIU Tiexin,DONG Ziyan,GUO Yining
(College of Transportation Engineering, Dalian Maritime University, Dalian 116600, Liaoning, China)
Abstract:
The discontinuities are widely distributed in the rock mass and are difficult to analyze one by one. Therefore, it is of great engineering value and scientific significance to carry out the dominant grouping of the discontinuities. The existing research methods are sensitive to the initial information, the grouping results are not reliable, and it is difficult to accurately group the discontinuities with similar discontinuity orientations. To address these problems, this paper proposes a method for grouping discontinuities in rock masses based on the pelican optimization algorithm (POA). The POA algorithm is used to globally find the optimal initial clustering center and combine with the fuzzy C-mean algorithm (FCM) to fully group the discontinuity orientations. A Monte Carlo simulation technique is used to generate discontinuity orientations that conform to the Fisher distribution. Based on the orthogonal design, using the recognition error rate as the index, the new algorithm was compared with the traditional FCM algorithm, and the variation regulation of grouping accuracy was investigated under different number of discontinuities, number of discontinuities groups, clustering centers and dispersion degree. The results indicate that the cluster centers have a significant impact on grouping accuracy, and the proposed method is capable of effectively grouping structural data with unclear boundary of geological features, thereby improving the accuracy and reliability of the grouping results. Based on the data of the slope structural plane of a reservoir in Dalian, it is grouped and processed to verify the engineering practicability of the new method. This study can provide a basis for the three-dimensional network computer simulation of structural plane and the stability analysis of rock mass engineering.
Key words: rock mass mechanics POA FCM structural plane grouping orthogonal design
刘铁新, 董自岩, 郭怡宁. 鹈鹕优化算法在岩体结构面分组中的应用[J]. 哈尔滨工业大学学报, 2024, 56(3): 117-125. DOI: 10.11918/202304025.

LIU Tiexin, DONG Ziyan, GUO Yining. Application of pelican optimization algorithm to clustering analysis of rock mass structural plane[J]. Journal of Harbin Institute of Technology, 2024, 56(3): 117-125. DOI: 10.11918/202304025.

基金项目 国家自然科学基金(U19A2098, 41972264) 作者简介 刘铁新(1988—),男,博士,讲师,硕士生导师 通信作者 刘铁新,txliu@dlmu.edu.cn 文章历史 收稿日期: 2023-04-10
Abstract Full text Figures/Tables PDF
鹈鹕优化算法在岩体结构面分组中的应用
刘铁新

 , 董自岩, 郭怡宁
 大连海事大学 交通运输工程学院,辽宁 大连 116600
收稿日期: 2023-04-10; 录用日期: 2023-06-06; 网络首发日期: 2023-09-20
基金项目: 国家自然科学基金(U19A2098, 41972264)
作者简介: 刘铁新(1988—),男,博士,讲师,硕士生导师
通信作者: 刘铁新,txliu@dlmu.edu.cn
摘要: 结构面广泛分布于岩体之中,难以逐一进行分析。现有研究方法存在对初始信息敏感,分组结果可靠性差,以及难以准确对产状相近的结构面进行分组等不足。针对上述问题,提出了一种基于鹈鹕优化算法(POA)的岩体结构面分组方法。首先,利用POA算法全局寻优初始聚类中心,结合模糊C均值算法(FCM)将结构面产状数据进行完全分组。其次,利用蒙特卡罗模拟技术,生成符合Fisher分布的产状数据。最后,基于正交设计,对比传统FCM算法,以识别错误率为指标,研究了新算法在不同结构面数量、结构面组数、聚类中心、离散度情况下分组精度的变化规律。结果表明:聚类中心对分组精度具有显著影响;所提方法能对产状极点边界不清晰的结构面数据进行有效分组,可有效提高分组精度和分组结果的可靠性。以大连某水库边坡结构面数据为基础,对其进行分组处理,验证了新方法的工程实用性。研究结果可以为结构面三维网络计算机模拟和岩体工程稳定性分析提供依据。
关键词: 岩体力学 鹈鹕优化算法 模糊C均值算法 结构面分组 正交设计
Application of pelican optimization algorithm to clustering analysis of rock mass structural plane
LIU Tiexin

 , DONG Ziyan, GUO Yining
 College of Transportation Engineering, Dalian Maritime University, Dalian 116600, Liaoning, China
Abstract: The discontinuities are widely distributed in the rock mass and are difficult to analyze one by one. Therefore, it is of great engineering value and scientific significance to carry out the dominant grouping of the discontinuities. The existing research methods are sensitive to the initial information, the grouping results are not reliable, and it is difficult to accurately group the discontinuities with similar discontinuity orientations. To address these problems, this paper proposes a method for grouping discontinuities in rock masses based on the pelican optimization algorithm (POA). The POA algorithm is used to globally find the optimal initial clustering center and combine with the fuzzy C-mean algorithm (FCM) to fully group the discontinuity orientations. A Monte Carlo simulation technique is used to generate discontinuity orientations that conform to the Fisher distribution. Based on the orthogonal design, using the recognition error rate as the index, the new algorithm was compared with the traditional FCM algorithm, and the variation regulation of grouping accuracy was investigated under different number of discontinuities, number of discontinuities groups, clustering centers and dispersion degree. The results indicate that the cluster centers have a significant impact on grouping accuracy, and the proposed method is capable of effectively grouping structural data with unclear boundary of geological features, thereby improving the accuracy and reliability of the grouping results. Based on the data of the slope structural plane of a reservoir in Dalian, it is grouped and processed to verify the engineering practicability of the new method. This study can provide a basis for the three-dimensional network computer simulation of structural plane and the stability analysis of rock mass engineering.
Keywords: rock mass mechanics POA FCM structural plane grouping orthogonal design
岩体由结构面和结构体两部分组成,直接控制着工程的稳定性[1]。结构面广泛分布岩体之中,由于结构面数量巨大,难以逐一分析,因此,实现岩体结构面的精准分组,是进行岩体工程稳定性分析和结构面三维网络计算机模拟的先决条件[2]。经历相同地质构造时期的结构面,产状、间距、粗糙度等属性上是相似的,可以划分为同一优势组别[3]。由于工程现场环境复杂,许多结构面指标难以测量。结构面产状可使用罗盘或者点云模型进行测量。依据产状数据,对结构面进行组别划分,是目前常用的分组方法[4]。
文献[5]将结构面的产状数据进行二维化显示,简化了结构面数据的处理方式,并对结构面的分组方法进行了研究。早期的结构面分组多采用极点图、等密度图、玫瑰图等方法[6]。此类方法虽然操作简单,分组结果直观,但无法给出稳定准确的结构面分组结果,且在产状极点边界不清晰时,需要根据工程人员的经验进行判断,最终的分组结果受到强烈的主观因素影响。为了避免人为因素的干扰,文献[7]提出了基于结构面产状数据的分组算法,此方法的局限性在于需要先给定小球半径,用来确定密度点的位置。在此基础上,结构面分组算法得到进一步发展。文献[8]将FCM算法引入结构面分组中;文献[9]采用闭包传递的方法,实现对结构面产状的模糊聚类;文献[10]将模糊等价聚类和模糊软划分聚类方法相结合,提出了综合模糊聚类分析方法;文献[11]将迭代思想引入结构面分组中;文献[12]建立了服从双正态分布的产状模型,并用迭代法对结构面进行分组。上述方法大部分为局部寻优方法,易陷入局部最优解,导致所得分组结果不稳定。考虑到FCM算法的不足,部分学者尝试将人工智能算法引入结构面分组中,以改善FCM算法的性能。部分研究[13-16]将差分进化优化算法、变尺度混沌优化算法、量子粒子群算法、变长字符串遗传算法等优化算法引入到结构面分组方法中,使获得的聚类中心更具有全局性,分组的结果更加准确。然而,上述算法往往实现过程繁琐且输入参数较多,分组效率较低,工程实用性有限。
鉴于传统结构面分组方法存在的不足,本文提出一种基于鹈鹕优化算法的结构面分组方法(PFCM算法),从鹈鹕优化算法出发,借助算法的强空间寻优能力,结合模糊聚类算法软划分的特点,获得精确可靠分组结果。该方法能够有效处理产状极点边界不清晰的数据,扩大了结构面分组方法的应用范围。最后,利用PFCM算法对大连某边坡的结构面进行了分组,对其工程实用性进行了验证。
1 基于POA的FCM聚类算法 1.1 PFCM算法鹈鹕优化算法(pelican optimization algorithm,POA)是一种新型元启发式优化算法,灵感来自鹈鹕种群狩猎行为。通过模拟鹈鹕狩猎的全过程,建立数学模型,找到解决问题的最优解[17]。该方法具有输入参数少、收敛速度快、全局寻优与局部搜索相结合、算法运行流程简单等优点。
本文结合结构面分组特点,将鹈鹕种群成员位置设定为结构面产状聚心集(鹈鹕狩猎的过程即为寻找最优聚心集的过程),提出了基于鹈鹕优化算法的模糊聚类方法(PFCM)。该方法通过确定种群成员位置,迭代计算目标函数值F,获得全局理想解(最优聚心集)。具体算法流程如图 1所示,基本步骤如下。
Fig. 1
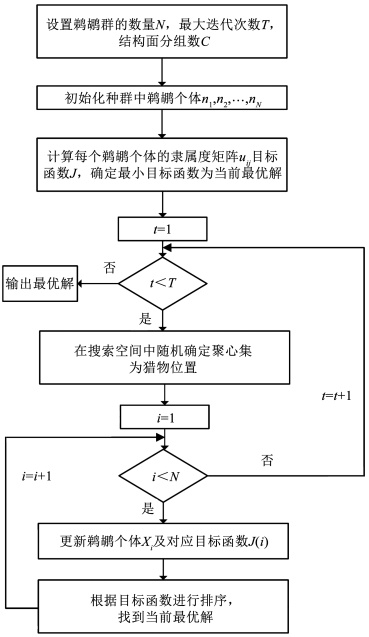 图 1 算法流程图 Fig. 1 Flow chart of algorithm
 步骤1??设置迭代次数T、鹈鹕种群规模N及结构面分组数C。N和T越大,搜索精度越高,计算负担越大。通过多次试算,N设置为30, T设置为100。
步骤2??根据倾向(0°<α<360°)和倾角(0°<β<90°)的范围,随机生成结构面产状聚心集。该过程重复N次,生成N个鹈鹕位置。
步骤3??计算所有产状数据对鹈鹕种群成员位置的隶属度,由隶属度矩阵计算目标函数值F,将目标函数值最小的鹈鹕所在位置视为全局最优解。
步骤4??随机寻找C条结构面产状数据,构成猎物位置。
步骤5??根据POA算法优化原理,计算鹈鹕新位置,并计算更新后隶属度矩阵和目标函数值。
步骤6??将所得目标函数值与猎物位置目标函数值比较,更新鹈鹕位置与全局最优解。
步骤7??进行算法迭代,重复步骤4~6,确定每次迭代后目标函数最小值,鹈鹕对应位置为最佳位置。算法迭代过程中,所得的鹈鹕最佳位置为最优结构面产状聚心集。
步骤8??以步骤7中所得聚心集为初始聚类中心,使用FCM算法进行最终分组。
1.2 模糊C均值聚类算法利用模糊C均值聚类算法(FCM)进行聚类时,需要给定初始的聚类中心。获得初始聚类中心后,根据初始聚类中心计算所有样本数据对于聚类中心的隶属度[18]。在获得聚类中心和隶属度矩阵后,便可计算模糊目标函数。模糊目标函数值是评价聚类结果优劣的重要指标,模糊目标函数值越低,聚类结果越好[19]。依据模糊目标函数值重新选择聚类中心,再根据新的聚类中心更新隶属度矩阵,最后由更新后的隶属度矩阵计算出新的模糊目标函数。重复上述步骤,直到所得模糊目标函数值为最小值时,聚类中心和隶属度矩阵为最优。隶属度矩阵和模糊目标函数计算[20]如下。
给定N个结构面xj(j=1, 2, 3,…,N),划为K组,每组的聚类中心为vi(i=1, 2, 3, …, K)。定义uij为第j个结构面属于第i个聚类中心的隶属度,即
$u_{i j}=\frac{1}{d^2\left(v_i, x_j\right)^{\frac{1}{m-1}}} / \sum\limits_{k=1}^C\left[\frac{1}{d^2\left(v_i, x_k\right)^{\frac{1}{m-1}}}\right]$ (1)
则模糊目标函数为
$J_m(U, C)=\sum\limits_{i=1}^K \sum\limits_{j=1}^N\left(u_{i j}\right)^m d\left(v_i, x_j\right)$ (2)
式中:d(vi,xj)表示vi与xj之间的距离,d (vi,xk)表示vi与xk之间的距离,这里采用夹角正弦距离作为距离度量[21];m为模糊加权系数,m∈[1, ∞],用于控制隶属度的分配及聚类的模糊程度,从聚类有效性角度分析,m的取值介于1.5~2.5之间,在通常情况下,取值m=2[22];uij∈[0, 1]和
FCM算法依赖初始聚类中心,聚类结果不稳定,与实际情况有一定差异。针对上述不足,本文基于POA算法,对FCM算法进行了改进。
1.3 鹈鹕优化算法在POA算法中,使用目标函数来评估候选解决方案的优劣情况,目标函数值越小,候选解决方案越优,候选解越逼近最优解。在对岩体结构面分组时,选取式(2)作为目标函数,目标函数值最小的聚心集即为结构面的优势产状集。POA算法中的目标函数为
$F=J_m(U, C)$ (3)
1.3.1 初始化阶段假设m维空间中有n只鹈鹕,第i只鹈鹕在m维空间中的位置为Xi=[Xi1, Xi2, …, Xin],则n只鹈鹕在m维空间的位置X为
$X=\left[\begin{array}{c}X_1 \\X_2 \\\vdots \\X_n\end{array}\right]=\left[\begin{array}{cccc}x_{11} & x_{12} & \cdots & x_{1 m} \\x_{21} & x_{22} & \cdots & x_{2 m} \\\vdots & \vdots & \vdots & \vdots \\x_{n 1} & x_{n 2} & \cdots & x_{n m}\end{array}\right]$ (4)
鹈鹕位置初始化为
$x_{i j}=l_j+\alpha \cdot\left(u_j-l_j\right), i=1, 2, \cdots, n ; j=1, 2, \cdots, m$ (5)
式中:xij为第i个鹈鹕在第j维的位置,n为鹈鹕的种群数量,m为求解问题的维度;α为[0, 1]内的随机数,uj、lj分别是求解问题在第j维的上下边界。
1.3.2 移向猎物阶段在这个阶段,鹈鹕识别猎物的位置,并向着猎物移动。猎物在搜索空间的随机分布特性增强了算法的全局寻优能力。每次迭代中,鹈鹕的新位置为
$x_{i j}^{p_1}= \begin{cases}x_{i j}+\sigma \cdot\left(P_j-I \cdot x_{i j}\right), & F_{\mathrm{p}}<F_i \\ x_{i j}+\sigma \cdot\left(x_{i j}-P_j\right), & \text { 其他 }\end{cases}$ (6)
式中:xijp1为第一阶段更新后第i个鹈鹕在第j维的位置,σ为[0, 1]内的随机数,I为1或2的随机整数,Pj为猎物在第j维的位置,Fp为猎物的目标函数值。
如果目标函数值在该位置得到改善,则其更新位置为
$x_i=\left\{\begin{array}{l}x_i^{P_1}, F_i^{P_1}<F_i \\x_i, \text { 其他 }\end{array}\right.$ (7)
式中:xiP1为第i个鹈鹕的新位置,xi为第一阶段更新后的第i个鹈鹕在新位置的目标函数值。
1.3.3 掠过水面阶段鹈鹕到达水面后,它们在水面上展开翅膀,将猎物收集在喉袋中,该过程增强了算法的局部搜索能力。每次迭代中,鹈鹕的新位置为
$x_{i j}^{p_2}=x_{i j}+R \cdot(1-t / T) \cdot(2 \cdot \beta-1) \cdot x_{i j}$ (8)
式中:xijp2为第二阶段更新后第i个鹈鹕在第j维的位置,β为[0, 1]内的随机数,R为1或2的随机整数,t为当前迭代次数,T为最大迭代次数。
如果目标函数值在该位置得到改善,则更新位置为
$x_i=\left\{\begin{array}{l}x_i^{p_2}, F_i^{P_2}<F_i \\x_i, \text { 其他 }\end{array}\right.$ (9)
式中: xiP2为第i个鹈鹕的新位置,FiP2为第二阶段更新后的第i个鹈鹕在新位置的目标函数。
在结构面分组应用中,该方法相较一般仿生算法优势如下:1)能得到更优的聚心集。对产状极点边界不清晰结构面分组时,能有效降低了识别错误率,使分组结果更为合理;2)人为输入参数少。最大程度减少人为因素,对于结构面分组结果的影响;3)程序实现步骤简单,分组花费时间少,提高了分组效率。
1.4 聚类有效性检验聚类有效性评价的关键在于:确定样本划分数目的合理性,以及如何定性分析划分结果的优劣性[23]。文献[24]以夹角余弦距离作为相似性度量,提出了简化的谢贝尼指数。该简化指标精度高、实用性强。计算公式如式(10)、(11)所示。
$V=\frac{\sum\limits_{i=1}^n \sum\limits_{j=1}^K U_{i j} d^2\left(\boldsymbol{N}_i, \boldsymbol{V}_j\right)}{\left.\min \left(d^2 (\underset{j \neq l}{\boldsymbol{V}_j}, \boldsymbol{V}_l\right)\right)}=\frac{\sum\limits_{i=1}^n \sum\limits_{j=1}^K U_{i j}\left(\arccos \left|\boldsymbol{N}_i^{\mathrm{T}} \boldsymbol{V}_j\right|\right.}{\min \left(\underset{\substack{j \neq l}}{\left.\arccos \left|\boldsymbol{V}_j^{\mathrm{T}} \boldsymbol{V}_l\right|\right)}\right.}$ (10)
$U_{i j}=\left\{\begin{array}{l}1, \boldsymbol{N}_i \in \boldsymbol{W}_j \\0, \text { 其他 }\end{array}\right.$ (11)
式中:
谢贝尼指数越小,聚类效果越好;反之,聚类效果越差。
2 算法精度验证和分析 2.1 算法精度对比采用蒙特卡罗模拟技术,模拟生成符合Fisher分布的人工数据集[25],进行算法精度对比。具体模拟参数见表 1。生成数据集共有4个优势产状组,每个组包含300个产状数据。下面分别使用PFCM算法和FCM算法[11]对模拟产状数据进行分组,通过比较模拟参数和本文所提算法的分组结果来验证算法的有效性,通过比较两种算法的分组结果来验证算法的准确性。
表 1
1 1 40 300
2 90 40 300
3 189 40 300
4 268 40 300
表 1 结构面模拟参数 Tab. 1 Simulation parameters of structural plane
在对符合Fisher分布的产状数据进行分组时,通常用离散度(k)表征产状数据围绕均值的密集程度,离散度越大,数据围绕均值越紧密[25]。对不同离散度下生成的产状数据进行分组,检验不同产状极点边界情况的分组精度。
当离散度k>30时,数据紧密围绕在均值周围,聚类边界清晰,分组效果良好;当k<10时,数据高度分散,聚类边界较模糊,分组结果不具有代表性。因此,选取10到30区间的离散度进行分析。
根据表 1的模拟参数,在k=10、k=20、k=30时,分别生成符合Fisher分布的人工数据集。模拟生成结构面产状极点图,如图 2所示。FCM算法和PFCM算法聚类生成的结构面极点图,如图 3所示。
Fig. 2
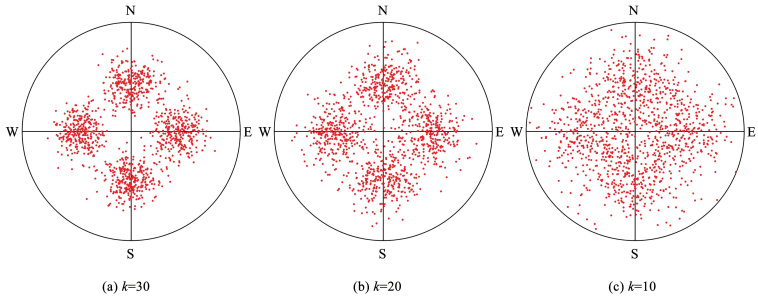 图 2 不同离散度下的结构面极点图(模拟) Fig. 2 Pole diagram of structural plane with different degrees of dispersion(simulation)
 Fig. 3
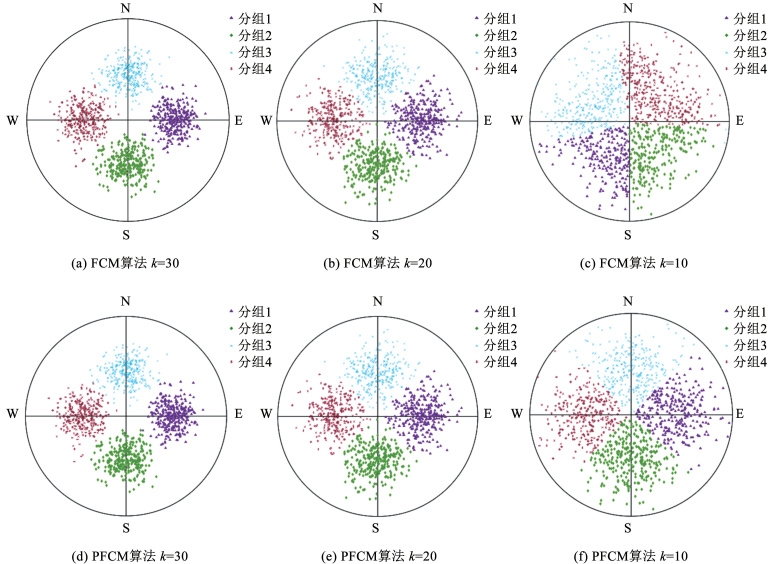 图 3 不同离散度下的聚类效果对比图 Fig. 3 Comparison diagram of clustering effects under different degrees of dispersion
 由图 2、3可知,FCM算法和PFCM算法在3次分组检验中,得到的分组数相同,与模拟的分组数一致。FCM算法和PFCM算法在结构面条数、倾向、倾角3个参数上,与模拟参数存在误差,具体分组对比结果见表 2。
表 2
k=30 k=20 k=10 k=30 k=20 k=10 k=30 k=20 k=10
FCM 358.85 1.90 36.06 51.01 50.23 51.41 303 304 380
90.46 89.12 113.45 51.06 48.91 54.45 303 292 323
181.00 175.54 227.83 49.28 50.97 55.00 298 306 242
269.37 270.07 322.42 48.37 50.49 52.69 296 298 255
PFCM 0.82 2.33 359.90 39.22 39.50 38.42 302 303 292
90.60 92.26 89.60 38.98 39.87 39.93 301 302 301
180.70 179.13 180.72 40.19 39.53 39.75 300 296 299
269.43 267.68 267.01 41.66 40.22 40.97 297 299 308
表 2 模拟参数和聚类结果对比 Tab. 2 Comparison of simulation parameters and clustering results
由表 2可知,在k=30和k=20两种情况下,FCM和PFCM算法的分组结果,与模拟分组结果相近,PFCM算法的分组结果更优,错误识别的结构面仅为FCM算法的一半。在k=10的情况下,PFCM算法分组效果依然良好,错误识别了9条结构面;FCM算法的分组效果较差,错误识别了103条结构面。PFCM算法分组所得的优势产状倾向和倾角,与模拟参数基本吻合;FCM算法所得倾向和倾角,与模拟参数存在较大差异。
识别错误率是指被错误分组的结构面的比率,常被作为评价结构面分组精度的指标。上述3种情况下,PFCM算法和FCM算法的识别错误率见表 3。
表 3
FCM 30 0.50
20 0.83
10 8.58
PFCM 30 0.25
20 0.42
10 0.75
表 3 不同离散度下的识别错误率对比 Tab. 3 Comparison of recognition error rates under different dispersions
由表 3可见,k=30和k=20时,FCM算法和PFCM算法的识别错误率,处于较低水平,均小于1%;k=10时,PFCM算法的识别错误率依旧较低,为0.75%;FCM算法的识别错误率出现较大波动,增长至8.58%。为了清楚知道k在10~30之间取值时,PFCM和FCM算法的识别错误率变化情况,下面对两种算法的分组情况进一步研究,具体识别错误率对比结果如图 4所示。
Fig. 4
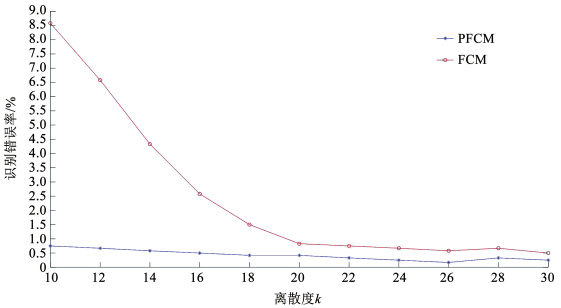 图 4 不同离散度下识别错误率对比 Fig. 4 Comparison of recognition error rates under different dispersions
 由图 4可以得到以下结论:1)PFCM算法的识别错误率随着离散度的下降呈现上升的趋势。2)FCM算法的识别错误率,在离散度由30到20时,呈现较为平稳的趋势;在离散度由20到10时,呈现指数上升的趋势。3)当离散度大于20时,两种算法的识别错误率差距较小,分组精度较高;当离散度小于20时,两种算法的识别错误率出现明显差异,FCM算法的分组可靠性不高。
FCM算法较为依赖初始聚类中心,聚类中心不合理,会导致较大的识别错误率。PFCM算法优化上述问题,给出全局最优的初始聚类中心,分组结果和模拟参数基本一致,且产状极点边界不清晰时,识别错误率仍然较低。
2.2 不同变量对算法精度的影响性分析在算法验证的过程中发现,离散度、结构面条数、结构面组数(用结构面优势产状倾向来表示)、聚类中心(用结构面优势产状倾角来表示)等变量,对PFCM算法的识别精度有着较大影响。基于正交试验设计,用A、B、C、D表示上述4个变量,每个变量设置5个水平,以识别错误率为评定指标,研究PFCM算法的分组精度变化规律。试验采用L25(45)正交表,因素水平见表 4。
表 4
1 10 100 (90/270) 20
2 15 200 (0/120/240) 30
3 20 300 (0/90/180/270) 40
4 25 400 (0/72/144/216/288) 50
5 30 500 (0/60/120/180/240/300) 60
表 4 正交设计影响因素水平表 Tab. 4 Factors and levels of orthogonal design
根据变量设定的水平数,生成结构面产状数据,计算每种情况下的识别错误率,结果见表 5。对计算结果进行极差分析[26],确定4个变量对PFCM算法分组精度影响的显著性。
表 5
1 2 2 4 2 2.40
2 5 1 2 2 0.33
3 4 1 3 3 0.50
4 1 2 5 3 4.42
5 3 1 4 4 0.80
6 2 3 3 4 0.42
7 4 2 2 5 0
8 5 2 1 4 0
9 5 4 4 3 0.50
10 4 4 5 4 0.79
11 3 4 1 5 0.25
12 2 4 2 1 0.67
13 2 1 5 5 1.67
14 4 3 1 2 0.33
15 1 3 4 5 2.00
16 1 1 1 1 1.00
17 3 2 3 1 0.88
18 5 5 3 5 0.20
19 1 4 3 2 2.75
20 3 5 5 2 1.03
21 2 5 1 3 0.10
22 4 5 4 1 2.52
23 5 3 5 1 3.00
24 1 5 2 4 0.33
25 3 3 2 3 0.44
表 5 正交设计数据表 Tab. 5 Data of orthogonal design
表 6为评定指标的极差分析结果表,其中:Ki(i=1, 2, …, 5)表示m(m=A, B, C, D)变量第i个水平的试验结果之和;ki(i=1, 2, …, 5)表示Ki的平均值[26]。通过表 6可知,A, B, C, D 4个变量的极差分别为1.78、0.88、2.31、1.43。由极差结果分析可得,变量对于PFCM算法分组精度影响的主次顺序:聚类中心→离散度→结构面组数→结构面数量。
表 6
K1 10.50 4.30 1.68 8.07
K2 5.26 7.70 1.77 6.84
K3 3.40 6.19 4.75 5.96
K4 4.14 4.96 8.22 2.34
K5 4.03 4.18 10.91 4.12
k1 2.63 1.08 0.42 2.02
k2 1.32 1.93 0.44 1.71
k3 0.85 1.55 1.19 1.49
k4 1.04 1.24 2.06 0.59
k5 1.01 1.05 2.73 1.03
表 6 识别错误率极差分析结果 Tab. 6 Results of range analysis of recognition error rate
3 工程应用大连龙王塘水库道路边坡,岩体多呈现块状结构,结构面发育明显。因边坡稳定性易受结构面影响,边坡结构面有效分组显得尤为重要。本次研究的结构面产状数据,是基于数字摄影测量技术计算所得。
拍摄水库边坡岩体图像,利用近距离数字摄影测量技术,建立边坡岩体三维点云模型。根据三维点云模型,提取迹线拐点坐标,拟合覆盖拐点坐标的三维平面。基于三维平面的法向量,计算出结构面的产状(倾向和倾角)数据[27]。经由上述方法,共测得结构面产状1 030个。文献[28]指出,只有当结构面数目超过200个时,才可以对结构面进行分组,显然,所测得的结构面数目符合分组要求。
鹈鹕优化算法参数设置如下:最大迭代次数T=100,初始种群规模N=30。根据工程实践经验,分组数通常在2~8之间。以简化的谢贝尼指数为分组效果评价指标,对比不同分组数下的分组结果,确定最佳分组数。分组数为2、3、4、5、6、7、8时,简化谢贝尼指数分别为525.69、327.95、398.36、400.52、441.28、451.49、480.70。
由所求简化谢贝尼指数可知,分组数为3时,简化谢贝尼指标最小,分组效果最佳。PFCM算法结构面分组结果见表 7,结构面产状聚类效果如图 5所示。
表 7
1 149.28 66.74 306
2 274.31 25.69 456
3 40.79 69.54 268
表 7 结构面聚类参数(3组) Tab. 7 structural plane clustering parameters (3 groups)
Fig. 5
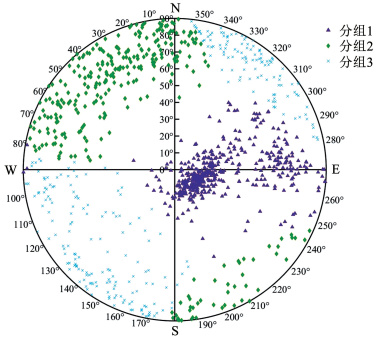 图 5 结构面聚类极点图(3组) Fig. 5 Pole clustering figure of structural plane (3)
 确定分组数为3后,PFCM算法对1 030个结构面进行分组,每组的结构面数分别为456、306、268,这一分组结果和工程实际情况相一致,可为后续研究工作提供理论依据。
4 结论针对传统结构面分组方法的不足,将鹈鹕优化算法引入结构面分组当中,提出一种基于POA算法的岩体结构面分组方法。通过对该方法的研究和应用,得出以下主要结论:
1) 利用鹈鹕优化算法,改进了FCM算法易受初始聚类中心的影响,难以实现全局优化的不足,分组结果更加高效、准确。
2) 与未经优化FCM聚类算法相比,PFCM算法在对产状极点边界不清晰结构面分组时具有明显优势,分组结果更加稳定。
3) 通过正交设计试验,得到4个变量对算法精度影响的显著性。聚类中心对算法精度影响最为显著;离散度次之。
4) 应用PFCM算法对大连龙王塘水库边坡结构面分组,得到与工程实际情况相符的分组结果,可为结构面三维网络计算机模拟和岩体工程稳定性分析提供理论基础。
参考文献
[1] HAO Yimin, ZHAO Gaofeng, YANG Tianhong, et al. A coupled numerical method to study the local stability of jointed rock slopes under long-distance bench blasting[J]. Geomechanics and Geophysics for Geo-Energy and Geo-Resources, 2022, 8(5): 153. DOI:10.1007/s40948-022-00466-3
[2] 张化进, 吴顺川, 韩龙强. 基于DBSCAN选择性聚类集成的岩体结构面优势产状分组方法[J]. 岩土力学, 2022, 43(6): 1585.
ZHANG Huajin, WU Shunchuan, HAN Longqiang. Dominant partitioning method of rock mass discontinuity based on DBSCAN selective clustering ensemble[J]. Rock and Soil Mechanics, 2022, 43(6): 1585. DOI:10.16285/j.rsm.2021.1582
[3] 刘恺, 李启月, 李夕兵, 等. 岩体结构面非典型数据集的优势组提取方法[J]. 岩石力学与工程学报, 2017, 36(增刊2): 4018.
LIU Kai, LI Qiyue, LI Xibing, et al. A dominant group determination method for atypical data sets of rock joint occurrences[J]. Chinese Journal of Rock Mechanics and Engineering, 2017, 36(Sup.2): 4018. DOI:10.13722/j.cnki.jrme.2015.1177
[4] 侯钦宽, 雍睿, 杜时贵, 等. 基于编网算法的岩体结构面优势产状聚类分析[J]. 岩石力学与工程学报, 2020, 39(增刊1): 2871.
HOU Qinkuan, YONG Rui, DU Shigui, et al. A method for clustering orientation data of discontinuities of rock mass based on netting algorithm[J]. Chinese Journal of Rock Mechanics and Engineering, 2020, 39(Sup.1): 2871. DOI:10.13722/j.cnki.jrme.2019.0865
[5] BINGHAM C. An antipodally symmetric distribution on the sphere[J]. Institute of Mathematical Statistics, 1974, 2(6): 1201.
[6] HOU Qinkuan, WANG Shuhong, YONG Rui, et al. A method for clustering rock discontinuities with multiple properties based on an improved netting algorithm[J]. Geomechanics and Geophysics for Geo-Energy and Geo-Resources, 2023, 9(1): 64. DOI:10.1007/s40948-023-00533-3
[7] SHANLEY R J, MAHTAB M A. Delineation and analysis of clusters in orientation data[J]. Journal of the International Association for Mathematical Geology, 1976, 8(1): 9. DOI:10.1007/bf01039681
[8] HAMMAH R E, CURRAN J H. Fuzzy cluster algorithm for the automatic identification of joint sets[J]. Int J Rock Mech Min Sci, 1998, 35(7): 889. DOI:10.1016/S0148-9062(98)00011-4
[9] 孙其国. 模糊聚类分析法在结构面产状分组中的应用[J]. 化工矿山技术, 1997, 26(1): 57.
SUN Qiguo. Application of fuzzy clustering analysis in grouping of discontinuities[J]. Industrial Minerals and Processing, 1997, 26(1): 57. DOI:10.16283/j.cnki.hgkwyjg.1997.01.024
[10] 周玉新, 周志芳, 孙其国. 岩体结构面产状的综合模糊聚类分析[J]. 岩石力学与工程学报, 2005, 24(13): 2283.
ZHOU Yuxin, ZHOU Zhifang, SUN Qiguo. Synthetical fuzzy clustering analysis for joints occurrence of rock mass[J]. Chinese Journal of Rock Mechanics and Engineering, 2005, 24(13): 2283.
[11] DERSHOWITZ W, BUSSE R, GEIER J, et al. A stochastic approach for fracture set definition[C]//2nd North American Rock Mechanics Symposium. Montreal: OnePetro, 1996
[12] MARCOTTE D, HENRY E. Automatic joint set clustering using a mixture of bivariate normal distributions[J]. International Journal of Rock Mechanics and Mining Sciences, 2002, 39(3): 323. DOI:10.1016/s1365-1609(02)00033-3
[13] CUI Xuejie, YANG Echuan. Fuzzy c-means cluster analysis based on variable length string genetic algorithm for the grouping of rock discontinuity sets[J]. Ksce Journal of Civil Engineering, 2020, 24(11): 3237. DOI:10.1007/s12205-020-2188-2
[14] ESMAEILZADEH A, SHAHRIAR K. Optimized fuzzy cmeans-fuzzy covariance-fuzzy maximum likelihood estimation clustering method based on deferential evolutionary optimization algorithm for identification of rock mass discontinuities sets[J]. Periodica Polytechnica: Civil Engineering, 2019, 63(2): 674. DOI:10.3311/PPci.13885
[15] JI Doufa, LEI Weidong, CHEN Wenqin. A hybrid algorithm for classifying rock joints based on improved artificial bee colony and fuzzy c-means clustering algorithm[J]. Geomechanics and Engineering, 2022, 31(4): 353. DOI:10.12989/gae.2022.31.4.353
[16] XU Liming, CHEN Jianping, WANG Qian, et al. Fuzzy c-means cluster analysis based on mutative scale chaos optimization algorithm for the Grouping of discontinuity sets[J]. Rock Mechanics and Rock Engineering, 2013, 46(1): 189. DOI:10.1007/s00603-012-0244-z
[17] TROJOVSKY P, MOHAMMAD D. Pelican optimization algorithm: a novel nature-inspired algorithm for engineering applications[J]. Sensors, 2022, 22(3): 165. DOI:10.3390/s22030855
[18] LIU Tiexin, ZHENG Jun, DENG Jianhui. A new iteration clustering method for rock discontinuity sets considering discontinuity trace lengths and orientations[J]. Bulletin of Engineering Geology and the Environment, 2021, 80(1): 413. DOI:10.1007/s10064-020-01921-9
[19] SONG Shengyuan, WANG Qian, CHEN Jianping, et al. Fuzzy c-means clustering analysis based on quantum particle swarm optimization algorithm for the grouping of rock discontinuity sets[J]. Ksce Journal of Civil Engineering, 2017, 21(4): 1115. DOI:10.1007/s12205-016-1223-9
[20] CUI Xuejie, YANG Echuan. A clustering algorithm based on differential evolution for the identification of rock discontinuity sets[J]. International Journal of Rock Mechanics and Mining Sciences, 2020, 126: 1544. DOI:10.1016/j.ijrmms.2019.104181
[21] HAMMAH R E, CURRAN J H. On distance measures for the fuzzy k-means algorithm for joint data[J]. Rock Mechanics and Rock Engineering, 1999, 32(1): 1. DOI:10.1007/s006030050041
[22] LIU Tiexin, JIANG Annan, DENG Jianhui, et al. A new multiple-factor clustering method considering both box fractal dimension and orientation of joints[J]. Journal of Rock Mechanics and Geotechnical Engineering, 2022, 14(2): 366. DOI:10.1016/j.jrmge.2021.07.014
[23] DING Qing, HUANG Ruiqiu, WANG Fengyan, et al. Multi-parameter dominant grouping of discontinuities in rock mass using improved isodata algorithm[J]. Mathematical Problems in Engineering, 2018, 2018: 1024. DOI:10.1155/2018/5619404
[24] MA Guowei, XU Zhenhao, ZHANG Wen, et al. An enriched k-means clustering method for grouping fractures with meliorated initial centers[J]. Arabian Journal of Geosciences, 2015, 8(4): 1881. DOI:10.1007/s12517-014-1379-x
[25] 陆峰, 王俊奇. fisher模型在岩体裂隙面模拟中的应用[J]. 中国水利水电科学研究院学报, 2010, 8(4): 309.
LU Feng, WANG Junqi. Application offisher model in rock fracture surface simulation[J]. Journal of China Institute of Water Resources and Hydropower Research, 2010, 8(4): 309. DOI:10.13244/j.cnki.jiwhr.2010.04.004
[26] 朱彦鹏, 王浩, 刘东瑞, 等. 基于正交设计的风化砂岩流态固化土抗剪强度试验研究[J]. 岩土工程学报, 2022, 44(增刊1): 46.
ZHU Yanpeng, WANG Hao, LIU Dongrui, et al. Experimental study on shear strength of fluid-solidified soil of weathered sandstone based on orthogonal design[J]. Chinese Journal of Geotechnical Engineering, 2022, 44(Sup.1): 46.
[27] LIU Tiexin, DENG Jianhui, ZHENG Jun, et al. A new semi-deterministic block theory method with digital photogrammetry for stability analysis of a high rock slope in China[J]. Engineering Geology, 2017, 216: 76. DOI:10.1016/j.enggeo.2016.11.012
[28] 贾洪彪, 唐辉明, 刘佑荣. 岩体结构面三维网格模拟理论与工程应用[M]. 北京: 科学出版社, 2008: 48.
JIA Hongbiao, TANG Huiming, LIU Yourong. Theory and engineering application of 3-D network modeling of discontinuities in rock mass[M]. Beijing: Science Press, 2008: 48.
