Author NameAffiliation
Jie Huang Shanghai Institute of Satellite Engineering, Shanghai 201109, China
Chaolan You Shanghai Institute of Satellite Engineering, Shanghai 201109, China
Peng Hou Shanghai Institute of Satellite Equipment, Shanghai 200240, China
Da Luo Shanghai Institute of Satellite Engineering, Shanghai 201109, China
Xiangsen Kong Shanghai Institute of Satellite Engineering, Shanghai 201109, China
Xin Fu Shanghai Institute of Satellite Engineering, Shanghai 201109, China
Abstract:
To solve the special requirements of the high orbit optical remote sensing-satellite for the thermal deformation of the platform, the thermal deformation test and measurement scheme of the satellite platform is designed. Through the comparative analysis of test results, the rationality of the thermal deformation design of the platform structure is verified. The results of thermal deformation measurement show that the maximum deformation of A camera mounting surface is 57.5〃, and the maximum deformation of B camera mounting surface points to 79.3〃, which can be used as the basis for thermal deformation prediction of satellite during the orbit operation.
Key words: remote sensing satellite thermal deformation meteorological satellite
DOI:10.11916/j.issn.1005-9113.17146
Clc Number:TU391
Fund:
Jie Huang, Chaolan You, Peng Hou, Da Luo, Xiangsen Kong, Xin Fu. Study on Thermal Deformation Measurement of Optical Remote Sensing Satellite Platform Based on Machine Vision[J]. Journal of Harbin Institute of Technology (New Series), 2019, 26(5): 72-78. DOI: 10.11916/j.issn.1005-9113.17146

Fund Sponsored by the Military Commission on Science and Technology (Grant No. 17-163-18-XJ-001-054-01) Corresponding author Jie Huang, E-mail: huangmen_2207@qq.com Article history Received: 2017-11-25
Contents Abstract Full text Figures/Tables PDF
Study on Thermal Deformation Measurement of Optical Remote Sensing Satellite Platform Based on Machine Vision
Jie Huang1

 , Chaolan You1, Peng Hou2, Da Luo1, Xiangsen Kong1, Xin Fu1
 1. Shanghai Institute of Satellite Engineering, Shanghai 201109, China;
2. Shanghai Institute of Satellite Equipment, Shanghai 200240, China
Received: 2017-11-25
Sponsored by the Military Commission on Science and Technology (Grant No. 17-163-18-XJ-001-054-01)
Corresponding author: Jie Huang, E-mail: huangmen_2207@qq.com.
Abstract: To solve the special requirements of the high orbit optical remote sensing-satellite for the thermal deformation of the platform, the thermal deformation test and measurement scheme of the satellite platform is designed. Through the comparative analysis of test results, the rationality of the thermal deformation design of the platform structure is verified. The results of thermal deformation measurement show that the maximum deformation of A camera mounting surface is 57.5", and the maximum deformation of B camera mounting surface points to 79.3", which can be used as the basis for thermal deformation prediction of satellite during the orbit operation.
Keywords: remote sensing satellite thermal deformation meteorological satellite
1 Introduction As an important component of our country in the field of satellite for weather forecast, land and water environment detection, disaster prevention and mitigation, and other fields, optical remote sensing satellite has made important contributions. With the continuous development of satellite technology in China, the detection range, resolution and stability of optical remote sensing satellite are more and more demanding[1]. To highly determine the location of each pixel of meteorological satellite, more accurate weather forecasts, the second generation of geostationary orbit meteorological satellite of China uses positioning and image registration techniques for the first time[2]. The thermal deformation factors in many factors are important ones affecting the accuracy of optical remote sensing satellites in orbit detection and image positioning and registration[3-4]. According to the actual research experience, the thermal deformation of the platform, the structure of the camera, the thermal deformation of the mechanism and the installation of thermal deformation of the star sensor are the main components[5-6]. The thermal deformation of the camera can be reduced by using the same material in designing scanning mirror and its shaft[7-8]. Thermal deformation and platform which involves many factors, through material feature matching, low expansion coefficient of carbon fiber materials using can reduce the influence of thermal deformation[9-10]. However, it is necessary to establish accurate ground simulation test to predict the magnitude and regularity of the thermal deformation of satellite platform in orbit[11]. In order to solve the special requirements of a high orbit optical remote sensing satellite for thermal deformation, more accurate thermal deformation of platform structure which causes two camera mounting surface to change, the relative orientation between the two camera mounting surfaces, and then extrapolation of satellite orbit thermal deformation rule, the thermal deformation test of satellite platform is designed. The test simulated the typical working condition of heat flux on the satellite platform, and tested the thermal deformation of two camera mounting surface using digital close range photo-grammetry technology. Based on the comparison and analysis of the thermal deformation measurement results of the platform and the results of simulation analysis, it provides a technical basis for the reasonable prediction of thermal deformation of orbit satellites.
2 Machine Vision Measurement System 2.1 Basic Principles of Machine Vision Digital photogrammetry principle diagram as shown in Fig. 1, the system includes a camera, directional stick, reference meter, signs and auxiliary measuring stick[12-13]. By two cameras in different locations on the same object to shoot, get the measured target more than two different angles of the photograph, which is founded on the body image. Set the object point P(XiYiZi) is composed of i camera station (i light) is the intersection, there are i collinear equation, as shown in Eq.(1)[14-15] :
$\left\{ {\begin{array}{*{20}{l}}{{{\left( {x - {x_0} + \Delta x} \right)}_{ij}} = - {f_j}\frac{{{a_{1j}}\left( {{X_i} - {X_{Sj}}} \right) + {b_{1j}}\left( {{Y_i} - {Y_{Sj}}} \right) + {c_{1j}}\left( {{Z_i} - {Z_{Sj}}} \right)}}{{{a_{3j}}\left( {{X_i} - {X_{Sj}}} \right) + {b_{3j}}\left( {{Y_i} - {Y_{Sj}}} \right) + {c_{3j}}\left( {{Z_i} - {Z_{Sj}}} \right)}}}\\{{{\left( {y - {y_0} + \Delta y} \right)}_{ij}} = - {f_j}\frac{{{a_{2j}}\left( {{X_i} - {X_{Sj}}} \right) + {b_{2j}}\left( {{Y_i} - {Y_{Sj}}} \right) + {c_{2j}}\left( {{Z_i} - {Z_{Sj}}} \right)}}{{{a_{3j}}\left( {{X_i} - {X_{Sj}}} \right) + {b_{3j}}\left( {{Y_i} - {Y_{Sj}}} \right) + {c_{3j}}\left( {{Z_i} - {Z_{Sj}}} \right)}}}\end{array}} \right.$ (1)
Fig.1
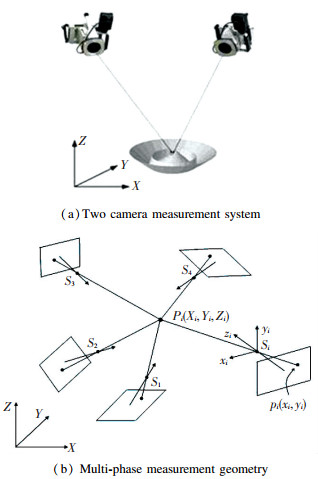 Fig.1 Digital close range photogrammetry principle diagram
 By using the least squares principle, a plurality of light (beam) of the collinear equation (bundle adjustment), the space object point coordinates can be obtained P(XiYiZi), as shown in Eq.(2).
$\left[ {\begin{array}{*{20}{l}}X\\Y\\Z\end{array}} \right] = \mathit{\boldsymbol{M}}\left[ {\begin{array}{*{20}{l}}{{X_i} - {X_{\mathit{Sj}}}}\\{{Y_i} - {Y_{Sj}}}\\{{Z_i} - {Z_{\mathit{Sj}}}}\end{array}} \right]$ (2)
where
$\mathit{\boldsymbol{M}} = \left[ {\begin{array}{*{20}{l}}{{a_{1j}}\;{b_{1j}}\;{c_{1j}}}\\{{a_{2j}}\;{b_{2j}}\;{c_{2j}}}\\{{a_{3j}}\;{b_{3j}}\;{c_{3j}}}\end{array}} \right]$
is rotation matrix, (x? y? z)is the object point corresponding to a plane coordinate, (x0? y0? z0)is the center of the plane, and (Δx ?Δy ?Δz)is plane center offset[16-17].
2.2 Light Spot Center Calculation In order to accurately determine the camera mounting plane, the image processing is firstly processed, and the center of the punctuation is extracted. The algorithm is relatively mature in engineering[14, 18], the Eq.(3) is as follows:
$\begin{aligned}\left(x_{c}, y_{c}\right)=&\left[\sum\limits_{i=0}^{W_{n}-1} \sum\limits_{j=0}^{H_{n}-1} x_{i j} f(i, j) / \sum\limits_{i=0}^{W_{n-1}-1} \sum\limits_{j=0}^{H_{n}-1} f(i, j)\right.\\ &\left.\sum\limits_{i=0}^{W_{n}-1} \sum\limits_{j=0}^{H_{n}-1} y_{i j} f(i, j) / \sum\limits_{i=0}^{W_{n}-1} \sum\limits_{j=0}^{H_{n}-1} f(i, j)\right] \end{aligned}$ (3)
where, f(i, j), xij and yij represent the intensity values of pix(i, j) respectively, x and y are coordinates of the pixel center; Wn is the number of line pixel; Hn is the number of list pixel.
2.3 Calibration of the Visual System Based on Genetic Algorithm In practical engineering application, due to the influence of environmental factors, there will be some deviation from the angle of installation and theoretical angle of the visual camera[19]. If it is not calibrated, the measurement accuracy must be greatly affected. The genetic algorithm relies on probability for iteration, and if the objective function and fitness function are determined it can be used. In theory and engineering field, a large number of applications have been obtained. The calibration of internal and external parameters of the visual camera model is an essentially typical multi-variable optimization problem. Therefore, in this paper the genetic algorithm is used to calibrate the visual measurement system[20].
The mathematical model of genetic algorithm can be expressed as Eq.(4), among them: C is computational fitness, Ф is select operation, E is Fitness function, Г is crossover operation, P0 is initial population, T is end condition and the flowchart is shown in Fig. 2.
$GA = \left( {C, E, {P_0}, M, \mathit{\Phi }, \mathit{\Gamma }, \mathit{\Psi }, T} \right)$ (4)
Fig.2
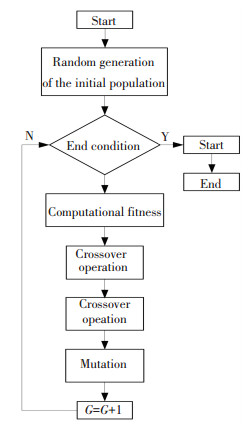 Fig.2 Genetic algorithm flowchart
 During the calibration of the visual camera, the images are compared with the actual scene points in the imaging plane. The actual camera model can be obtained by continuous iteration of genetic algorithm. The stable data of target points can be obtained by calculating the spot center of each frame. Based on its mean value, the projection of each measuring point on the imaging plane is as follows:
$\begin{array}{l}\left\{ {\begin{array}{*{20}{l}}{x_i^* = \frac{{{T_{{\mathop{\rm cam}\nolimits} }} \cdot \left( {{x_{wi}} - \Delta x} \right)}}{{\left( {{z_{mi}} - \Delta z} \right)}} \cdot f \cdot \Delta k}\\{y_i^* = \frac{{{T_{\mathrm{cam}}} \cdot \left( {{y_{wi}} - \Delta y} \right)}}{{\left( {{z_{wi}} - \Delta z} \right)}} \cdot f \cdot \Delta k}\end{array}} \right.\\(i = 1, 2, \ldots , 6)\end{array}$ (5)
where: Tcam is the transformation matrix of the camera reference system; xwi, ywi, zwi are the coordinates of each coordinate point in the ontology coordinate system; Δx, Δy, Δz are camera assembly compensations; f, Δk are the camera focal length and amplification compensation factor; xi*, yi* are the projections onto the plane of the image;
Unfold matrix Tcam:
$\begin{array}{l}{\boldsymbol{T}_{\mathrm{cam}}=\boldsymbol{T}_{z} \cdot \boldsymbol{T}_{x} \cdot \boldsymbol{T}_{y}=\left[\begin{array}{ccc}{\cos \gamma^{*}} & {\sin \gamma^{*}} & {0} \\ {-\sin \gamma^{*}} & {\cos \gamma^{*}} & {0} \\ {0} & {0} & {1}\end{array}\right]} \cdot \\ {\left[\begin{array}{ccc}{1} & {0} & {0} \\ {0} & {\cos \alpha^{*}} & {\sin \alpha^{*}} \\ {0} & {-\sin \alpha^{*}} & {\cos \alpha^{*}}\end{array}\right]\left[\begin{array}{ccc}{\cos \beta^{*}} & {0} & {-\sin \beta^{*}} \\ {0} & {1} & {0} \\ {\sin \beta^{*}} & {0} & {\cos \beta^{*}}\end{array}\right]}\end{array}$ (6)
$\left\{\begin{array}{l}{\alpha^{*}=\alpha+\Delta \alpha} \\ {\beta^{*}=\beta+\Delta \beta} \\ {\gamma^{*}=\gamma+\Delta \gamma}\end{array}\right.$ (7)
where: Tx, Ty, Tz are the rotation matrices around the axis; α, β, γ are the Euler Angle of the rotation of the rotation axis; Δα, Δβ, Δγ are Euler Angle offsets for each installation Angle deviation; α*, β*, γ* are compensations for the modified Euler Angle; and the optimization objective function is:
$S=\sum\limits_{i=1}^{N}\left[\left(x_{i}^{*}-\bar{x}_{i}\right)^{2}+\left(y_{i}^{*}-\bar{y}_{i}\right)^{2}\right]$ (8)
where $\bar{x}_{i}, \bar{y}_{i}$ are the positions of the measurement points of the video data analysis result. The optimal objective Eq.(8) is optimized by genetic algorithm to achieve the objective of visual measuring system.
3 Simulation and Test 3.1 Test Scheme Test and measurement scheme as shown in Fig. 3(a). The satellite is fixed to the dedicated support rack, and the surrounding area is decorated with infrared lamps. Two digital cameras are placed over the satellite platform, which can cover the entire roof. The two camera's foot paste target points are used as the measuring points in the thermal deformation test as shown in Fig. 3(b). The main parameters of the camera are shown in Table 1. The accuracy of the system is 4 μ m+4 μ m/m.
Fig.3
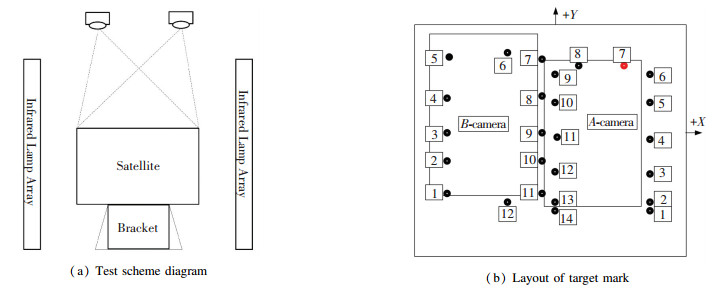 Fig.3 Thermal deformation test and measurement scheme of satellite platform
 表 1
M08 12 μm+12×10-6 59×46 10 f/s 1-10 7×7 10 μs-20 ms 0~+50
Table 1 Main technical parameters of MPS/M high precision measurement camera
3.2 External Heat Flow According to satellite on-orbit outside heat flow condition (vernal equinox 0, vernal equinox 6, summer solstice 0, summer solstice at 6, 12, 18, the typical such as 8.8°), infrared lamp array was placed. By controlling the heat flux density of lamp array in different regions of the satellite in order to satisfy satellite parts temperature level of expected target. The vernal equinox and 8.8° condition outer heat flow applying to the target satellite deck in 24 h was shown in Figs. 4 and 5.
Fig.4
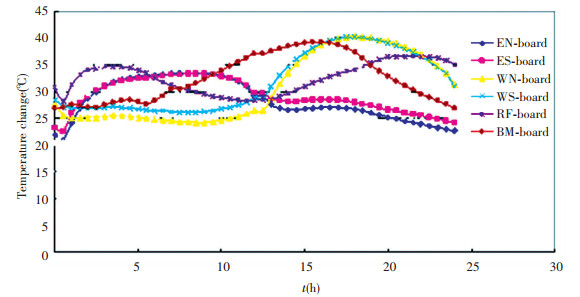 Fig.4 Target temperature field of the spring sub-working condition
 Fig.5
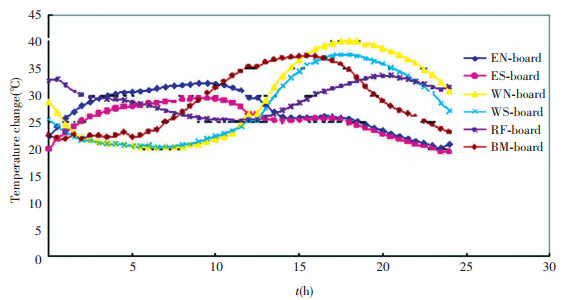 Fig.5 Working condition of 8.8° target temperature field
 3.3 Test and Simulation Comparison Analysis According to the thermal deformation test and measurement scheme designed in this paper, the thermal deformation test was carried out in an optical remote sensing satellite platform. In the experiment, the camera structure and the star sensor bracket were installed on the platform structure roof, simulating the structure of the platform and the rigidity coupling of the camera. In order to avoid the influence of local temperature on satellite electronics products, the single machine adopts the simulation of weights and thermal controls, and the test site is shown in Fig. 6.
Fig.6
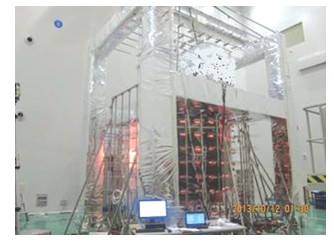 Fig.6 Thermal deformation test diagram
 Under the normal temperature and pressure, the camera mounting face is measured, and the result is used as the basic working condition of the whole thermal deformation test. The heating of the satellite platform is carried out according to the external heat flow conditions of each established working condition. After setting the temperature difference and stable, the installation face of the two cameras was measured by using digital close-range photogrammetry. Use the least square method to fit A camera and B camera installation plane to evaluate the orientation change of the mounting surface, and the fitting plane is shown in Fig. 7.
Fig.7
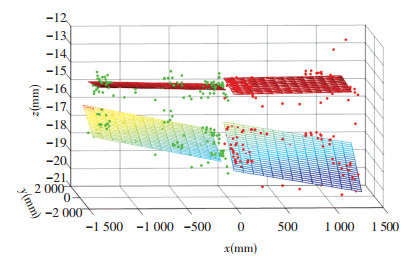 Fig.7 Camera mounting surface measuring point plane
 According to the set of 6 typical operating conditions, repeat the above measurements to complete the data measurement of the whole heat deformation test. The camera mounting surface and two camera pointing measurement results are shown in Table 2. The ground test results show that the maximum deformation of the A camera mounting surface is 57.5 s, and the maximum deformation of the B camera mounting surface is 79.3 s.
表 2
φ θ ψ φ θ ψ φ θ ψ
Mode 1 -56.7 9.2 -2.1 -27.7 -13.8 -11.1 19.5 20.4 14.3
Mode 2 -55.5 79.3 -39.8 -22.7 -32.5 -20.1 18.1 88.3 19.2
Mode 3 -24.1 37.9 -23.6 -31.9 -26.8 -6.4 29.4 91.4 9.7
Mode 4 -26.9 44.9 -21.7 -18.0 -52.1 -13.5 24.3 134.4 11.8
Mode 5 -90.2 42.7 -33.0 -45.9 -57.5 -11.5 10.2 103.4 8.4
Mode 6 -8.5 15.9 -3.7 -33.1 -46.5 -7.4 14.1 51.3 5.8
Table 2 Test results of absolute deformation test of camera mounting surface
At the same time, the thermal deformation condition of the satellite platform is simulated by using 6 typical external heat flow conditions in orbit. The simulation results are shown in Table 3.
表 3
φ θ ψ φ θ ψ φ θ ψ
Mode 1 -11.1 63.1 -15.8 -6.7 -39.1 -6.9 3.8 102.1 8.8
Mode 2 -35.5 99.3 -24.1 -12.8 -53.3 -6.6 22.1 152.5 17.4
Mode 3 -37.1 108.9 -23.1 -18.8 -64.3 -9.6 17.5 173.1 13.4
Mode 4 -38.4 103.1 -22.9 -20.1 -63.7 -9.4 17.5 166.6 13.5
Mode 5 -30.4 83.1 -15.6 -15.5 -48.2 -7.2 14.4 131.2 8.4
Mode 6 -19.2 70.8 -12.1 -9.1 -41.1 -4.6 9.7 111.7 7.5
Table 3 Simulation results of absolute deformation of camera mounting surface
Fig. 8 Compares the φ, θ, ψ angle test and simulation data of B camera relative to A camera.
Fig.8
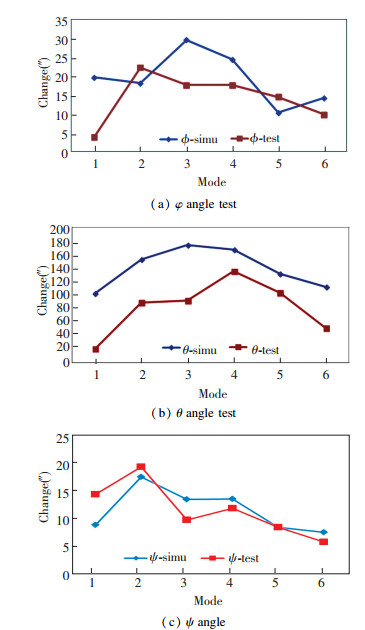 Fig.8 B Camera- A camera φ, θ, ψ angle test and simulation result
 The results show that the simulation results of thermal deformation under the typical temperature field of the platform are consistent with the experimental results. The test results can be used as the basis for further correction of parameters. The experimental results verify the rationality of the thermal deformation design of the platform and provide a basis for the prediction of thermal deformation during the orbit operation.
4 Conclusions Through the thermal deformation test of platform structure, the thermal deformation of the platform under typical temperature is obtained and the simulation results are compared. The results are as follows:
1) The experimental results are consistent with the simulation results, and the rationality of the thermal deformation design of the platform is verified. Then the parameters of simulation model parameters are further corrected.
2) The maximum deformation of A camera mounting surface is 57.5", and the maximum deformation of the installation face of camera B is 79.3", which can be used as basis for prediction of thermal deformation in the early stage of orbit.
However, the experiment still has the following limitations:
1) The temperature gradient setting is used to simulate the relative temperature difference between the structure plate of the satellite platform, which cannot simulate the real temperature boundary of the orbit.
2) The simulation machine only simulates the structural characteristics and the influence of air convection, so that the temperature distribution of satellite temperature field is not enough.
References
[1] Meng Lingjie, Guo Ding, etc. Development status and prospect of high resolution imaging satellite in geostationary orbit. Spacecraft Recovery & Remote Sensing, 2016, 37(4): 1-6. (in Chinese) (
 0)
0)[2] Xu Haiyu, Wang Hao, Shen Yili. Study on GEO satellite image navigation & registration technology and simulation verification. Spacecraft Engineering, 2015, 24(4): 88-93. (in Chinese) (
 0)
0)[3] Jiang Shanping, Yang Linhua, Xu jie, et al. Deformation measurement for satellite antenna by close-range photogrammetry. Electro-Optical and Infrared Systems: Technology and Applications X. Proceedings of SPIE - The International Society for Optical Engineering. Bellingham : SPIE, 2013. 88960W. DOI: 10.1117/12.2027507. (
 0)
0)[4] Rieke-Zapp D H, Tecklenburg W, Peipe J, et al. Performance evaluation of several high-quality digital cameras. IAPRS, 2008, 37(B5): 7-12. (
 0)
0)[5] NOAA/NASA. GEOS-N Data Book. Washington DC: NASA, 2005. (
 0)
0)[6] Gibbs B. GOES image navigation and registration. Integral Systems. Inc Sat Magazine, 2008, 28(7): 68-72. (
 0)
0)[7] Shen Yili, Lv wang, Yu Yongjiang, et al. Research of imager scan mirror thermal distortion model for image navigation and registration. Aerospace Shanghai, 2014, 31(2): 26-29. (in Chinese) (
 0)
0)[8] Huang Longfei, Shang Zhi, Liu Ning. Discussion on method of on-orbit identification of dynamic characteristics for variable structure spacecraft. Spacecraft Engineering, 2015, 24(3): 100-106. (in Chinese) (
 0)
0)[9] Zhang Hongying, Man Xiaoying, Yao Jun. Control of structure thermal deformation based on material optimal design for some satellite. Aerospace Shanghai, 2010(4): 61-64. (in Chinese) (
 0)
0)[10] Ding Yanwei, Wang Xiaogeng, Zhang Lihua. Analysis of thermal-elastic deformation for solar array substrate with CFRP/ Aluminum honeycomb sandwich. Spacecraft Engineering, 2009, 18(4): 44-48. (in Chinese) (
 0)
0)[11] Fang Baodong, Li Yingdian, Zhang Jiang'ang. Thermal structure distortion for some new GEO meteorological satellite. Aerospace Shanghai, 2006(4): 50-53. (in Chinese) (
 0)
0)[12] Pappa R S, Jones T W, Blace J T. Photogrammetry methodology development for gossamer spacecraft structures. Proceedings of the 43rd AIAA/ASME/ASCE/AHS/ASC Structures, Structural Dynamics, and Materials Conference. Washington: NASA, 2002.1-18. (
 0)
0)[13] Florance J P, Burner A W. Contributions of the NASA Langley research center to the DARPA/AFRL/NASA/Northrop Grumman smart wing program. Proceedings of the AIAA Dynamics Specialists Conference. Reston: AIAA, 2003.1-20. (
 0)
0)[14] Huang Guiping, Ma Kaifeng, Wang Caijian. Distortion measurement of satellite antenna in thermal vacuum. Journal of Astronautic Metrology and Measurement, 2014, 34(2): 21-25. (
 0)
0)[15] Zhang Z X, Zhang J Q. Digital Photogrammery. Wuhan: Wuhan University Press, 1997. (in Chinese) (
 0)
0)[16] Li Xudong, Jiang Hongzhi, Zhou Jie, et al. A low-cost antenna reflector shape and distortion measuring system with high accuracy. Proceedings of the Ninth International Symposium on Laser Metrology. Chenggen Quan, Anand Asundi, Proc. of SPIE, Bellingham: SPIE, 2008, 7155: 1-9. (
 0)
0)[17] Ashley Moore. A method for assessing the accuracy of a photogrammetry system for precision deployable structures. Proceedings of the 47th AIAA/ASME/ASCE/AHS/ASC Structures, Structural Dynamics, and Materials Conference. Reston : AIAA, 2006.1-8. (
 0)
0)[18] Ryall T G, Fraser C S. Determination of structural modes of vibration using digital photogrammetry. Journal of Aircraft, 2002, 39(1): 114-120. DOI:10.2514/2.2903 (
 0)
0)[19] Kavzoglu T, Karsli F. Calibration of a digital signal lens reflex (SLR) camera using artificial neural networks. IAPRS, 2008, 36(B5): 27-32. (
 0)
0)[20] Qiu Minjun, Shen Yili, Zhong Weichao. Modal identification method of on orbit flexible satellite based on machine vision. Spacecraft Engineering, 2016, 25(6): 32-39. (in Chinese) (
 0)
0)