A. Saboktakin1, M. Shahrouz1, T. Vu-Khanh2, J. Bicerano3
(1. Department of Mechanical Engineering, University of Sistan and Baluchestan, Zahedan, Iran;2. Department of Mechanical Engineering,école de Technologie Supérieure, Montreal, Que., Canada; 3. Bicerano & Associates Consulting, Savannah, Georgia, USA)
Abstract:
Damage assessments in three dimensional (3D) textile composites subjected to mechanical loading can be performed by non-destructive and destructive techniques. This paper applies the two techniques to investigate the fracture behavior of 3D tufted textile composites. X-ray computed tomography as a non-destructive evaluation method is appropriate to detect damage locations and identify their progression in 3D textile composites. Destructive methods such as sectioning toward observing damage provide valuable information about damage patterns. The results of this research could be utilized to evaluate the initial cause of rupture in 3D tufted composites used in aerospace structures and analyze fracture modes and damage progression.
Key words: X-ray computed tomography damage characterization 3D composite textile preform
DOI:10.11916/j.issn.1005-9113.18126
Clc Number:V19
Fund:
A. Saboktakin, M. Shahrouz, T. Vu-Khanh, J. Bicerano. X-ray Computed Tomography Characterization of 3D Tufted Twill Textile Composite for Aerostructures[J]. Journal of Harbin Institute of Technology (New Series), 2019, 26(3): 7-13. DOI: 10.11916/j.issn.1005-9113.18126.

Corresponding author A. Saboktakin, E-mail: Saboktakin@eng.usb.ac.ir Article history Received: 2018-11-03
Contents Abstract Full text Figures/Tables PDF
X-ray Computed Tomography Characterization of 3D Tufted Twill Textile Composite for Aerostructures
A. Saboktakin1

 , M. Shahrouz1, T. Vu-Khanh2, J. Bicerano3
 1. Department of Mechanical Engineering, University of Sistan and Baluchestan, Zahedan, Iran;
2. Department of Mechanical Engineering, école de Technologie Supérieure, Montreal, Que., Canada;
3. Bicerano & Associates Consulting, Savannah, Georgia, USA
Received: 2018-11-03
Corresponding author: A. Saboktakin, E-mail: Saboktakin@eng.usb.ac.ir
Abstract: Damage assessments in three dimensional (3D) textile composites subjected to mechanical loading can be performed by non-destructive and destructive techniques. This paper applies the two techniques to investigate the fracture behavior of 3D tufted textile composites. X-ray computed tomography as a non-destructive evaluation method is appropriate to detect damage locations and identify their progression in 3D textile composites. Destructive methods such as sectioning toward observing damage provide valuable information about damage patterns. The results of this research could be utilized to evaluate the initial cause of rupture in 3D tufted composites used in aerospace structures and analyze fracture modes and damage progression.
Keywords: X-ray computed tomography damage characterization 3D composite textile preform
1 Introduction In the last decade, there has been high demand for textile composites because of their light weight, high specific strength, and stiffness. Textile composites are fabricated by dry textile fabrics with different configurations such as two or three dimensional (2D or 3D) woven, braiding, knitting, and stitching[1-2]. Compared with conventional stitching techniques which require access to both fabrics sides, tufting techniques only need one side of fabrics. In fact, tufting stitch is a new common type of one-sided stitching technique, in which the formation of loops is done by a tension-free stitching thread. These 3D fabrics are placed in a mold and then impregnated by resin using resin transfer molding or vacuum assisted resin transfer molding techniques. 3D textile composites have certain advantages over 2D textile composites, including improved damage tolerance, delamination resistance, and so on. 3D textile preforms have been mostly developed by the aerospace industry for structural applications such as nozzles, rockets, Orion capsule, wing panels, and landing gear, in which failures could be generated from manufacturing defects or in-service induced damages. Damage accumulation can degrade the performance of a textile composite material to the point where the composite cannot be safely used for an aerospace structure[3-4].
For instance, the performance of composite materials under high temperature environments and its damage accumulation are important issues which assist to assess the performance of 3D composites for specific applications such as aerospace components[5].
Among different types of 3D composites, 3D woven composites have high capability to prevent the formation of transverse cracks and delaminations compared with 2D laminated composites[6]. For example, 3D woven composites under quasi-static loading may cause cracks and micro damages in boundary between fiber bundles, damages in the yarns, debonding damages at the boundary of yarn and matrix until the composites fail.
Damages in preforms may occur in various forms, including fiber distortion, fiber misalignment, and broken fibers. Textile preforms and composites are inhomogeneous structures and their characterizations are quite different from those of other composites[7]. Textile composites impose a challenge to non-destructive evaluation (NDE) procedures because of their nature which represents a very anisotropic medium[8-9].
For instance, diffraction of the ultrasonic field in textile composites could occur due to specific intrinsic textile composite parameters such as tow sizes, layup configuration, surface roughness, and external stitching[10-11].
Among NDE techniques, the X-ray computed tomography (CT) can be useful to recognize very small damages in 3D composites.
X-ray CT focuses X-ray beam to 10-micron spot size and a series of typical 360 to 720 radiographs. These radiographs are taken by rotating the object to one axis. The resulting data is reconstructed in software to produce a 3D image of the component that can be viewed through any image plane. Micro tomography could create cross-sections of a 3D preform that can be used to observe the internal geometry of the preform and textile composite. The capability to determine the damage in X-ray images is highly dependent on the resolution of the X-ray image, while sample size restricts the achievable level of desired optimal resolution[12-14]. According to the literature, the resolution of composite materials has few pixels.
For instance, a 20 μm resolution may not be adequate to determine the micro structural features of 3D composites with 20 mm in width. However, features in micro scales can be achieved if the X-ray images have adequate contrast and some previous studies focused on the increase of the contrast for X-ray CT images[15].Therefore, more investigations should be made on NDE methods to study composite materials.
This paper devotes to assess the structural integrity of 3D tufted textile composites by combining destructive and non-destructive techniques. In Section 2, non-destructive techniques including X-ray CT are used to detect significant manufacturing defects such as voids and fabric misalignment. In Section 3, X-ray techniques and optical microscopy are applied to characterize the microstructural variations of the damages in tufted composites and recognize failure modes.
2 Materials and Experimental Equipment The preforms were composed of eleven layers of twill woven glass fabrics with a quasi-isotropic lay-up of [0/45/90/45/90/45/90/45/90/45/0], in which each preform has a total thickness of 5 mm. The woven fabrics have the areal weight of 305 g/m2. The tufting row was oriented at 0° direction with a tufting spacing of 8 mm and a pitch of 8 mm.
Fig. 1 shows the sketch of the tufted preform which presents a tufting configuration with polyester thread. The scanning electron microscope (SEM) image of the preform is shown in Fig. 2.
Fig.1
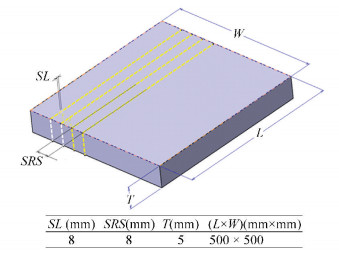 Fig.1 Schematic image of tufting thread arrangement
 Fig.2
 Fig.2 Images of tufted perform before resin impregnation
 These fabrics were tufted with a twisted 240 Tex polyester thread using a KUKA 6-axis robot head equipped with a commercial tufting head at CTT Group Center in Canada.
To fabricate composites, the preforms were impregnated by using the vacuum process with polyester resin at the company of BHS Composites in Canada. The compression load applied to preforms during resin impregnation resulted in tow flattening and a decrease of preform thickness as shown in Fig. 3.
Fig.3
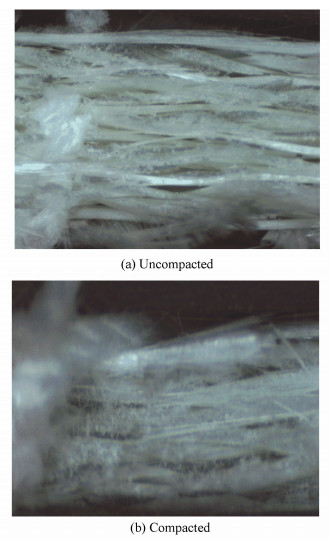 Fig.3 Cross-sections of preforms: uncompacted and compacted
 The panel thickness of the tufted composites was 2.5 mm with a fiber volume fraction around 62%. The microscopic and SEM cross-sectional images of the composites are depicted in Fig. 4.
Fig.4
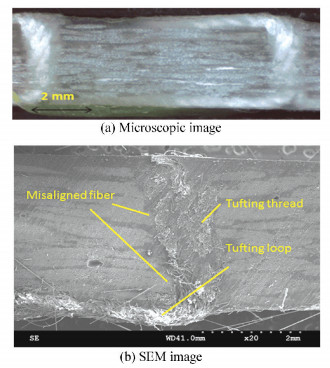 Fig.4 Cross-sections of tufted composites
 Microstructural analysis of the tufted composites using optical microscopy at different magnifications was carried out by preparing small cross-sectional samples. However, being destructive, these techniques were inefficient in preparing large numbers of small samples.
X-ray micro CT scanning of the tufted samples was conducted using a commercial scanner at Jesse Garant & Associates Company in Canada. The machine consists of a micro focus X-ray tube at 36 kV with spot size of 0.005 mm and 2376 projections. The sample size of 20 mm×20 mm was prepared from each composite plate to provide high resolution scanning around 0.045 mm. The scanner created 2D X-ray images of the samples, and then a specific software program was used to construct 3D X-ray images. The 3D CT data were analysed using the Volume Graphics software for damage characterization purposes.
3 Results and Discussion After impregnating the tufted preforms with polyester resin, the samples were inspected to verify quality and complete resin impregnation. X-ray tomography can be used as an efficient technique to optimize the tufting parameters relevant to the tufting process. The 3D micro X-ray image of the tufted composite as shown in Fig. 5 revealed voids and porosity.
Fig.5
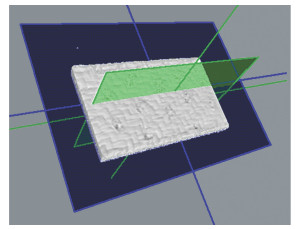 Fig.5 3D volumetric model of tufted composite with the dimension of 25 mm×20 mm
 In the reconstructed 3D image as shown in Fig. 6, the preform appears in grey, the matrix appears in dark color, and voids and porosity appear with white circular shapes. Changing the gray scale density of the cross-sectional images, clearer view of the void size and locations inside impregnated preforms was obtained.
Fig.6
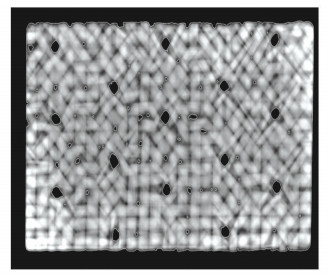 Fig.6 Planar X-ray image of tufted composite with the dimension of 25 mm×20 mm
 As shown in Fig. 6, the results of X-ray CT demonstrate that this technique could definitely detect the orientation of each layer. Fiber misalignment around ±20° in the tufting region shown in Fig. 7 could influence the mechanical performance and become a potential region of damage initiation.
Fig.7
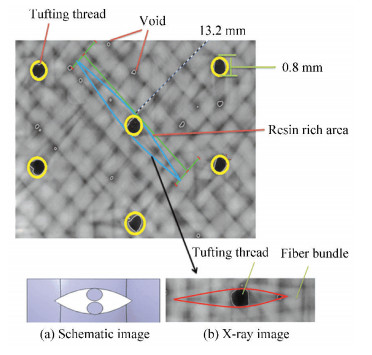 Fig.7 Fiber distortion due to tufting
 At the initial stage of static loading, when the tensile loading exceeded a threshold value of 3 kN, damage appeared in the surface of the composite in the proximity of the tufting thread region. Samples with transverse tufting usually ruptured along the tufting lines while those with longitudinal tufting ruptured in angular direction to the tensile loading direction as shown in Fig. 8.
Fig.8
 Fig.8 Microscopic images of delamination crack for tufted compoiste
 Damages were initiated from the tufting thread region, and the largest damages prior to full rupture were observed at the top and bottom surfaces. The appearance of these damages including delamination and transverse cracks near the surface of the samples decreased the stiffness. As shown in Fig. 9(a), the largest damages including delamination and fiber fractures occurred at the center of the composite in the fractured tufted specimen. Figs. 9(b)-(c) show the cross-sectional X-ray images corresponding to moving the cutting plane in thickness direction of open-hole composite sample stopped at 80% of failure strength.
Fig.9
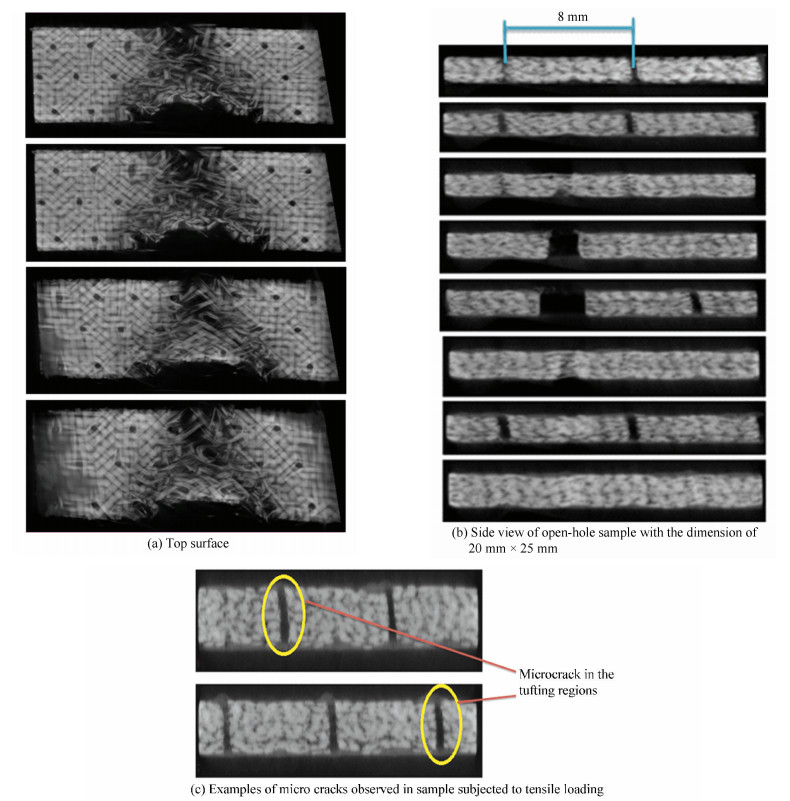 Fig.9 Reconstructed 2D images of fractured specimen in static tension test
 Fig. 10 shows the microscopic image of composites under fatigue loading. At the beginning of the loading, failure occurred at the interface between the layers of the laminated specimens. While for the tufted specimens, tufting threads were observed preventing the complete separation of layers. Upon continued loading, some tufting threads ruptured at the interface and were subsequently pulled out. Ultimately, the sample failed in the form of fiber and thread breakages as the delamination damage propagated.
Fig.10
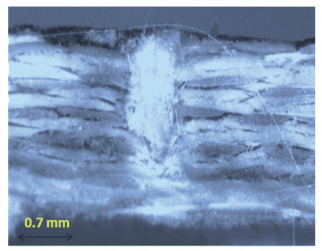 Fig.10 Optical image of micro crack in side of tufted composite under fatigue test
 It can also be observed in SEM images that the fatigue damage progressed in the form of micro crack through the composite. The delamination cracks were seen in all fatigue specimens at the first inspection interval stopped at cycle 1000. The number and extent of such delamination cracks increased as the tests progressed.
X-ray CT images of the ruptured sample in compression test (Fig. 11) clearly demonstrate that shear failure happened and the fabrics moved from their original direction near to the tufting thread. With respect to the obtained X-ray images, specimen rupture tended to occur by the combination of most significant damages including fiber breakage and transverse shear. The tufting thread decreased delamination but increased kink banding and fiber misalignment and out-of-plane waviness. While shear failure and kink bands damages commenced in the vicinity of the tufting thread, no precise correlation could be proved between them.
Fig.11
 Fig.11 Top and side X-ray images of ruptured sample in compression test
 X-ray CT is the best NDE technique for studying layers orientations in textile. Owing to high resolution CT, local fiber misalignment caused by tufting thread was observed in the X-ray images. However, small size of sample was a limiting factor to observe whole sample.
4 Conclusions Microscopic examination at different magnifications was utilized to investigate the intrinsic damage in 3D tufted composites before and after loading. Microscopic evaluation of tufted composites provides a valuable basis for characterizing damages during loading process. X-ray images make it possible to recognize manufacturing defects (i.e., voids and porosity, fabric orientation) and characterize the locations of the damages.
Transverse crack, debonding, and delamination are major damages in composites during mechanical loading. During static and fatigue loadings of tufted composites, the delamination damage was seen by tufting thread, and resin-rich regions were the first locations of damage initiation especially during compression loading.
References
[1] Poe C C, Dexter H B, Raju I S. Review of the NASA textile composites research. Journal of Aircraft, 1999, 36(5): 876-884. DOI:10.2514/2.2521 (
 0)
0)[2] Dow M B, Benso Dexter H. Development of stitched, braided and woven composite structures in the ACT program at langley research center (1985 to 1997). 1997.NASA/ TP-97-206234. (
 0)
0)[3] Grandt Jr A F. Fundamentals of Structural Integrity: Damage Tolerant Design and Nondestructive Evaluation. Hoboken: John Wiley and Sons, 2004. (
 0)
0)[4] Goranson G. Damage Tolerance: Facts and Fiction. Sweden: Boeing Commercial Airplane Group, 2007. (
 0)
0)[5] Wilkinson M P, Ruggles-Wrenn M B. Fatigue of a 3D orthogonal non-crimp woven polymer matrix composite at elevated temperature. Applied Composite Materials, 2017, 24(6): 1405-1424. DOI:10.1007/s10443-017-9597-5 (
 0)
0)[6] Bogdanovich A E, Karahan M, Lomov S V, et al. Quasi-static tensile behavior and damage of carbon/epoxy composite reinforced with 3D non-crimp orthogonal woven fabric. Mechanics of Materials, 2013, 62: 14-31. DOI:10.1016/j.mechmat.2013.03.005 (
 0)
0)[7] Tong L, Mouritz A P, Bannister M K. 3D Fibre Reinforced Polymer Composites. London: Elsevier Science Ltd., 2002. (
 0)
0)[8] Purslow D. Some fundamental aspects of composites fractography. Composites, 1981, 12(4): 241-247. DOI:10.1016/0010-4361(81)90012-4 (
 0)
0)[9] Purslow D. Composites fractography without an SEM: The failure analysis of a CFRP I-beam. Composites, 1984, 15(1): 43-48. DOI:10.1016/0010-4361(84)90960-1 (
 0)
0)[10] Randolf H, Theobald F, Norman U. X-ray based methods for non-destructive testing and material characterization. Nuclear Instruments and Methods in Physics Research Section A: Accelerators, Spectrometers, Detectors and Associated Equipment, 2008, 591(11): 14-18. DOI:10.1016/j.nima.2008.03.016 (
 0)
0)[11] Mal A K, Yin C C, Bar-Cohen Y. Ultrasonic nondestructive evaluation of cracked composite laminates. Composites Engineering, 1991, 1(2): 85-101. DOI:10.1016/0961-9526(91)90029-R (
 0)
0)[12] Maire E, Withers P J. Quantitative X-ray tomography. International Materials Reviews, 2014, 59(1): 1-43. DOI:10.1179/1743280413Y.0000000023 (
 0)
0)[13] Rinaldi R G, Blacklock M, Bale H, et al. Generating virtual textile composite specimens using statistical data from micro-computed tomography: 3D tow representations. Journal of the Mechanics and Physics of Solids, 2012, 60(8): 1561-1581. DOI:10.1016/j.jmps.2012.02.008 (
 0)
0)[14] Straumit I, Lomov S V, Wevers M. Quantification of the internal structure and automatic generation of voxel models of textile composites from X-ray computed tomography data. Composites Part A: Applied Science and Manufacturing, 2015, 69: 150-158. DOI:10.1016/j.compositesa.2014.11.016 (
 0)
0)[15] Yu B, Bradley R S, Soutis C, et al. 2D and 3D imaging of fatigue failure mechanisms of 3D woven composites. Composites Part A: Applied Science and Manufacturing, 2015, 77: 37-49. DOI:10.1016/j.compositesa.2015.06.013 (
 0)
0)