Chunhui Cao1,2, Jian Zhang1, Chuanzheng Yang1,Baojia Xia1
(1.Shanghai Institute of Microsystem of Information Technology, Shanghai 200050, China;2.University of Chinese Academy of Sciences, Beijing 100049, China)
Abstract:
After describing research status of super-structure for Li(Ni1/3Co1/3Mn1/3)O2, diffraction patterns of Li(Ni1/3Co1/3Mn1/3)O2 in different order parameters have been researched by Powder-cell program, including crystal structure, X-ray and neutron diffraction pattern, anomalous diffraction pattern and comparison of Ni Co Mn in different positions. The influence of order parameters on intensity of matrix and super-lattice diffraction lines has also been analyzed and the summarization and prospect have been made lastly.
Key words: Li(Ni1/3Co1/3Mn1/3)O2 order-disorder diffraction
DOI:10.11916/j.issn.1005-9113.17009
Clc Number:O721
Fund:
Chunhui Cao, Jian Zhang, Chuanzheng Yang, Baojia Xia. Theoretic Diffraction Research on the Order-Disorder Effect of Transition Metal in Li(Ni1/3Co1/3Mn1/3)O2[J]. Journal of Harbin Institute of Technology (New Series), 2018, 25(6): 78-89. DOI: 10.11916/j.issn.1005-9113.17009.

Fund Sponsored by the National Key Research and Development Program(Grant No.2016YFB0100500) Corresponding author Jian Zhang, E-mail: zjskycn@163.com Article history Received: 2017-01-19
Contents Abstract Full text Figures/Tables PDF
Theoretic Diffraction Research on the Order-Disorder Effect of Transition Metal in Li(Ni1/3Co1/3Mn1/3)O2
Chunhui Cao1,2, Jian Zhang1

 , Chuanzheng Yang1, Baojia Xia1
 1. Shanghai Institute of Microsystem of Information Technology, Shanghai 200050, China;
2. University of Chinese Academy of Sciences, Beijing 100049, China
Received: 2017-01-19
Fund: Sponsored by the National Key Research and Development Program(Grant No.2016YFB0100500)
Corresponding author: Jian Zhang, E-mail: zjskycn@163.com
Abstract: After describing research status of super-structure for Li(Ni1/3Co1/3Mn1/3)O2, diffraction patterns of Li(Ni1/3Co1/3Mn1/3)O2 in different order parameters have been researched by Powder-cell program, including crystal structure, X-ray and neutron diffraction pattern, anomalous diffraction pattern and comparison of Ni Co Mn in different positions. The influence of order parameters on intensity of matrix and super-lattice diffraction lines has also been analyzed and the summarization and prospect have been made lastly.
Key words: Li(Ni1/3Co1/3Mn1/3)O2 order-disorder diffraction
1 Introduction Due to its high cost and toxicity, commercial cathode material LiCoO2 in lithium ion batteries is gradually replaced by Li(Ni, Co, Mn)O2, among which Li(Ni1/3Co1/3Mn1/3)O2 is the most competitive for its over-all properties[1-4]. All of these cathode materials have a rhomboidal structure with trigonal symmetry (space group: R-3m, No.166), which is layer-structural with α-NaFeO2. Usually, transition metal ions Me (Ni, Co, Mn) are located in octahedral 3b (0 0 1/2) sites and oxygen anions are in a cubic close-packing, occupying the 6c(0 0 z) sites. Lithium cations reside at Wyckoff 3a(0 0 0) sites, represented as [Li]3a[Me]3b[O2]6c. In addition, there are three symmetry operations in this structure, including (0, 0, 0), (1/3, 2/3, 2/3), (2/3, 1/3, 1/3).
Since the discovery of Li(Ni1/3Co1/3Mn1/3)O2, the arrangement of transition metal in 3b is the key point of contention[5-10]. At present, there are three supposed models for it. The first model, as illustrated in Fig. 1(a), consists of [Co1/3Ni1/3Mn1/3]O2 slabs of the [
Fig.1
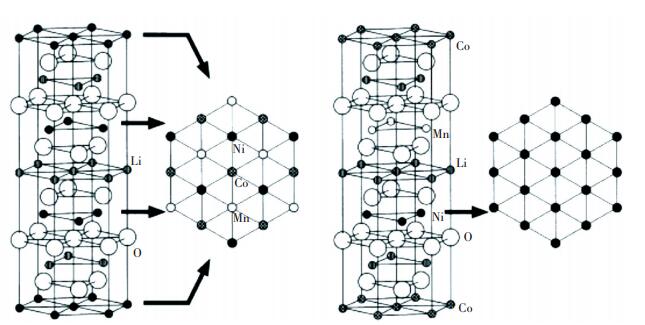 Fig.1 Structural model of Li(Ni1/3Co1/3Mn1/3)O2(Reprinted with permission from Koyama et al.[11] Copyright 2003, Elsevier)
 The formation energy of the super-lattice model calculated by Koyama et al.[11] was -0.17 eV per formula unit, and that of stacking model was +0.06 eV. So it is more possible that the super-lattice model exists, which restricts the volume change of cathode between charging and discharging and improves cycling life due to the stable lattice structure. Through XRD refinement, Yabuuchi et al.[11] found that the [
Fig.2
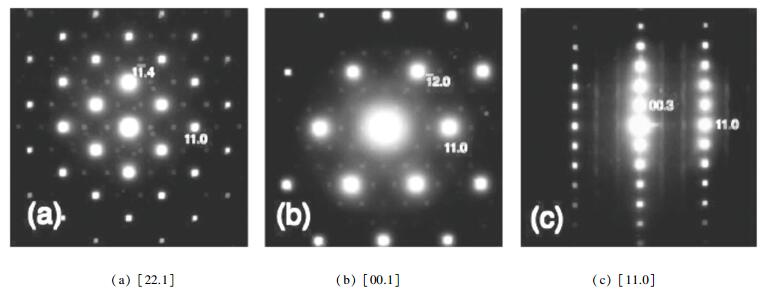 Fig.2 Electron diffraction patterns of Li(Ni1/3Co1/3Mn1/3)O2(Reprinted with permission from Yabuuchi et al.[12] Copyright 2005, the Electrochemical Society)
 Although the arrangement of inner atom in Li(Ni1/3Co1/3Mn1/3)O2 can be verified by calculation and detection, it cannot be proved that this material has the completely orderly arrangement[13-17] in Fig. 1(a). Whitfield[18] studied the structure of Li(Ni1/3Co1/3Mn1/3)O2 by neutron(as shown in Fig. 3) and anomalous dispersion powder diffraction and found a random distribution of Mn, Ni, and Co over the R3m 3b sites. Rietveld analyses(as shown in Table 1) indicated that about 2% nickel migrated from 3b site to 3a site due to the similar atomic radius of Ni2+ (rNi2+=0.69 ?) and Li+ (rLi+=0.76 ?), which was also called cation disorder. The more Ni2+cations in Li+ layer, the harder deintercalate-intercalate of Li+, so the electrochemical performances became worse.
Fig.3
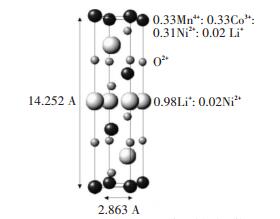 Fig.3 The crystal structure of Li(Ni1/3Co1/3Mn1/3)O2 (Reprinted with permission from Whitfield et al.[18] Copyright 2005, Elsevier)
 表 1
Li+ 3a 0 0 0 0.9781 1.236
Ni2+ 3a 0 0 0 0.0213 0.429
Li+ 3b 0 0 0.500 0.0242 1.236
Ni2+ 3b 0 0 0.500 0.3092 0.429
Co3+ 3b 0 0 0.500 0.3320 0.429
Mn4+ 3b 0 0 0.500 0.3346 0.429
O2- 6c 0 0 0.259 1.0000 0.663
Table 1 The occupation of atoms for Li(Ni1/3Co1/3Mn1/3)O2 after refinement(Data from whitfield et al.[18]
The super lattice diffraction lines may appear after ordering treatment the order degree has an effect on the diffraction intensity of super lattice line; sometimes the super lattice diffraction lines do not appear but the diffraction intensity of matrix diffraction lines change[19-22]. So we can calculate the order degree by diffraction intensity data, which depends on the crystal structure[23]. In this paper Powder-cell was used to simulate diffraction patterns and intensity of the super and matrix lattices.
2 Crystal Structure It was supposed that theorder degree S, was 0, 0.5 and 1. Space group was No.166, R3m, a=2.963, c=14.252, the atom positions[24] are shown in Table 2. When S was 0, Ni, Co and Mn were randomly occupied in (0, 0, 1/2), (1/3, 2/3, 7/6) and (2/3, 1/3, 5/6), whose occupancy(SOF) were 1/3. When S was 1, Ni, Co and Mn were orderly occupied respectively in (0, 0, 1/2), (1/3, 2/3, 7/6) and (2/3, 1/3, 5/6), whose SOF were 1.0. When S was 0.5, it became complicated. Ni, Co and Mn were occupied in (0, 0, 1/2), (1/3, 2/3, 7/6) and (2/3, 1/3, 5/6) by order degree of 0.5. At the same time, they were occupied in 3b site by SOF=0.5×0.333=1/6. The crystal structure model was illustrated in Fig. 4.
表 2
Li 3 Li 3a 0 0 0 1.00 1.236
Ni 28 Ni 3b 0 0 1/2 1/3 0.429
0.0 Co 27 Co 3b 0 0 1/2 1/3 0.429
Mn 25 Mn 3b 0 0 1/2 1/3 0.429
O 8 O 6c 0 0 1/4 1.00 0.663
Li 3 Li 3a 0 0 0 1.00 1.236
Ni 28 Ni 0 0 1/2 1/2 0.429
Co 27 Co 1/3 2/3 7/6 1/2 0.429
0.5 Mn 25 Mn 2/3 1/3 5/6 1/2 0.429
Ni 28 Ni 3b 0 0 1/2 1/6 0.429
Co 27 Co 3b 0 0 1/2 1/6 0.429
Mn 25 Mn 3b 0 0 1/2 1/6 0.429
O 8 O 6c 0 0 1/4 1.00 0.663
Li 3 Li 3a 0 0 0 1.00 1.236
Ni 28 Ni 3b 0 0 0.50 1.00 0.429
1.0 Co 27 Co 3b 1/3 2/3 7/6 1.00 0.429
Mn 25 Mn 3b 2/3 1/3 5/6 1.00 0.429
O 8 O 6c 0 0 1/4 1.00 0.663
Table 2 The atom positions in different order degree
Fig.4
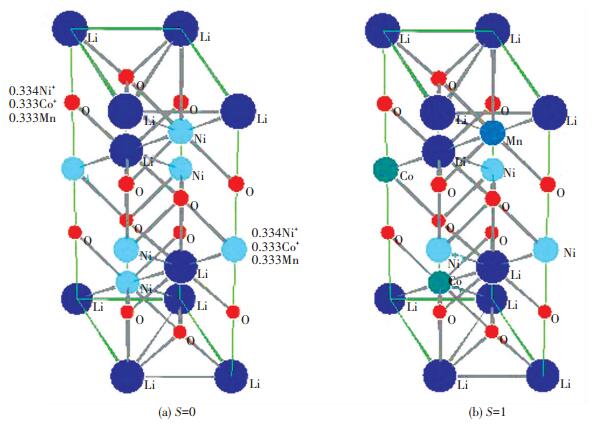 Fig.4 The crystal structure model of Li(Ni1/3Co1/3Mn1/3)O2 when S was 0 and 1
 3 X-ray and Neutron Diffraction Pattern Figs. 5 and 6 show the diffraction patterns of X-ray and neutron at different S, and the specific data is listed in Table 3. As we can infer from the comparison data, there are obvious difference between the XRD pattern and neutron diffraction pattern. Three strength lines are distinct, the first strength line is different. The second strength lines decrease with the increase of S, but the third lines are almost constant. This is because that the scattering factors of Ni, Co, Mn have little difference for X-ray, while the difference for neutron is much larger. So the problem of order occupying position of neighboring atom is often studied by neutron diffraction[7].
Fig.5
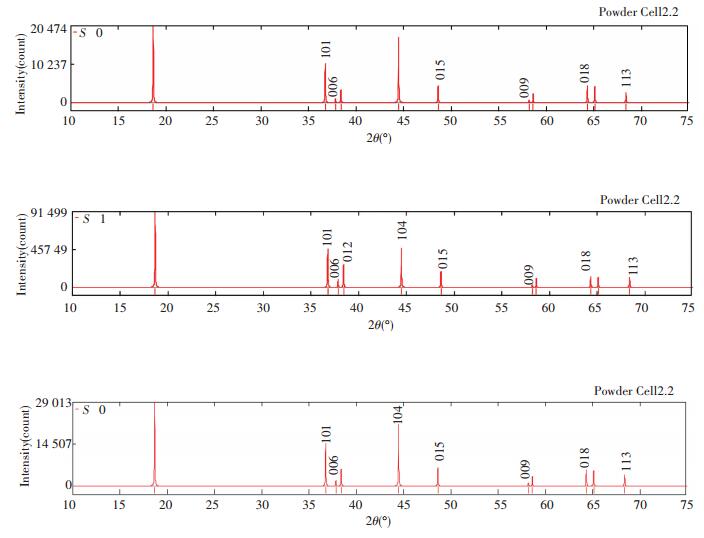 Fig.5 XRD patterns of Li(Ni1/3Co1/3Mn1/3)O2 at S=0, 0.5 and 1 (λ=1.540 6 ?)
 Fig.6
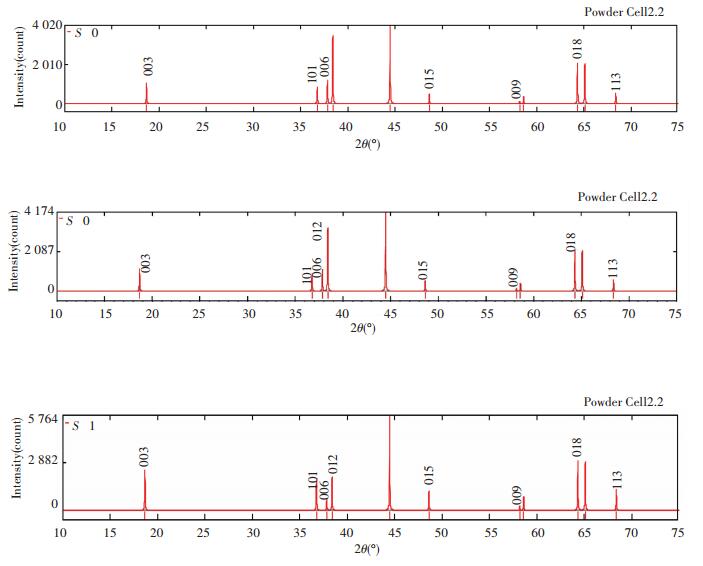 Fig.6 Neutron diffraction patterns of Li(Ni1/3Co1/3Mn1/3)O2 at S=0, 0.5 and 1 (λ=1.540 6 ?)
 表 3
S=0 S=0.5 S=1.0
X-ray Neutron X-ray Neutron X-ray Neutron
003 4.750 670 18.663 0 100.00 26.69 100.00 28.29 100.00 42.42
101 2.442 740 36.763 0 51.14 21.04 51.08 22.31 50.78 33.65
006 2.375 330 37.845 0 5.66 29.82 6.91 27.39 10.21 11.93
012 2.341 730 38.409 0 16.38 89.90 19.97 79.83 29.41 34.74
104 2.035 160 44.481 0 84.84 100.00 73.82 100.00 51.24 100.00
015 1.887 073 48.632 0 21.47 12.30 21.46 13.06 21.24 19.80
009 1.583 560 58.213 0 3.89 2.94 3.89 3.12 2.87 4.76
107 1.573 480 58.622 0 11.40 8.71 11.39 9.26 11.32 14.10
018 1.446 770 64.339 0 22.18 51.93 19.48 51.93 13.90 52.02
110 1.431 500 65.110 0 21.20 50.91 18.64 50.93 13.32 51.02
113 1.370 630 68.138 9 13.32 13.31 13.32 14.13 13.22 21.69
Table 3 Relative diffraction intensity of X-ray and neutron at different S (λ=1.540 6 ?)
4 Comparison of Ni, Co, Mn Occupied in Different Positions The diffraction data was listed in Table 4 when S=1 and Ni, Co and Mn occupied in different position. It is known from the comparison that three strength distribution and relative intensities are the same and their structure amplitudes are similar.
表 4
Co
Mn 0
1/3
2/3 0
2/3
1/3 1/2
7/6
5/6 Co
Mn
Ni 0
1/3
2/3 0
2/3
1/3 1/2
7/6
5/6 Mn
Ni
Co 0
1/3
2/3 0
2/3
1/3 1/2
7/6
5/6
I./I0(%) |F(hkl)| I./I0(%) |F(hkl)| I./I0(%) |F(hkl)|
003 4.750 67 18.663 100.00 131.94 100.00 125.55 100.00 135.13
101 2.442 74 36.893 58.25 119.22 57.93 113.12 58.46 122.31
006 2.375 33 37.845 11.80 95.94 11.42 89.88 11.98 99.02
012 2.341 73 38.536 32.85 93.96 31.76 87.91 33.41 97.04
104 2.035 16 44.592 56.44 145.09 57.39 139.22 56.06 148.09
015 1.870 73 48.735 27.15 111.32 26.97 105.58 27.27 114.27
009 1.583 56 58.213 5.33 104.76 5.29 99.37 5.35 107.57
107 1.573 48 58.713 10.45 85.38 10.13 80.00 10.62 88.18
018 1.446 77 64.425 14.94 113.20 15.04 108.06 14.93 115.90
110 1.431 50 65.366 14.81 114.18 14.93 109.06 14.79 115.86
113 1.370 63 68.640 13.65 81.62 13.29 75.65 13.86 84.24
Table 4 Diffraction data when Ni, Co and Mn occupy in different positions (λ=1.540 6 ?)
5 Anomalous X-ray Diffraction Pattern The anomalous diffraction is a diffraction experiment one using the radiation of some element's absorbing wavelength as incident ray, called as the anomalous scattering or anomalous diffraction, which is also called diffraction of choosing elements.
When there is anomalous diffraction, the total atomic scattering factor is given by:
${f_{\left( {S,\lambda } \right)}} = {f_{0\left( S \right)}} + {{f'}_{\left( {S,\lambda } \right)}} + {\rm{i}}{{f''}_{\left( {S,\lambda } \right)}}$ (1)
where f' and f" are the real and imaginary parts of anomalous diffraction correction, f' and f0 have the opposite phases, the phase of f" is 90°. And f is:
$f = \sqrt {{{\left( {{f_0} + f'} \right)}^2} + {{\left( {f''} \right)}^2}} $ (2a)
The approximate form is:
$f = {f_0} + f' + \frac{1}{2}\frac{{{{\left( {f''} \right)}^2}}}{{{f_0} + f'}}$ (2b)
The effects of anomalous diffraction on total scattering factor are as follows:
1) Anomalous diffraction can be ignored when the incident ray's wavelength is far from absorbing limit;
2) Near the absorption limit, anomalous scattering correction is quite large and increases with the scattering angle;
3) When the incident ray's wavelength is equal to absorption limit, anomalous diffraction can play a dominant position at high diffraction angles;
4) Anomalous diffraction correction is related to the atom number of the scattered due to different element has different absorbing limit.
So we can study the long range order of neighboring atoms by anomalous diffraction in principle. As seen from Table 5, the position of diffraction lines increases with the wavelength and moves to the high angle, while the relative intensity has no change. It seems that anomalous diffraction has no effect, but actually possible cause is that Powdercell could not carry out the correction of the anomalous scattering.
表 5
Ni absorbing limit is 1.488 01 CuKα radiation is 1.540 56 Co absorbing limit is1.608 2 Mn absorbing limit is 1.896 4Ni absorbing limit is 1.488 1 CuKα radiation is 1.540 56 Co absorbing limit is 1.608 2 Mn absorbing limit is 1.896 4
003 4.750 67 18.021 18.663 19.489 23.027 100.00 100.00 100.00 100.00
101 2.442 74 35.592 36.893 38.573 45.846 51.12 50.78 50.33 48.35
006 2.375 33 36.508 37.845 39.572 47.055 10.28 10.21 10.11 9.69
012 2.341 73 37.171 38.536 40.295 47.931 29.63 29.41 29.12 27.87
104 2.035 16 42.994 44.592 46.660 55.682 51.76 51.24 50.58 47.84
015 1.870 73 46.971 48.735 51.021 61.046 21.58 21.24 21.01 19.79
009 1.583 56 56.049 58.213 61.030 73.566 3.92 3.87 3.80 3.64
107 1.573 48 56.527 58.713 61.559 74.238 11.48 11.32 11.13 10.67
018 1.446 77 61.980 64.425 67.618 82.019 14.08 13.90 13.71 13.65
110 1.431 50 62.877 65.366 68.620 83.321 13.49 13.32 13.14 13.18
113 1.370 63 65.993 68.640 72.106 87.901 13.36 13.22 13.09 13.62
Table 5 Comparison of anomalous diffraction data at S=1
6 Influence of Order Degree on Intensity of Matrix Diffraction The analysis shows that the order of Ni, Co and Mn in the 3b position has little effect on the matrix diffraction relative intensity for both the conventional and anomalous X-ray diffraction.
Under symmetric Bragg reflection geometry condition in the X-ray powder diffraction, the relative integral intensity for single-phase can be expressed as follows:
${I_{hkl}} = {P_{hkl}}{\left| {{F_{hkl}}} \right|^2}\frac{{1 + {{\cos }^2}2{\theta _{hkl}}}}{{{{\sin }^2}{\theta _{hkl}}\cos {\theta _{hkl}}}}$ (3)
where Phkl is the multiplicity factor of crystal plane (hkl), Fhkl is structure factor, the last is angle factor. The formula of structure factor is:
$\begin{array}{l}{F_{hkl}} = \sum\limits_{j = 1}^n {{f_j}{e^{2{\rm{ \mathsf{ π} i}}\left( {h{x_j} + h{y_j} + l{z_j}} \right)}}} = \sum\limits_{j = 1}^n {{f_j}\left[ {\cos 2{\rm{ \mathsf{ π} }}\left( {h{x_j} + k{y_j} + } \right.} \right.} \\\;\;\;\;\;\;\;\;\;\left. {\left. {l{z_j}} \right) + {\rm{i}}\sin 2{\rm{ \mathsf{ π} }}\left( {h{x_j} + k{y_j} + l{z_j}} \right)} \right]\end{array}$ (4)
where fj is the scattering factor of j atom. xj, yj, zj is the coordinate of j atom. Summation is for all atoms in single cell. Specifically for Li(Ni1/3Co1/3Mn1/3)O2, they contain 3 Li atoms, 3 transition metal atoms and 6 oxygen atoms. The position parameters of main diffraction lines are listed in Table 6.
表 6
003 101 006 012 104 015 009 107 018 110 113
100 40 12 15 95 18 9 20 25 25 13
3a 0 0 0 +1 +1 +1 +1 +1 +1 +1 +1 +1 +1 +1
2/3 1/3 1/3 +1 +1 +1 +1 +1 +1 +1 +1 +1 +1 +1
1/3 2/3 2/3 +1 +1 +1 +1 +1 +1 +1 +1 +1 +1 +1
∑ +3 +3 +3 +3 +3 +3 +3 +3 +3 +3 +3
3b 0 0 1/2 -1 -1 +1 +1 +1 -1 -1 -1 +1 +1 -1
2/3 1/3 5/6 -1 -1 +1 +1 +1 -1 -1 -1 +1 +1 -1
1/3 2/3 7/6 -1 -1 +1 +1 +1 -1 -1 -1 +1 +1 -1
∑ -3 -3 +3 +3 +3 -3 -3 -3 +3 +3 -3
6c 0 0 1/4 -i +i -1 -1 +1 -i -i +i -i +1 -i
2/3 1/3 7/12 -i +i -1 -1 +1 -i -i +i -i +1 -i
+/3 2/3 11/12 -i +i -1 -1 +1 -i -i +i -i +1 -i
0+ 0-1/4 +i -i -1 -1 +1 +i +i -i +i +1 +i
2/3 1/3 1/12 +i -i -1 -1 +1 +i +i -i +i +1 +i
1/3 2/3 5/12 +i -i -1 -1 +1 +i +i -i +i +1 +i
∑ 0 0 -6 -6 +6 0 0 0 0 +6 0
Contribution of 3a and 3b - - + + + - - - + + -
Table 6 Atom position parameters of R3m(No.166)
Suppose f3a, f3b, f6c are the atom scattering factor of atoms on 3a, 3b and 6c position, then we get the following formula for Li(Ni1/3Co1/3Mn1/3)O2:
$\left\{ \begin{array}{l}{f_{3a}} = {f_{\left( {3a} \right)1}} + {f_{\left( {3a} \right)2}} + {f_{\left( {3a} \right)3}} = 3{f_{Li}}\\{f_{6c}} = {f_{\left( {6c} \right)1}} + {f_{\left( {6c} \right)2}} + \cdots + {f_{\left( {3c} \right)6}} = 6{f_o}\end{array} \right.$ (5)
f3b is complicated, when S=0,
${f_{3b}} = \frac{1}{2}\left( {{f_{{\rm{Ni}}}} + {f_{{\rm{Co}}}} + {f_{{\rm{Mn}}}}} \right) \times 3$ (6)
when S=1
${f_{3b}} = {f_{{\rm{Ni}}}} + {f_{{\rm{Co}}}} + {f_{{\rm{Mn}}}}$ (7)
when 0 < S < 1
$\begin{array}{l}{f_{3b}} = S \times \left( {{f_{{\rm{Ni}}}} + {f_{{\rm{Co}}}} + {f_{{\rm{Mn}}}}} \right) + \\\;\;\;\;\;\;\;\;\left( {1 - S} \right) \times \frac{1}{3}\left( {{f_{{\rm{Ni}}}} + {f_{{\rm{Co}}}} + {f_{{\rm{Mn}}}}} \right) \times 3\end{array}$ (8)
Eq.(8) shows that, when 0 < S < 1, atomic scattering factor of 3b position includes two parts. The first item describes the orderly occupying part, while the second item describes contribution of randomly occupied atoms remaining after orderly occupying. fLi, fNi, fCo, fMn, fo are the scattering factor of Li, Ni, Co, Mn and O atoms respectively. They are all the functions of (sinθ)/λ and decrease with (sinθ)/λ increasing. For the same diffraction pattern, λ is constant, which means atom scattering factor decreases with 2θ increasing.
Similarly, the diffraction angle factor(1+cos22θhkl)/ (sin2θhklcos θhkl) decreases with 2θ increasing. The specific values can be calculated or obtained from professional books.
Thus, main characters of each diffraction lines of Li(Ni1/3Co1/3Mn1/3)O2 can be summarized as follows:
(1) Considering the contribution of oxygen on 6c position to diffraction intensity, it can be divided into:
No contribution: 003, 101, 015, 009, 107, 018, 113;
The addition: 104, 110;
The subtraction: 006, 012.
(2) Considering the contribution of atoms on 3a and 3b, it can be divided into:
The addition: 006, 012, 104, 110, 018;
The subtraction: 003, 101, 015, 009, 107, 113.
(3) The"addition" and "subtraction" relationship reveals a very important rule. Take 003, 101 and 104 as examples, Fhkl is :
$\left\{ \begin{array}{l}{F_{003}} = 3f_{{\rm{Li}}}^{003} - S \times \left( {f_{{\rm{Ni}}}^{003} + f_{{\rm{Co}}}^{003} + f_{{\rm{Mn}}}^{003}} \right) - \left( {1 - S} \right) \times \\\;\;\;\;\;\;\;\;\;\frac{1}{3}\left( {f_{{\rm{Ni}}}^{003} + f_{{\rm{Co}}}^{003} + f_{{\rm{Mn}}}^{003}} \right) \times 3\\{F_{101}} = 3f_{{\rm{Li}}}^{101} - S \times \left( {f_{{\rm{Ni}}}^{101} + f_{{\rm{Co}}}^{101} + f_{{\rm{Mn}}}^{101}} \right) - \left( {1 - S} \right) \times \\\;\;\;\;\;\;\;\;\;\frac{1}{3}\left( {f_{{\rm{Ni}}}^{101} + f_{{\rm{Co}}}^{101} + f_{{\rm{Mn}}}^{101}} \right) \times 3\\{F_{104}} = 3f_{{\rm{Li}}}^{104} + S \times \left( {f_{{\rm{Ni}}}^{104} + f_{{\rm{Co}}}^{104} + f_{{\rm{Mn}}}^{104}} \right) + \left( {1 - S} \right) \times \\\;\;\;\;\;\;\;\;\;\frac{1}{3}\left( {f_{{\rm{Ni}}}^{104} + f_{{\rm{Co}}}^{104} + f_{{\rm{Mn}}}^{104}} \right) \times 3 + 6f_{\rm{O}}^{104}\end{array} \right.$ (9)
The diffraction line 104 is stronger than 101. The first part in the formula is the contribution of Li atoms; the second part is the contribution of orderly Ni, Co, Mn on 3b; the third part is the contribution of randomly Ni, Co, Mn on 3b; the fourth part is the contribution of oxygen on 6c. It can be inferred from Eq.(9) that the contribution of 3a and 3b to 003 and 101 is subtraction, for both 003 and 101 oxygen have not contribution. While contribution of 3a and 3b to 104 is addition.
With S=0, 0.2, 0.4, 0.6, 0.8, 1.0, the relative intensity of the calculation results (as shown in Table 8) and analysis results show that there is no influence of order degree on diffraction intensity matrix lines. In other words, the diffraction intensity of matrix lines has no relationship with order and disorder in the 3b site. Therefore the order degree, S, cannot be solved from the diffraction data of matrix lines.
表 8
001 2 14.252 00 6.196 680.900 0.035 27.631 26.538 24.149
002 2 7.126 00 12.412 168.500 0.070 26.638 25.664 24.271
003 2 4.750 67 18.663 73.499 0.105 2.215 25.600 24.650 22.570 7.250
004 2 3.563 00 24.970 39.820 0.140 23.008 22.970 21.142
101 6 2.442 74 36.893 17.150 0.205 1.741 21.370 20.540 19.000
104 6 2.035 16 44.592 11.310 0.246 1.627 19.590 18.810 17.359 4.814
111 6 2.028 80 44.627 11.310 0.246 19.590 18.810 17.359
Table 8 The relative parameters of several matrix and super-lattice lines
7 Influence of Order Degree on Intensity of Super-lattice Diffraction Line It is known from the above research that the ordering on 3b positions does not show diffraction lines of super-lattice for Li(Ni1/3Co1/3Mn1/3)O2 belong to the No.166 space group structure. In order to prove whether it is right, the author has made a simulated study diffraction patterns of the classic AuCu3 super structure. The result shows that only when the use of crystallographic position are the same, but space group (extinction rule) is different, (No.225, Fm-3m and No.221, Pm-3m), diffraction pattern calculated can show the super-lattice lines. It can derive from his conclusion that above simulated diffraction patterns using No.166 space group do not appear super-lattice lines cannot prove that the diffraction pattern of Li(Ni1/3Co1/3Mn1/3)O2 with super-structure cannot appear super lattice lines.
In the rhombohedral system with space group (No.143-No.167) was not found corresponding space group which x, y, z coordinates are the same with (3b) positions in No.166 space group and the extinction conditions are different. That No.166 after (3b) ordering has symmetry of P3112 (No.151)18 is questionable, because x, y, z coordinates of atoms are obviously different and extinction rule is similar between No.151 and No.166 space group.
To this end, wecalculated the crystallographic position parameters of space group No.166 may appear the super-lattice lines: 001, 002, 004, 111, as shown in Table 7.
表 7
001 002 004 111
3a 0 0 0 1 1 1 1
2/3 1/3 1/3 -0.5+0.866i -0.5-0.866i -0.5+0.866i -05+0.866i
1/3 2/3 2/3 -0.5-0.866i -0.5+0.866i -0.5-0.866i -0.5-0.866i
∑ 0 0 0 0
3b 0 0 1/2 -1 1 1 -1
2/3 1/3 5/6 0.5-0.866i -0.5-0.866i -0.5+0.866i 0.5-0.866i
1/3 2/3 7/6 0.5+0.866i -0.5+0.866i -0.5-0.866i 0.5+0.866i
∑ 0 0 0 0
6c 0 0 1/4 i -1 1 i
2/3 1/3 7/12 -0.866-0.5i 0.5+0.866i -0.5+0.866i -0.866-0.5i
1/3 2/3 11/12 0.866-0.5i 0.5-0.866i -0.5-0.866i 0.866-0.5i
0 0 -1/4 -i -1 1 -i
2/3 1/3 1/12 0.866+0.5i 0.5+0.866i -0.5+0.866i 0.866+0.5i
1/3 2/3 5/12 -0.866+0.5i 0.5-0.866i -0.5-0.866i -0.866+0.5i
∑ 0 0 0 0
Table 7 Position parameters of space group No.166
We can conclude from analysis of Table 7:
(1) The 3a and 6c position atoms are no contribution to the diffraction intensity of 001, 002, 004 and 111.
(2) 3b position atoms contribution to the diffraction intensity are more complex; when disordered (S=0) occupation, the atomic scattering factors for each position are equal to (fNi+fCo+fMn)/3 the same, such as, factor scatter factor for each position, the contribution of three position is equal to zero; when totally ordered (S=1) occupation, the scattering factors of three position are different, the contribution of three positions is not zero, then the super-lattice lines can appear; and the larger the difference of atomic scattering factor between the three positions is, the stronger super-lattice line is. Therefore, using the anomalous diffraction techniques or/and neutron diffraction is beneficial to studying a super-lattice structure.
(3) When 0 < S < 1, structure factor is divided into two parts, ordered partials have contributed to intensity and the remaining disorder part has no contribution to intensity.
The effect of order degree on the diffraction intensity has calculated using the data given in Table 8, because 104 and 111 almost overlap, so only for four diffraction of 002, 003, 004, 101 was calculated. The results are given in Table 9.
表 9
002 003 004 101002 003 004 101
0.0 0 635 262.963 0 321 050.875 0 100.00 0 50.54
0.2 18.164 0 635 262.963 10.910 0 321 050.875 0.002 9 100.00 0.001 7 50.54
0.4 228.926 0 635 262.963 43.476 0 321 050.875 0.036 0 100.00 0.006 8 50.54
0.6 515.106 3 635 262.963 97.831 4 321 050.875 0.081 1 100.00 0.015 4 50.54
0.8 1 216.302 1 635 262.963 173.793 2 321 050.875 0.191 5 100.00 0.027 4 50.54
1.0 1 431.104 0 635 262.963 271.747 0 321 050.875 0.225 3 100.00 0.042 8 50.54
Table 9 Calculated intensity and relative intensity of several matrix and super-lattice lines and influence of order degree
We can see from analysis of Table 9:
(1) The matrix diffraction intensity does not change with S, in other words, the diffraction intensity of matrix line is not influenced by S;
(2) Diffraction intensity of super-lattice lines increases with the increase of S, which can solve an order degree, S, according to the intensity data super-lattice diffraction lines or super-lattice and matrix diffraction lines.
(3) The relative intensity of super-lattice lines is very weak, even S=1, the relative intensity of 002 and 004 super two points front is only 0.225% and 0.043%. So the general diffraction experiment is very difficult to detect the super-lattice lines.
8 Conclusion and Prospect For Li (Ni1/3Co1/3Mn1/3)O2, when Ni, Co, Mn ordered occupied in 3b, diffraction intensity of the matrix lines is not influenced by order degree S; but the diffraction intensity of super-lattice lines increase with the order degree. Theoretically, one can solve an ordering degree, S, according to the intensity data super-lattice diffraction lines or super-lattice and matrix diffraction lines, but it is very difficult because diffraction intensity of the super-lattice lines is very weak, in general diffraction experiments.
Therefore, whether orderly occupying is existed in 3b of Li(Ni1/3Co1/3Mn1/3)O2 and forms of super structure still need further study in the following aspects:
1) To explore the optimal process of ordering treatment for Li(Ni1/3Co1/3Mn1/3)O2 material under the appropriate medium temperature;
2) To enhance the detection ability of diffraction experiment, use strong X-ray source, such as synchrotron radiation X-ray source, use high efficient detector, super fine experimental operation, such as slow speed scan and anomalous diffraction techniques or/and the neutron diffraction technique;
3) According to the relationship between diffraction intensity increases with the order degree increases, to determine the order degree of material; establish the relationship among ordering treatment process, order degree and materials (battery) performance.
References
[1] Li D, Zhang H Z, Wang C W, et al. New structurally integrated layered-spinel lithium-cobalt-manganese-oxide composite cathode materials for lithium-ion batteries. Journal of Alloys and Compounds, 2017, 696: 276-289. DOI:10.1016/j.jallcom.2016.11.246 (
 0)
0)[2] Zou Y H, Yang X F, Lv C X, et al. Multishelled Ni-Rich Li(NixCoyMnz)O2 hollow fibers with low cation mixing as high-performance cathode materials for Li-Ion batteries. Advanced Science, 2017, 4(1): 1600262. DOI:10.1002/advs.201600262 (
 0)
0)[3] Seidlmayer S, Buchberger I, Reiner M, et al. First-cycle defect evolution of Li1-xNi1/3Mn1/3Co1/3O2 lithium ion battery electrodes investigated by positron annihilation spectroscopy. Journal of Power Sources, 2016, 336: 224-230. DOI:10.1016/j.jpowsour.2016.10.050 (
 0)
0)[4] Otoyama M, Ito Y, Hayashi A, et al. Raman spectroscopy for LiNi1/3Mn1/3Co1/3O2 composite positive electrodes in all-solid-state lithium batteries. Electrochemistry, 2016, 84(10): 812-814. DOI:10.5796/electrochemistry.84.812 (
 0)
0)[5] Hoang K, Johannes M. Defect physics and chemistry in layered mixed transition metal oxide cathode materials: (Ni, Co, Mn) vs (Ni, Co, Al). Chemistry of Materials, 2016, 28(5): 1325-1334. DOI:10.1021/acs.chemmater.5b04219 (
 0)
0)[6] Koyama Y, Arai H, Tanaka I, et al. Defect chemistry in layered LiMO2 (M = Co, Ni, Mn, and Li1/3Mn2/3) by first-principles calculations. Chemistry of Materials, 2012, 24(20): 3886-3894. DOI:10.1021/Cm3018314 (
 0)
0)[7] Vadlamani B, An K, Jagannathan M, et al. An in-situ electrochemical cell for neutron diffraction studies of phase transitions in small volume electrodes of li-ion batteries. J. Electrochem. Soc., 2014, 161(10): A1731-A1741. DOI:10.1149/2.0951410jes (
 0)
0)[8] Yan P F, Zheng J M, Lv D P, et al. Atomic-resolution visualization of distinctive chemical mixing behavior of Ni, Co, and Mn with Li in layered lithium transition-metal oxide cathode materials. Chemistry of Materials, 2015, 27(15): 5393-5401. DOI:10.1021/acs.chemmater.5b02016 (
 0)
0)[9] Kitamura N, Ishida N, Idemoto Y. Atomic-configuration analysis on LiNi0.5Mn0.5O2 by reverse monte carlo simulation. Electrochemistry, 2016, 84(10): 789-792. DOI:10.5796/electrochemistry.84.789 (
 0)
0)[10] Zheng J X, Liu T C, Hu Z X, et al. Tuning of thermal stability in layered Li(NixMnyCoz)O2. Journal of the American Chemical Society, 2016, 138(40): 13326-13334. DOI:10.1021/jacs.6b07771 (
 0)
0)[11] Koyama Y, Tanaka I, Adachi H, et al. Crystal and electronic structures of superstructural Li1-x[Co1/3Ni1/3 Mn1/3] O2 (0≤x≤1). Journal of Power Sources, 2003, 119-121: 644-648. DOI:10.1016/S0378-7753(03)00194-0 (
 0)
0)[12] Yabuuchi N, Koyama Y, Nakayama N, et al. Solid-state chemistry and electrochemistry of LiCo1/3Ni1/3Mn1/3O2 for advanced lithium-ion batteries. Journal of the Electrochemical Society, 2005, 152(7): A1434-A1440. DOI:10.1149/1.1924227 (
 0)
0)[13] Yoon W S, Grey C P, Balasubramanian M, et al. Combined NMR and XAS study on local environments and electronic structures of electrochemically Li-ion deintercalated Li1-xCo1/3Ni1/3Mn1/3O2 electrode system. Electrochemical and Solid-State Letters, 2004, 7(3): A53-A55. DOI:10.1149/1.1643592 (
 0)
0)[14] Cahill L S, Yin S C, Samoson A, et al. 6Li NMR studies of cation disorder and transition metal ordering in Li[Ni1/3Mn1/3Co1/3]O2 using ultrafast magic angle spinning. Chemistry of Materials, 2005, 17(26): 6560-6566. DOI:10.1021/cm0508773 (
 0)
0)[15] Nedoseykina T, Kim S S, Nitta Y. Local atomic characterization of LiCo1/3Ni1/3Mn1/3O2 cathode material. Electrochim Acta, 2006, 52(4): 1467-1471. DOI:10.1016/j.electacta.2006.02.047 (
 0)
0)[16] Stoyanova R, Ivanova S, Zhecheva E, et al. Correlations between lithium local structure and electrochemistry of layered LiCo1-2xNixMnxO2 oxides: 7Li MAS NMR and EPR studies. Phys. Chem. Chem. Phys., 2014, 16(6): 2499-2507. DOI:10.1039/C3cp54438a (
 0)
0)[17] Gotoh K, Izuka M, Arai J, et al. In situ 7Li nuclear magnetic resonance study of the relaxation effect in practical lithium ion batteries. Carbon, 2014, 79: 380-387. DOI:10.1016/j.carbon.2014.07.080 (
 0)
0)[18] Whitfield P S, Davidson I J, Cranswick L M D, et al. Investigation of possible superstructure and cation disorder in the lithium battery cathode material LiMn1/3N1/3Co1/3O2 using neutron and anomalous dispersion powder diffraction. Solid State Ionics, 2005, 176(5-6): 463-471. DOI:10.1016/j.ssi.2004.07.066 (
 0)
0)[19] Pang W K, Alam M, Peterson V K, et al. Structural evolution of electrodes in the NCR and CGR cathode-containing commercial lithium-ion batteries cycled between 3.0 and 4.5 V: An operando neutron powder-diffraction study. Journal of Materials Research, 2015, 30(3): 373-380. DOI:10.1557/jmr.2014.297 (
 0)
0)[20] Levi E, Aurbach D. Crystal chemistry and valence determinations for Mn, Ni and Co oxides as cathode materials in Li batteries. Solid State Ionics, 2014, 257: 1-8. DOI:10.1016/j.ssi.2014.01.024 (
 0)
0)[21] Dolotko O, Senyshyn A, Muhlbauer M J, et al. Understanding structural changes in NMC Li-ion cells by in situ neutron diffraction. Journal of Power Sources, 2014, 255: 197-203. DOI:10.1016/j.jpowsour.2014.01.010 (
 0)
0)[22] Cherkashinin G, Ensling D, Jaegermann W. LiMO2 (M = Ni, Co) thin film cathode materials: a correlation between the valence state of transition metals and the electrochemical properties. Journal of Materials Chemistry A, 2014, 2(10): 3571-3580. DOI:10.1039/C3ta14509c (
 0)
0)[23] Yang C Z, Xie D C, Chen G Z, et al. Diffraction Analysis of Phases. Beijing: Metallurgic Industry Press, 1989: 179-184. (
 0)
0)[24] Levi E, Aurbach D. Lattice strains in the layered Mn, Ni and Co oxides as cathode materials in Li and Na batteries. Solid State Ionics, 2014, 264: 54-68. DOI:10.1016/j.ssi.2014.06.020 (
 0)
0)