Meng Wang1, Xuyang Wang1, Yuanhong Sun2,Zhimin Gu2
(1. School of Naval Architecture, Ocean and Civil Engineering, Shanghai Jiaotong University, Shanghai 200240, China; 2. North China Sea Marine Technical Support Centre,State Oceanic Administration, Qingdao 266061, Shandong, China)
Abstract:
Shear stress-displacement relationship model of soil is very important to predict the tractive performance of tracked vehicle. Most shear stress-displacement models were proposed for terrestrial field. However, they are not suit for soft seafloor with flow surface and high water content. Based on comprehensive analysis of seafloor soil shear deformation and track segment shear tests, a new empirical model of shear stress-displacement relationship for saturated soft-plastic soil (SSP model) was proposed. To validate the SSP model and evaluate potential tractive force of self-propelled seafloor trencher, a test platform, where track segment shear test and drawbar pull test can be performed in seafloor soil substitute (bentonite water mixture), was built. Series of shear tests were carried out. Test results show that the SSP model can describe the mechanical behavior of track segment in seafloor soil substitute with good approximation. Through analyzing the main external forces, including environmental loads from seafloor soil and sea current applied to seafloor tracked trencher during the trenching process in a straight line, drawbar pull analysis model was deduced with the SSP model. A scale test model of seafloor tracked trencher was built, and the verification tests for drawbar pull analysis model were designed and carried out. Results of verification tests indicate that the drawbar pull analysis model was feasible and effective. The drawbar pull tests also indicated that the SSP model is valid from another side.
Key words: shear stress-displacement relationship SSP model tractive performance drawbar pull self-propelled seafloor trencher
DOI:10.11916/j.issn.1005-9113.15170
Clc Number:P754.4
Fund:
Meng Wang,Xuyang Wang,Yuanhong Sun,Zhimin Gu. Traction Potential Analysis of Self-Propelled Seafloor Trencher Based on Mechanical Measurements in Bentonite Soil[J]. Journal of Harbin Institute of Technology, 2017, 24(1): 71-80. DOI: 10.11916/j.issn.1005-9113.15170.

Corresponding author Wang Meng, E-mail: bob00@126.com Article history Received: 2015-06-17
Contents Abstract Full text Figures/Tables PDF
Traction Potential Analysis of Self-Propelled Seafloor Trencher Based on Mechanical Measurements in Bentonite Soil
Meng Wang1

 , Xuyang Wang1, Yuanhong Sun2, Zhimin Gu2
 1. School of Naval Architecture, Ocean and Civil Engineering, Shanghai Jiaotong University, Shanghai 200240, China;
2. North China Sea Marine Technical Support Centre,State Oceanic Administration, Qingdao 266061, Shandong, China
Received: 2015-06-17
Corresponding author: Wang Meng, E-mail: bob00@126.com
Abstract: Shear stress-displacement relationship model of soil is very important to predict the tractive performance of tracked vehicle. Most shear stress-displacement models were proposed for terrestrial field. However, they are not suit for soft seafloor with flow surface and high water content. Based on comprehensive analysis of seafloor soil shear deformation and track segment shear tests, a new empirical model of shear stress-displacement relationship for saturated soft-plastic soil (SSP model) was proposed. To validate the SSP model and evaluate potential tractive force of self-propelled seafloor trencher, a test platform, where track segment shear test and drawbar pull test can be performed in seafloor soil substitute (bentonite water mixture), was built. Series of shear tests were carried out. Test results show that the SSP model can describe the mechanical behavior of track segment in seafloor soil substitute with good approximation. Through analyzing the main external forces, including environmental loads from seafloor soil and sea current applied to seafloor tracked trencher during the trenching process in a straight line, drawbar pull analysis model was deduced with the SSP model. A scale test model of seafloor tracked trencher was built, and the verification tests for drawbar pull analysis model were designed and carried out. Results of verification tests indicate that the drawbar pull analysis model was feasible and effective. The drawbar pull tests also indicated that the SSP model is valid from another side.
Key words: shear stress-displacement relationship SSP model tractive performance drawbar pull self-propelled seafloor trencher
1 IntroductionWith the growing demand for offshore wind energy, the number of seafloor cables required to export energy from wind farms to shore has also increased in recent years[1-2]. As a result, large number of cables associated with energy delivery and telecommunications will be installed during the coming decades. Sometimes, seafloor cables cross busy shipping routes and fishing areas where the seafloor is frequently disturbed by dredging, trawling and anchoring. These cables may be damaged when exposed on the seafloor surface, and thus need proper protection. To reduce the risk of damaging the cables, the effective protection of the cable and careful execution of cable laying and burial operations are required. Burial of the cable is the preferred way to protect cables against these impacts. Seafloor trenching is usually done by equipment mounted on a seabed carriage or sled, which may be either self-propelled or towed. Seafloor tracked trencher (STT) equipped with jetting system is designed to meet the burial requirements of seafloor pipelines and cables above-mentioned.
STT's mobility requires both sufficient traction and bearing capacity. The working capacity depends principally on vehicle dimensions and seafloor soil property. Tracked walking mechanism has a larger contact area with ground than wheeled running gear, so, it can provide better floatation and larger traction forces. By shearing seafloor soil, tracks can produce traction force that propels trencher forward, and the available traction must be sufficient to enable trencher to overcome various resistances, including vehicle weight due to slope/vehicle pitch and compaction resistance which arises as a consequence of creation of ruts.
Evaluation of trafficability of the terrain and optimization of traction potential of tracked vehicles are essential and lots of researches have been done. Through experiments analysis, Janosi and Hanamoto[3] proposed a drawbar pull model as a function of slip for tracked vehicles in deformable soils. Watanabe and Kitano[4] presented a theoretical and experimental analysis of steering performance of articulated tracked vehicles on level ground, and developed a mathematical model for predicting the steerability of articulated units. Considering possible factors related to steering problems such as track slippage, centrifugal force and vehicle configuration, Kitano and Jyozaki[5] developed a steering model for uniform turning motion and steerability in plane motion of vehicles. Baladi and Rohani[6], had studied and developed the application of tracked vehicles on soft soil. Most shear stress-displacement functions were proposed mainly for the terrestrial field of terramechanics. They may not suit for the soft seafloor with flow surface and high water content. Based on deep sea soil situ measurements and bentonite soil laboratory tests, Schulte[7] developed a shear stress-displacement relationship function for deep sea soil. This function fits measurement result of segment shear test well in descending part and residual part; but in the hump part, the calculated curves appears some deviations, and there exists an offset for s=0. Kim[8] analyzed underwater tracked vehicle's dynamics on extremely soft soil by using Euler Parameters and investigated the hydrodynamic effects on the performance of tracked vehicle.
2 Mechanics of Track-soil InteractionThe attainable locomotion of the STT over seafloor surface is mainly based on shear forces that develop between track links and surface soil in the longitudinal directions of links. Soil conditions have significant effects on the tractive performance of tracked vehicles. The mechanical behavior of seafloor soils varies considerably under a wide variety of environmental conditions, for example composition, moisture levels and porosity. According to large numbers of tests, the seafloor soil shows the similar characteristic as a type of "undisturbed firm soils"[8-9]. As shown in Fig. 1, this type of soil exhibits the characteristics that the shear stress initially increases sharply and reaches a "hump" of maximum shear stress (τmax) at a particular shear displacement, and then decreases and approaches a relative constant residual value (τres) with further increase in shear displacement.
Figure 1
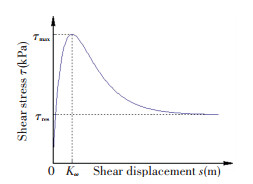 Figure 1 Shear curve exhibiting a peak and constant residual shear stress
 2.1 Physical Mechanics Characteristics of Seafloor SoilThe physical mechanics characters of seafloor soils are special. With the increase of depth, the seafloor soil presents flow state, fluidal plastic state and plastic state[10]. Elastic-plastic deformation may play an important role in the energy loss caused by deformation. Taking the deformation of surrounding soil into account, the principle of deformation can be shown as Fig. 2(a). The deformation is not linear. The influence zone (Dw, Dh) depends on many factors, such as normal stress (σ), soil cohesion (c), soil internal angle of friction (φ), shear deformation modulus (K), soil moisture content (w), etc. A typical shear process can be described as follows: in the beginning of soil deformation, the shear stress increases proportionally to the shear displacement, this phenomenon indicates that the main deformation is elastic deformation. At a certain shear displacement, the soil starts to fail and plastic deformation is occurred, the shear bock starts to form. When the maximum shear stress is reached, the soil is completely broken. After this, the shear stress declines to its residual value. But the soil mass under shear bock is still in deformation state caused by frictional effects. As shown in Fig. 2(b), it is easy to observe the deformation process above-mentioned during the shear tests.
Figure 2
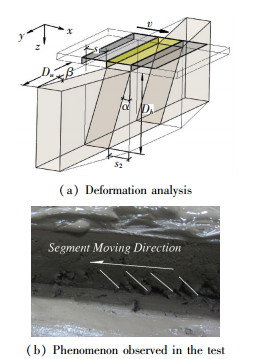 Figure 2 Deformation and shear of the soil during track segment test
 Through analyzing the earlier test data, it's very interesting to find that the hump zone energy loss ΔEH seems to be caused mainly by elastic-plastic deformation of the shear bock and soil mass around track segment; and the residual zone energy loss ΔER can be considered as causing by friction deformation of the soil mass around track segment. Therefore, when analyzing and modifying the shear stress-displacement model, these two types of energy losses can be considered and modified independently. The mechanical behavior analysis of seafloor soil shear deformation and the theoretical derivation of shear stress-displacement model are not the study focus of this paper, and they will be discussed in detail in the future.
On the basis of early track segment shear tests and comprehensive analysis above-mentioned, the following shear stress-displacement model of saturated soft-plastic soil (SSP model) is introduced as follows:
$\begin{array}{l}\tau + {k_{{\rm{pm}}}} \cdot \left[ { - {{\left( {{{\rm{e}}^{ - s/{K_{\rm{ \mathsf{\omega } }}}}} - {c_{{\rm{pm}}}}} \right)}^2}} \right] + {\left( {1 - {c_{{\rm{pm}}}}} \right)^2} \cdot {\tau _{\max }} + \\\;\;\;\;\;{k_{{\rm{pr}}}} \cdot \left[ {{{\left( {{{\rm{e}}^{ - s/{K_\mathit{\omega }}}} - {c_{{\rm{pr}}}}} \right)}^2} - {{\left( {1 - {c_{{\rm{pr}}}}} \right)}^2}} \right] \cdot {\tau _{{\rm{res}}}}\end{array}$ (1)
where τmax is the maximum shear stress of a contact area and can be measured for the test curves, or be calculated by Mohr-Coulomb equation; τres is the residual shear stress; Kω is the shear displacement where the maximum shear stress τmax occurs; cpm is the correction factor caused by the soft-plastic deformation loss in hump zone; cpr is the correction factor caused by the soft-plastic deformation loss in residual zone; kpm is the adjustment coefficient of the hump part; kpr is the adjustment coefficient of the residual part.
It is not difficult to fit this function according to the measured values, as the parameters are almost independent from each other. The values of τmax, τres, Kω can be directly identified from the measured shear curve. The values of cpm and cpr can be calculated according to the least square error. Through the analysis of the track segment tests, it was found that the values of cpm, cpr changed little for the bentonite-water mixture with different water content and different vertical pressure. kpm and kpr are constant values. The parameter values above-mentioned obtained from the tests are shown in Table 1.
表 1
plastic deformation loss cpm Correction factor of residual zone soft-
plastic deformation loss cpr Adjustment coefficient of
hump zone kpm Adjustment coefficient of
residual zone kpr
Value 0.51 0.68 4.30 2.72
Table 1 Parameters of the soft-plastic deformation loss calculated from test values
2.2 Test PlatformA test platform (Fig. 3) was designed to carry out the track segment shear test and the plate pressure-sinkage test. The test platform is equipped with a linear speed control module to ensure the linear speed of the track segment movement and equipped with a vertical loading device to adjust contact pressure (pv) between track segment and soft soil. The technical details of the test platform are shown in Table 2.
Figure 3
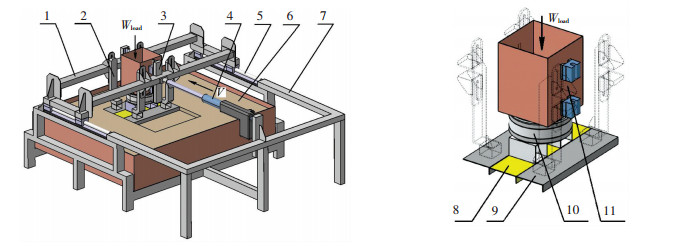 Figure 3 Overview of the test platform
 表 2
Soil bininner dimensions Length 2 m; Width 1.5 m; Depth of bentonite 0.8 m
Shear velocity Up to 0.05 m/s
Test conditions Undrained; With free sinkage or without free sinkage
Test item 1 Shear stress-shear displacement relationship
Test item 2 Pressure-sinkage relationship
Sample segment 1 Length 0.4 m; Width 0.1 m; Grouser height 0.03 m
Sample segment 2 Length 0.6 m; Width 0.15 m; Grouser height 0.05 m
Table 2 Technical details of experiment platform
Soil conditions can affect the tractive performance of tracked vehicles, and some test results demonstrate this effect and show that soil properties are very important factors in track-soil interaction[11-12]. As seafloor soils substitute, bentonite water mixture is used. Bentonite water mixtures have shown to be acceptable deep sea soil substitute, as the material composition and the main characteristics are similar[13]. It is very different to simulate the maximum and the residual shear strengths of the soil simultaneously, only the residual shear strength of the soil is aimed. The shear strength of mixture is controlled by water content of the bentonite-water mixture. To keep the shear strength of soil well-distributed, the water content of soil is maintained uniformly. After each set of measurements, the bentonite-water mixture is thoroughly mixed with a mixing device and left to stand still for some times.
To ensure accuracy and adjustability of contact pressure between track segment and bentonite water mixture, lead blocks and steel grits are used as the loading weight.
2.3 Shear Stress-displacement Measurements with Track SegmentDuring the track segment shear test, three plates distributed with equal distance are put on the surface of bentonite water mixtures. The middle track segment can move freely in horizontal movement direction of the track and is fixed on the bottom of the six-axis force/torque transducer (Figs. 3 and 4). Vertical loading device applies loads to the middle track segment. The six-axis force/torque transducer measures the shear force applied to the soil by the middle plate and the vertical pressure by the loads. The front and rear plates are fixed to eliminate front and rear effects.
Figure 4
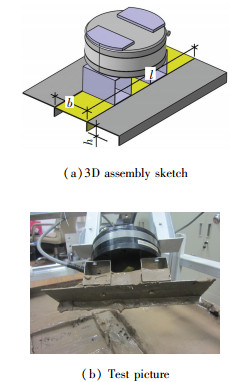 Figure 4 Middle plate fixed with six-axis force/torque transducer
 Series tests were carried out with two types of simplified track segments (Fig. 4, Table 2). Three times of each shearing test were made respectively to obtain the effective values. By applying vertical pressure (pv), dynamic sinkage occurred while track segment were linearly moved through the soil. And the shear force (FS) is measured through the middle segment with six-axis force/torque transducer. The shear stress is calculated by dividing the shear force with the shear area. So, the shear stress τ caused by the middle plate can be calculated as follows:
$\tau = \frac{{{F_s}}}{{{A_m}}} = \frac{{{F_s}}}{{l \cdot \left( {b + 2h} \right)}}$ (2)
where FS is the shear force; Am is the shear area of the middle track segment; b is the smaller dimension of the plate; l is the plate length; h is the grouser height.
Several track segment shear tests were conducted with different water content (wc) and different vertical contact pressure (pv). Two results selected from shearing tests are shown in Figs. 5 and 6.
Figure 5
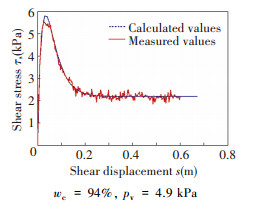 Figure 5 Shear stress-displacement measurement with track segment in comparison with calculated values according to SSP model
 Figure 6
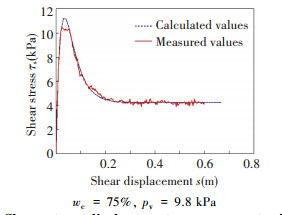 Figure 6 Shear stress-displacement measurement with track segment in comparison with calculated values according to SSP model
 As measured curves shown in Figs. 5 and 6, shear stress increases rapidly with the increase of shear displacement in the initial stage, and shear stress reaches a larger value range at some deformation and then drops to a lower and nearly constant value as deformation continues. Due to test conditions, the curves of shear stress display some fluctuations, and peak values aren't achieved. There are some fluctuations in measured curves, particularly in the residual parts. This phenomenon is caused by insufficient stiffness of sliding beams and clearance of assembly parts (Fig. 3). But overall, the prediction values according to SSP model fit the measured curves well; that means the SSP model can describe the mechanical behavior of track segment with good approximation in bentonite water mixture.
3 Tractive PerformanceDuring the trenching process in a straight line, main external forces, including environmental loads from seafloor soil and sea current applied to seafloor tracked trencher, are shown in Fig. 7.
Figure 7
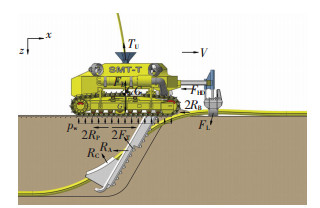 Figure 7 Main external forces acting on seafloor tracked trencher
 In Fig. 7, FT is the tractive force produced by track shearing seafloor surface soil; FB is the buoyant force; FHD is the hydrodynamic force; RP, RA, RB, RJ are compaction resistance, friction resistance between jet arm and trench wall, bulldozing resistance, and jetting reaction force respectively; RC and FL are cable restraining resistances; TU is the umbilical drag force. pw is the working contact pressure between tracks and seafloor. RP, RB can be classified as the motion resistances, and other forces can be classified as working resistances. Tracked walking mechanism has to produce an amount of thrust to overcome working resistances and motion resistances.
With the main forces acting on the STT (Fig. 7), the basic motion equation can be set up as follows:
$\left\{ \begin{array}{l}{m_{\rm{T}}}\ddot x = 2{F_{\rm{T}}} - 2\left( {{R_{\rm{P}}} + {R_{\rm{B}}}} \right) - \left( {{F_{{\rm{HD}}}} + {F_{{\rm{L}}\mathit{x}}} + {R_{\rm{A}}} + } \right.\\\;\;\;\;\;\;\;\;\;\;\left. {{R_{{\rm{C}}x}} + {T_{{\rm{U}}x}} + {R_{{\rm{J}}x}}} \right)\\G = 2A{p_{\rm{w}}} + \left( {{F_{\rm{B}}} + {R_{{\rm{C}}z}} + {R_{{\rm{J}}z}} + {T_{{\rm{U}}z}} - {F_{{\rm{L}}z}}} \right)\end{array} \right.$ (3)
where, mT is inertial mass of the STT; G is the trencher weight, G=mT·g; A is contact area of one-side track; RCx, RJx, FLx, TUx are the corresponding force components in x-axis; RCz, RJz, TUz, FLz are the corresponding force components in z-axis.
The tractive performance can be characterized by tractive effort, motion resistances and drawbar pull. Drawbar pull is the difference between total tractive effort (including the thrust developed by vertical shearing surfaces on both sides of the tracks) and total external motion resistance of the vehicle. It is customary to view drawbar pull as the vehicle's ability to drive both itself and working loads. Assuming that contact pressure distribution is uniform, in accordance with Eq.(3), the drawbar pull analysis model can be written as:
$\left\{ \begin{array}{l}{F_{\rm{D}}} = 2{F_{\rm{T}}} - 2\left( {{R_{\rm{P}}} + {R_{\rm{B}}}} \right)\\{p_{\rm{w}}} = \frac{1}{{2A}} \cdot {W_{{\rm{Ly}}}} = \frac{1}{{2A}} \cdot \left[ {G - \left( {{F_{\rm{B}}} + {R_{{\rm{C}}\mathit{y}}} + } \right.{R_{{\rm{J}}y}} + } \right.\\\;\;\;\;\;\;\;\left. {\left. {{T_{{\rm{U}}y}} - {F_{{\rm{L}}y}}} \right)} \right]\\{k_{\rm{M}}} = {F_{\rm{D}}}/\max \left\{ {{W_{{\rm{L}}x}}} \right\} = {F_{\rm{D}}}/\max \left\{ {{m_{\rm{T}}}\ddot x + } \right.\\\;\;\;\;\;\;\;\left. {\left( {{F_{{\rm{HD}}}} + {F_{{\rm{L}}\mathit{x}}} + {R_{\rm{A}}} + {R_{{\rm{C}}x}} + {T_{{\rm{U}}x}} + {R_{{\rm{J}}x}}} \right)} \right\}\end{array} \right.$ (4)
where, FD is defined as the drawbar pull; WLy is the normal working loads acting on the tracks; WLx is the horizontal working loads acting on the tracks; kM can be defined as the determining factor of operation margin; during the engineering design, assuming that the soil conditions and working slip of tracks are confirmed, the drawbar pull FD can be considered as meeting the design requirements if the calculated value of the operation margin factor kM is greater than or equals 1.3.
It should be noted that the working motion of the STT is sluggish (about 300 m/h) during the trenching process, and the acceleration of the trencher is relatively slow too; so, the interference of the motion state change to the net drag force can be ignored in the design and verification process. Within frame of this paper,
3.1 Traction Force CalculationIn vehicle performance evaluation, it is desirable to determine the variation of thrust with track slip over the full operating range. The shear displacement at various points beneath a track is shown in Fig. 8. When a certain grouser comes into seafloor soil at the front of a track, the shear displacement of this grouser is zero. Caused by the difference between track belt velocity and vehicle moving velocity over seafloor surface, the horizontal shear displacement increases linearly along contact length till the grouser leaves soil surface again; at this moment, the shear displacement reaches its maximum value at the rear of contact area. To examine development of shear displacement beneath a track quantitatively, the slip of track i is defined as:
Figure 8
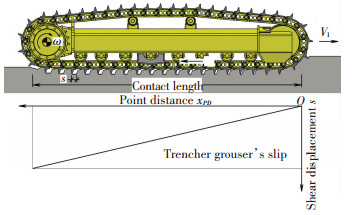 Figure 8 Shear displacement under a track belt at a constant speed
 $i = 1 - \frac{{{V_{\rm{t}}}}}{{{r_{\rm{S}}}\omega }} = \frac{{{r_{\rm{S}}}\omega - {V_{\rm{t}}}}}{{{r_{\rm{S}}}\omega }}$ (5)
where, Vt is the actual forward speed of track; rS is the radius of sprocket pitch circle; ω is the angular velocity of rear sprocket.
Since track cannot stretch, the speed of slip rSω-Vt is the same for very point of track in contact with the terrain. Assuming that t is the contact time of the point located at a distance xPD from the front of contact area, t=xPD/rSω, with Eq.(5) the shear displacement s at a point can be determined by:
$s = \left( {{r_{\rm{S}}}\omega - {V_{\rm{t}}}} \right)t = i \cdot {x_{{\rm{PD}}}}$ (6)
The main tractive effort developed either by frictional forces or by cohesive forces is to be related to the shear area located beneath the tracks, often identified as the ground contact area. There are two other additional shear areas per track, which are located along the sides of tracks. If the depth of track grouser is denoted by h, then the additional areas will amount to 4hs, and this additional areas cannot be neglected in the evaluation of the tractive effort.
Making use of the SSP model (Eq.(1)) and Eq.(6) described previously, the shear stress at any point of the contact area can be determined. Assuming a uniform normal pressure distribution, the traction force FT of the STT can be calculated as follows by integrating the shear stress over the contact length (L).
$\begin{array}{l}{F_{\rm{T}}} = \int_0^L {\left( {B + 2h} \right) \cdot \left\{ {{k_{{\rm{pm}}}} \cdot \left[ { - {{\left( {{{\rm{e}}^{\frac{{ - ix}}{{{K_{\rm{ \mathsf{ ??} }}}}}}} - {c_{{\rm{pm}}}}} \right)}^2} + } \right.} \right.} \\\;\;\;\;\;\;\;\;\left. {{{\left( {1 - {c_{{\rm{pm}}}}} \right)}^2}} \right] \cdot {\tau _{\max }} + {k_{{\rm{pr}}}} \cdot \left[ {{{\left( {{{\rm{e}}^{\frac{{ - ix}}{{{K_{\rm{ \mathsf{ ??} }}}}}}} - {c_{{\rm{pr}}}}} \right)}^2} - } \right.\\\;\;\;\;\;\;\;\;\left. {{{\left( {1 - {c_{{\rm{pr}}}}} \right)}^2}} \right]\left. { \cdot {\tau _{{\rm{res}}}}} \right\} \cdot {\rm{d}}x\end{array}$ (7)
where L is the track contact length; B is the single track width.
Solving the integral equation (Eq.(7)), the traction force FT can be expressed as:
$\begin{array}{l}{F_{\rm{T}}} = {k_{{\rm{pm}}}} \cdot \left\{ {\frac{{{K_\mathit{\omega }}}}{{2iL}}{{\left( {{{\rm{e}}^{\frac{{ - iL}}{{{K_\mathit{\omega }}}}}} - 2{c_{{\rm{pm}}}}} \right)}^2} - \left( {2{c_{{\rm{pm}}}} - 1} \right)\left[ {1 + } \right.} \right.\\\;\;\;\;\;\;\;\left. {\left. {\left( {2{c_{{\rm{pm}}}} - 1} \right)\frac{{{K_\mathit{\omega }}}}{{2iL}}} \right]} \right\} \cdot \left( {B + 2h} \right)L \cdot {\tau _{\max }} + \\\;\;\;\;\;\;\;{k_{{\rm{pr}}}} \cdot \left\{ { - \frac{{{K_\mathit{\omega }}}}{{2iL}}{{\left( {{{\rm{e}}^{\frac{{ - iL}}{{{K_\mathit{\omega }}}}}} - 2{c_{{\rm{pr}}}}} \right)}^2} + \left( {2{c_{{\rm{pr}}}} - } \right.} \right.\\\;\;\;\;\;\;\;\left. {\left. 1 \right)\left[ {1 + \left( {2{c_{{\rm{pr}}}} - 1} \right)\frac{{{K_\mathit{\omega }}}}{{2iL}}} \right]} \right\} \cdot \left( {B + 2h} \right)L \cdot {\tau _{{\rm{res}}}}\end{array}$ (8)
3.2 Motion ResistanceWhen a tracked vehicle crosses a particular piece of terrain, it will undergo some sinkage which is dependent upon pressure-sinkage relationship of terrain, track dimensions and weight of vehicle. The visible effect of this compaction is the creation of ruts as tracks pass over seafloor surface, as shown in Fig. 9(a). This type of resistance is referred in terra mechanics as "compaction resistance". Bekker[14] suggested that normal reaction exerted on tracks by terrain can be equated to that beneath a sinkage plate at the same depth in pressure-sinkage test, and this type of pressure-sinkage is usually described as "static pressure sinkage". The tracklayers developed increasing sinkage with increasing slip and this often occurred at the back of track causing the tail down attitude often to be seen in field; and Reece advised that this type of sinkage, usually described as "slip sinkage", should be taken into account[15]. As illustrated in Fig. 9(b), the static pressure sinkage and the slip sinkage effect are not difficult to be observed during travelling test.
Figure 9
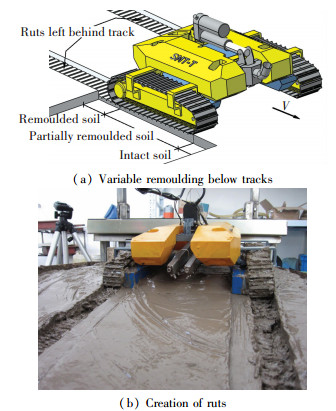 Figure 9 Variable remoulding below tracks and creation of ruts
 The analysis of slip sinkage effect on tractive performance in different soils has shown that this effect cannot be ignored[15]. Assuming that work done in compacting seafloor soil and making a rut of width B, length L, and depth z0, is equated to the motion work done in making a rut of length L with equivalent resistance RP. So, the equivalent resistance RP can be calculated as:
${R_{\rm{P}}} = {R_{\rm{S}}} + {R_{\rm{I}}}$ (9)
where RS is the resistance caused by the static pressure sinkage; RI is the resistance caused by the slip sinkage effect.
3.2.1 Static pressure sinkage resistanceUsing the pressure-sinkage equation proposed by Bekker, for a track with uniform contact pressure, the relationship of static pressure sinkage z and soil pressure p is given by[14]:
$z = {\left( {\frac{p}{{{k_c}/b + {k_\varphi }}}} \right)^{\frac{1}{n}}}$ (10)
where kc is the cohesive soil modulus; kφ is the friction soil modulus; n is the soil deformation exponent.
According to Eq.(10), the final static pressure sinkage zS caused by working contact pressure pw can be determined as:
${z_{\rm{S}}} = {\left( {\frac{{{p_{\rm{w}}}}}{{{k_c}/b + {k_\varphi }}}} \right)^{\frac{1}{n}}}$ (11)
RS can be determined by:
$BL \cdot \int_0^{z{\rm{S}}} {p{\rm{d}}z = {R_{\rm{S}}}L} $ (12)
Solving equations (Eqs.(10)-(12)), the equivalent motion resistance RS can be expressed as:
${R_{\rm{S}}} = \frac{B}{{\left( {n + 1} \right) \cdot {{\left( {{k_c}/B + {k_\varphi }} \right)}^{1/n}}}} \cdot {p_{\rm{w}}}^{\left( {n + 1} \right)/n}$ (13)
The values of kc, kφ and n obtained from the pressure-sinkage tests are shown in Table 3.
表 3
kc (kN/mn+1) Friction soil modulus
kφ (kN/mn+2) Dimensionless
exponent n
Value 0.81 38.76 0.48
Table 3 Parameter values of pressure-sinkage
3.2.2 Slip sinkage resistanceTo accurately predict sinkage and external motion resistance of a STT in a given soil and operating conditions, the slip sinkage effect should be taken into account. Reece advised to use the following formula to evaluate the additional sinkage due to the soil horizontal deformation[13].
${z_{\rm{I}}} = \frac{{h \cdot i}}{{1 - i}}$ (14)
where zI is the slip sinkage due to the soil horizontal deformation, and varying range of slip is 0-0.8.
Eq.(14) shows that the additional sinkage is originally small, but at slip i=0.5, it reaches the height of the grouser h. It's very difficult to separate slip sinkage zI from static sinkage zS, the verification test cannot be done. Taking into account the effect caused by slip sinkage on motion resistance of the STT, from a viewpoint of energy conservation, the vertical work done in compacting of the soil can be equated to the motion work done in making a rut of length L with equivalent resistance RI,
${p_{\rm{w}}}A \cdot {z_{\rm{I}}} = {R_{\rm{I}}}L$ (15)
where RI is the equivalent resistance caused by slip sinkage.
From Eq.(15), with regard to Eq.(14), RI can be expressed as:
${R_{\rm{I}}} = \frac{{{p_{\rm{w}}}Ah \cdot i}}{{L\left( {1 - i} \right)}}$ (16)
3.2.3 Bulldozing resistanceOn soft terrain where vehicle sinkage is obvious and significant, Bekker suggested that bulldozing resistance acting in front of the track should be taken into account[16]. Bulldozing is the accumulation of soil mass in front of a vehicle. The total bulldozing resistance may be computed using earth pressure theory. It should be noted that the pushing soil is not obviously observed in front of the tracks in the actual drawbar pull test; so, in this paper, bulldozing resistance can be ignored, and the bulldozing resistance RB is assigned with zero during the drawbar pull calculation.
3.3 Drawbar Pull Test3.3.1 Scale test model of seafloor tracked trencherScale test model of the STT is shown in Fig. 10. General characteristics of the scale test model are shown in Table 4, and the principal dimensions are listed in Table 5. Five counterweight cavities are set up in four corners and rear center of the chassis. By increasing or decreasing counterweights, contact pressure and pressure distribution can be adjusted to meet the requirements of the drawbar pull test. Lead blocks and steel grits are used as counterweights.
Figure 10
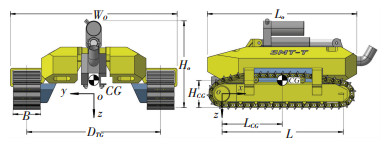 Figure 10 Scale test model of seafloor tracked trencher
 表 4
dimensions Original weight
in air (kg) Adjustment range of
contact pressure (kPa) Walking
mode Dredge
mode Driving
mode Maximum
velocity (m/s)
Features 0.8 m (LO)×0.84 m (WO)×0.45 m (HO) 97 3-15 Tracked walking
mechanism Jet trenching AC-servo motor,
Rear sprocket 0.3
Table 4 General characteristics of seafloor tracked trencher scale model
表 5
Width of track
B Reference contact
length L Track gage
DTG Longitudinal center
of gravity LCG Vertical center of
gravity HCG Radius of sprocket
pitch circle rS Grouser pitch
PG Grouser height
h
100, 150 640 690 320 180 58 38 20
Table 5 Principal dimensions of seafloor tracked trencher scale model
3.3.2 TestsolutionsAs shown in Eq.(8), the traction force FT is a function of the track slip i. According to Eq.(5), when the scale test model is moving uniformly in a straight line, speed of the test model Vt and angular velocity ω of the rear sprocket are nearly constant values, and then, the slip i is nearly a constant value. This provides the possibility for verification tests. So, here, the residual shear strength of bentonite-water mixture (τres), the width of track (B) and the contact pressure (pw) are selected as the experiment variables. The slip (i) and the drawbar pull (FD) are chosen as the performance values.
Drawbar pull tests were performed in a soil bin 4.0 m (LS)×1.5 m (BS)×0.5 m (HS), which was equipped with an A-frame as shown in Fig. 11. Bentonite-water mixture was used as the substitute of seafloor soil, and the shear strength of mixture was measured by track segment shear test. It is very difficult to simulate the maximum and the residual shear strengths of the soil simultaneously, only the residual shear strength of the soil is aimed. After each drawbar pull test, the bentonite-water mixture is thoroughly mixed with a mixing device and left to stand still for some times, till the residual shear strength of bentonite-water mixture meets the experiment requirement.
Figure 11
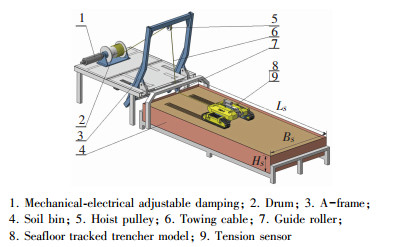 Figure 11 Schematic diagram of drawbar pull test for the seafloor tracked trencher model
 The slip of seafloor tracked trencher model was calculated by counting the pulses from encoders. One encoder is connected at the guide roller of drawbar pull test platform (Fig. 11(7) and the other encoders are fixed in AC-servo motors of the tracks. Drawbar pull force was measured by tension sensor (Fig. 11(9)). One side of the tension sensor is connected at the end of towing cable, and another side is hinged with the chassis of scale test model.
It should be noted that it is impossible to carry out different tests under the same conditions of bentonite-water mixture. But for a comprehensive parameter (e.g. residual shear stress τres), it is not difficult to be reproduced within an allowable error range, and this provides the possibility for comparison tests. It takes much time and effort to perform one drawbar pull test, so, only four sets of experimental variable combination are selected to conduct in this paper. The experimental variable combinations are shown in Table 6.
表 6
Preset value Actual valuePreset value Actual valuePreset value Actual value
1 1.3 1.19 5 5.1 0.10 0.10
2 1.3 1.32 5 5.1 0.15 0.15
3 1.3 1.37 10 10.2 0.15 0.15
4 2.3 2.18 10 10.2 0.15 0.15
Table 6 Experimental variable combinations
3.3.3 Test results and discussionAs shown in Fig. 12, four drawbar pull tests were performed, and the scale test model was kept moving uniformly in a straight line during the test. The travelling distance of the scale test model is about 3.5 m. In order to eliminate interference of the motion state change to the measured values of drawbar pull, the measured values of acceleration phase and deceleration phase were excluded in test data analysis. The valid range of test data was selected from 1 to 3 m. Results of drawbar pull tests are shown in Figs. 13-16.
Figure 12
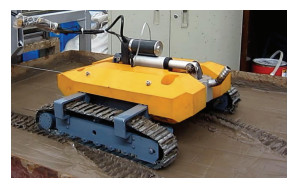 Figure 12 Drawbar pull test of seafloor tracked trencher model
 Figure 13
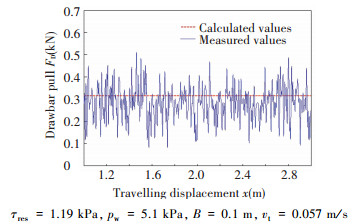 Figure 13 Result of test 1 in comparison with the calculated values according to SSP model
 Figure 14
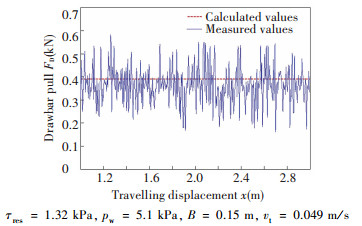 Figure 14 Result of test 2 in comparison with the calculated values according to SSP model
 Figure 15
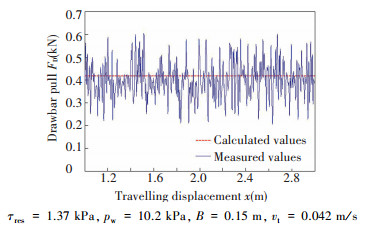 Figure 15 Result of test 3 in comparison with the calculated values according to SSP model
 Figure 16
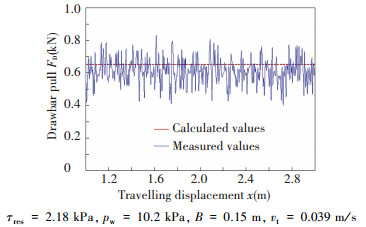 Figure 16 Result of test 4 in comparison with the calculated values according to SSP model
 The average value of slip iav can be calculated with the data obtained from encoders within the valid range. According to SSP model (Eq.(1)), with the drawbar pull analysis model (Eqs.(4, 8, 9, 13, 16)) and the values obtained from the shear stress-displacement tests and the pressure sinkage tests, the drawbar pull curves can be drawn as shown in Figs. 13-16.
As shown in Figs. 13-15, in a given soil and operating conditions, the contact area change (ΔB×L) influences tractive performance much more than the change of track loading (corresponding to contact pressure, Δpw). It should be noted that the compaction resistance RP will increase with the increase of the track width. So, for tractive performance, the optimizing matching with track width and contact length should be taken into account. As can be seen from Figs. 14-16, when contact area (2A) is a fixed value, the change of contact pressure (Δpw) has less influences on tractive performance for soft and cohesive soil. And the results of tests 2-4 also indicate that soil conditions (τres) affect significantly on tractive performance of seafloor tracked trencher.
As shown in Table 7, the relative errors of the mean effective values obtained from drawbar pull tests to the calculated values according to the SSP model are 16.8%, 12.7%, 9.4% and 11.6% respectively (Figs. 13-16). The causes of relative error are numerous. The residual shear strength of bentonite-water mixture is controlled by the water content of the bentonite-water mixture, but in the actual operation, it is very difficult to keep water content uniform; and the viscosity-plasticity process of bentonite-water mixture under self-weight cannot be uniform. The test equipment error (including measurement errors) may be another source of relative differences. But in general, the discrepancy of prediction values calculated by the SSP model is within allowable range.
表 7
(|FDC-FDM|/FDC×100%)
Calculated value (FDC) Mean of measured values (FDM)
1 0.264 0.317 0.264 16.8
2 0.217 0.392 0.342 12.7
3 0.202 0.424 0.383 9.4
4 0.173 0.657 0.581 11.6
Table 7 Performance values obtained from tests and relative errors
In summary, as shown in Table 7, by comparing the calculated values with the measured values from verification tests, the following conclusions can be drawn: 1) the drawbar pull analysis model based on the basis of the SSP model is feasible and effective for the seafloor tracked trencher; 2) from another side, the drawbar pull tests indicate that the SSP model is valid; 3) normal working contact pressure has less influence on tractive performance for soft and cohesive soil of seafloor, and the optimizing matching with track width and the contact length should be taken into account for better tractive performance.
4 Conclusions1) The shear stress-displacement relationship model of soil is very important to predict the tractive performance of tracked vehicle. The most shear stress-displacement models were proposed mainly for the terrestrial field of terramechanics. They may be not suit for the soft seafloor soil with flow surface and high water content. On the basis of the track segment shear tests and the comprehensive analysis of the shear deformation of the seafloor soil substitute (bentonite water mixture), a saturated soft-plastic soil shear stress-displacement model (SSP model) was proposed. Series of track segment shear tests were carried out. Results of the tests showed that the SSP model can predict the behavior of track segment with good approximation.
2) Through the analysis of the main external forces, including environmental loads from the seafloor soil and the sea current applied to seafloor tracked trencher during the uniform linear trenching process, drawbar pull analysis model was deduced with the SSP model. A scale test model of seafloor tracked trencher was built, and the verification tests for drawbar pull analysis model were designed and carried out. Results of the verification tests indicated that the drawbar pull analysis model is feasible and effective. And the verification tests also proved that the SSP model is valid from another side.
3) After analyzing and treating the test data obtained from the drawbar pull tests, the following conclusions can be obtained: a) soil condition significantly affects the tractive performance of seafloor tracked trencher; b) the normal working contact pressure has less influence on tractive performance for soft and cohesive soil of seafloor; c) the optimizing matching with track width and the contact length should be taken into account for better tractive performance.
There are still some kinks to be worked out. During the testing process, it is found that a certain energy high-frequency vibration would significantly weaken the shear strength of bentonite water mixture. Underwater tracked operating equipment is inevitably equipped with high power pump stations and motors. The use of these power units is always accompanied with high-energy and high-frequency vibrations. In powered status, these vibrations may be the source of the unknown subsidence and insufficient driving force. Future improvements of SSP model and drawbar pull analysis model will take account of the effects of high-frequency vibration on soil strength. In addition, considering the effects of changes of contact pressure, track width and contact length on tractive performance, the work of parameter optimized matching will be carried out including quantitative calculation and experimental verification.
References
[1] Vize S, Adnitt C. Review of Ccabling Techniques and Enviromental Effects Applicable to the Offshore Wind Farm Industry. UK: Department for Business Enterprise & Regulatory Reform, 2008.11-14. (
 0)
0)[2] Farlinger D, MacPhail A, Ryan J. Potential Use of Submarine or Underground Cables for Long Distance Electricity Transmission in Manitoba. Manitoba: Manitoba Hydro, 2011. 23-26. (
 0)
0)[3] Janosi Z, Hanamoto B. Analytical determination of drawbar pull as a function of slip for tracked vehicle in deformable soils. Proceeding of the 1st International Conference of ISTVES. Torino: International Society for Terrain-Vehicle Systems, 1961. 707-726. (
 0)
0)[4]Watanabe K, Kitano M. Study on steerability of articulated tracked vehicles-Part 1. Theoretical and experimental analysis.Journal of Terramechanics, 1986, 23(2): 69-83.DOI:10.1016/0022-4898(86)90015-7(
 0)
0)[5]Kitano M, Jyozaki H. A theoretical analysis of steerability of tracked vehicle.Journal of Terramechanics, 1976, 13(4): 241-258.DOI:10.1016/0022-4898(76)90045-8(
 0)
0)[6] Baladi G Y, Rohani B. A mathematical model of terrain vehicle interaction for predicting the steering performance of track-laying vehicles. Proc of the 6th ISTVS Conference. Vienna, Austria, 1978.285-332. (
 0)
0)[7] Schulte E, Handschuh R, Schwarz W, et al. Transferability of soil mechanical parameters to traction potential calculation of a tracked vehicle. Proceedings of the 5th ISOPE Ocean Mining Symposium. Tsukuba: The International Society of Offshore and Polar Engineers, 2001.123-131. (
 0)
0)[8] Kim H W, Hong S, Choi J S. Dynamic analysis of underwater tracked vehicle on extremely soft soil by using euler parameters. Proceedings of the 6th ISOPE Ocean Mining Symposium. Changsha: The International Society of Offshore and Polar Engineers, 2005.362-375. (
 0)
0)[9]Wu H Y, He J S. Establishment of the deep-sea soft sediments shearing strength-shear displacement model.Modern Applied Science, 2010, 4(1): 21-27.(
 0)
0)[10] Enderby A L. Deep-Sea Sediments: Physical Mechanical Properties. New York: Plenum Publ Corp, 1974. 27-49. (
 0)
0)[11]Bekker M G. Off the Road Locomotion: Research and Developments in Terramechanics. Michigan: Ann Arbor, MI, University of Michigan Press, 1960.(
 0)
0)[12]Upadhyaya S K, Wulfohn D, Jubbal G, et al. Traction prediction equations for radial ply tires.Journal of Terramechanics, 1989, 26(2): 149-175.DOI:10.1016/0022-4898(89)90004-9(
 0)
0)[13]Li L, Li S L. Simulation and mechanical characteristics of terramechanics of the surface soil on deep-sea bed.Engineering Mechanics, 2010, 27(11): 213-220.(
 0)
0)[14]Bekker M G. Introduction to Terrain-Vehicle Systems. Michigan: Ann Arbor, MI, University of Michigan Press, 1969.(
 0)
0)[15] Reece A R. Principles of soil-vehicle mechanics. Proceedings of the Institution of Mechanical Engineers, part 2A. Indiana:Addison-Wesley Pub Co, 1965, 180(1): 45-66. (
 0)
0)[16]Wong J Y, Preston J, Thomas J. On the characterization of the shear stress-displacement relationship of Terrain.Journal of Terramechanics, 1983, 19(4): 221-232.(
 0)
0)