Hao Leng, Jianmin Gao, Mingyue He, Min Xie, Qian Du, Rui Sun, Shaohua Wu
(Institute of Combustion Engineering, Harbin Institute of Technology, Harbin 150001, China)
Abstract:
In order to research ammonia escape in CO2 absorption by ammonia scrubbing, ammonia escape was studied in CO2 absorption process using the bubbling reactor in different conditions as gas flow rate, CO2 ratio, absorbent temperature and ammonia concentration and quantity of escaped ammonia was measured by chemical titration. The results indicated that, the amount of ammonia escape can be around 20% of original amount in 90 min and the escaped amount will increase with the rise of gas flow rate, absorbent temperature, concentration of ammonia while decrease as CO2 ratio goes up. Through the analysis of the law of ammonia escape, at the same time, combined with ammonia escape and the influence of the relationship between the CO2 absorption efficiency, reducing ammonia escape working condition parameter optimization is given.
Key words: CO2 capture ammonia escape bubbling reactor chemical titration
DOI:10.11916/j.issn.1005-9113.2016.01.011
Clc Number:TK16
Fund:
Leng Hao, Gao Jianmin, He Mingyue, Xie Min, Du Qian, Sun Rui, Wu Shaohua. Parameter Optimization on Experimental Study to Reduce Ammonia Escape in CO2 Absorption by Ammonia Scrubbing[J]. Journal of Harbin Institute of Technology, 2016, 23(1): 75-81. DOI: 10.11916/j.issn.1005-9113.2016.01.011.

Fund Sponsored by the National High Technology Research and Development Program (International Science and Technology Cooperation Program) (Grant No.2010DFA24580-502) Corresponding author E-mail: yagjm@hit.edu.cn Article history Received: Oct 26, 2014
Contents Abstract Full text Figures/Tables PDF
Parameter Optimization on Experimental Study to Reduce Ammonia Escape in CO2 Absorption by Ammonia Scrubbing
Leng Hao, Gao Jianmin

 , He Mingyue, Xie Min, Du Qian, Sun Rui, Wu Shaohua
 Institute of Combustion Engineering, Harbin Institute of Technology, Harbin 150001, China
Received: Oct 26, 2014
fund: Sponsored by the National High Technology Research and Development Program (International Science and Technology Cooperation Program) (Grant No.2010DFA24580-502)
Corresponding author: E-mail: yagjm@hit.edu.cn
Abstract: In order to research ammonia escape in CO2 absorption by ammonia scrubbing, ammonia escape was studied in CO2 absorption process using the bubbling reactor in different conditions as gas flow rate, CO2 ratio, absorbent temperature and ammonia concentration and quantity of escaped ammonia was measured by chemical titration. The results indicated that, the amount of ammonia escape can be around 20% of original amount in 90 min and the escaped amount will increase with the rise of gas flow rate, absorbent temperature, concentration of ammonia while decrease as CO2 ratio goes up. Through the analysis of the law of ammonia escape, at the same time, combined with ammonia escape and the influence of the relationship between the CO2 absorption efficiency, reducing ammonia escape working condition parameter optimization is given.
Key words: CO2 capture ammonia escape bubbling reactor chemical titration
1 IntroductionDuring the past decades, excessive emission of carbon dioxide (CO2) especially those from fossil fuel combustion had caused serious environmental problems like “global warming”, which drew widely attention all around the world. Thus techniques about CO2 capture and storage (CCS) were brought out and got extensively researched. Among them, CO2 absorption using aqueous ammonia has been a hot subject for its relatively high efficiency[1] and low cost[2]. The researchers investigated the influence of ammonia concentration and temperature, gas component and flow rate of CO2 and other factors on CO2 absorption by bubbling tower[3-4], stirring kettle[5], packed tower[6], sieve-plate tower[7], overweight bed reactor[8] and so on. However, for its extreme volatility, ammonia will easily volatilize from aqueous solution, get transported by carrier gas, and finally escape out of absorption system, which will consequentially lead to a lower utilization of ammonia. Besides, gaseous ammonia is irritant and poisonous[9] and the escaped ammonia will do much harm to human health. Zhang et al.[10] measured that the reaction gas NH3 volume components can reach 1.3%-3.6% with 4%-20% NH3 solution in the cross-flow rotating disc type overweight bed for CO2 absorption test. Corti et al.[11] using Aspen Plus TM simulated pressurized ammonia decarbonization system in which ammonia concentration was 2%-4%, CO2 removal efficiency was 80%, and the NH3 volume composition in the tail flue gas of system was 0.4%-1.2%. Amount of ammonia volatilization, escape will further increase with the increase of ammonia concentration. Resnik et al.[12] found that ammonia loss of regenerative process was apparent in the semi continuous absorption and desorption cycle test. For example, ammonia loss can be up to 43.1% with 14% ammonia. As a result, it is badly needed that studying on ammonia escape and method for limiting for further perfection of CO2 capture techniques.
As of now, pilot study about ammonia escape has been partly performed. Traditional methods for ammonia detection including ammonium ion-selective electrode[13], ion chromatography[14] and some other ways for ammonia-N concentration detect in sewage, but equipment was not applicated widely in common lab. In gas phase, ammonia measurement could be realized by FTIR (fourier transform infrared spectroscopy) and examples were seen in fertilizer detection field for reducing NH3volatilization[15]. All these methods rely on high precision instrument and its application was hard to expand. Actually, ammonia detect independent of equipment limit can be realized by chemical titration just as element-N detect in fertilizer manufacturing[16] of which the feasibility and veracity are widely acknowledged[17]. In this work, acid-base titration were adopted for ammonia measuring in liquid phase from which the loss of ammonia could be known by calculating.
The transfer rate of ammonia from liquid to gas has relation toammonia concentration in liquid phase and partial pressure of NH3 in gas phase. In further analysis, ammonia concentration is dependent upon extent of ammonia-hydrate ionization which is influenced by temperature of absorbent. And NH3 partial pressure is related with ratio of CO2 and update rate of gas flow[18]. So ammonia concentration, absorbent temperature, rate and CO2 ratio of gas flow are the key factors which control ammonia volatilization. The objective of this work is to study the four factors effect on ammonia escape, and design an appropriate working condition.
2 Experimental Method2.1 Experimental SetupExperimental setup for ammonia escape is shown in Fig. 1. A gas-washing bottle of 250 mL is adopted as the bubbling reactor, which is connected by a gas control system and analyzing system for exhaust gas and sample solution. Gas producing system is used to control flow rate and ratio of mixed gases. As flow rate (1 L/min) is relatively high to absorbent volume (0.1L), turbulence is intense and concentration profile can be seen as evenly distributed. Infrared CO2 analyzer is used to analyze CO2 concentration of exhaust gas. Thermostatic water-bath is to control the absorbent temperature. Phosphoric acid in gas-washing bottles is used as cleanup-unit to removal NH3 in the exhaust gas. Besides these, a set of burettes of 25 mL and a pipette of 0.1mL are adopted for titration and sampling. During the experiment, liquid pH value and temperature value are measured every once in a while. Meanwhile, 0.1 mL of absorbent is taken for each of titration experiment. The influence of sampling on original absorbent can be ignored because it is too little compared with the total.
Figure 1
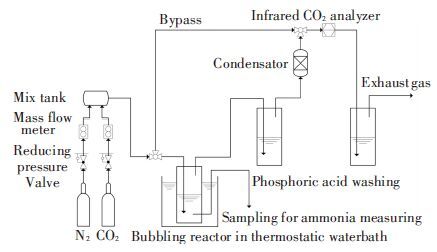 Figure 1 Experimental setup for ammonia escape
 2.2 Measure the Quantity of Escaped Ammonia by TitrationIn this experiment, mixed gases of N2 and CO2 were introduced into bubbling reactor filled with strong aqueous ammonia. During this process chemical reactions were performed as formulas (1) -(5) [19] along with ammonia volatilization as formula(6) .
$C{O_2} + N{H_3} \leftrightarrow N{H_2}COOH$ (1)
$N{H_2}COOH + N{H_3} \to N{H_2}COON{H_4}$ (2)
$N{H_2}COON{H_4} + {H_2}O \leftrightarrow N{H_4}HC{O_3} + N{H_3}$ (3)
$N{H_4}HC{O_3} + N{H_3} \leftrightarrow {(N{H_4})_2}C{O_3}$ (4)
$N{H_2}COON{H_4} + C{O_2} + 2{H_2}O \leftrightarrow 2N{H_4}HC{O_3}$ (5)
$N{H_3}{H_2}O \leftrightarrow N{H_3} \uparrow (gas) + {H_2}O$ (6)
From the study of Lin[20], a little of CO2would dissolve as formula (7) and then react with ammonia as formula (8) , but it’s not the leading process for its slow rate[21].
$C{O_2} + {H_2}O \leftrightarrow {H_2}C{O_3}$ (7)
${H_2}C{O_3} + N{H_3} \leftrightarrow N{H_4}HC{O_3}$ (8)
As a result of reactions above, there exist molecules of CO2, H2O, NH3·H2O, H2CO3 and ions of NH4+, H+, OH-, NH2COO-, NH4CO3-, HCO3- and CO32- in solution which is alkaline[22-23].
To measure the amount of remained ammonia and calculate the escape quantity, absorption solution should be dealt with as follows.
Firstly, 0.1mL samples from absorption solution in bubbling reactor by a pipette of 0.1mL were put into 50 mL deionized water and then pH-indicator of methyl red was added. Then add excess but quantitative standard sulfuric acid (H2SO4) solution by a set of acid burette of 25 mL into it to convert all NH3·H2O or ammonium compound into (NH4)2SO4 as formula (9) .
$\eqalign{ & Ammoniumcompound\buildrel {{H_2}S{O_4}(excess)} \over \longrightarrow {(N{H_4})_2}S{O_4} + \cr & {H_2}S{O_4}(redundant) \cr} $ (9)
where ammonium compounds include NH2COOH, NH2COONH4, NH4HCO3, (NH4)2CO3, and NH3·H2O.
Secondly, the aqueous mixture was boiled for 3-5 min to get rid of CO2 and CO32- completely. CO2 would be escaped and only (NH4)2SO4 was left in the solution of redundant H2SO4 as formula (10) .
$\eqalign{ & Carbonates\mathrel{\mathop{\kern0pt\longrightarrow}\limits_{Heat}^{{H_2}S{O_4}(excess)}} C{O_2} \uparrow + {H_2}O + {H_2}S{O_4} \cr & (redundant) \cr} $ (10)
where carbonates include NH4HCO3, (NH4)2CO3, and H2CO3.
Thirdly, the redundant H2SO4 was neutralize by standard caustic soda (NaOH) solution as formula (11) until reaching neutral which can be distinguished by color change of methyl red[24]. The consumption of standard caustic soda (NaOH) solution was recorded. The operation was repeated in every 15 min.
${H_2}S{O_4}(redundant) + 2NaOH \to N{a_2}S{O_4} + 2{H_2}O$ (11)
At this time, only (NH4)2SO4 and Na2SO4 exited in sample solution. The anion-cation balance of solution will exist as function (12) . Then the amount of NH4+could be got as function (13) , amount of escaped ammonia could be calculated as function (14) .
$n(NH_4^ + ) + n(N{a^ + }) = 2n(SO_4^{2 - })$ (12)
$n{(NH_4^ + )_{in{\rm{ solution}}}} = 2 \times n({H_2}S{O_4}) - n(NaOH)$ (13)
$n{(N{H_3})_{volatilized}} = n{(ammonia)_{original}} - n{(NH_4^ + )_{in{\rm{solution}}}}$ (14)
where n represents molar amount (mol).
2.3 Environment Conditions and SsuppliesDetails of experimental conditions and supplies are listed in Table 1.
表 1
Comments1000.1200.10.10.1
Table 1 Conditions and supplies
2.4 Measurement Error of Chemical TitrationIn order to make sure the measure error and prove the precision and reliability of chemical titration, we use both the method of chemical titration and FTIR to measure the quantity of escaped ammonia under same conditions as listed in Table 2.
表 2
Comments4.30.120.00.114.01.0
Table 2 Supplies and experiment condition
2.4.1 Ammonia loss measured by titrationThis experiment was reacted 60 min and 2 samples were taken for titration every 15 min. Resultsare listed in Table 3. It is evident that ammonia in liquid phase can be distinguished easily by this method and the concentration change is remarkable.
表 3
01st
2nd0.430
0.4300
0
151st
2nd0.403
0.4030.027
0.027
301st
2nd0.384
0.3830.046
0.047
451st
2nd0.373
0.3750.057
0.055
601st
2nd0.368
0.3700.062
0.060
Table 3 Results of ammonia loss from absorbent
2.4.2 Ammonia escape measured by FTIRAll gases flowing out of absorbent will be monitored by FTIR (fourier transform infrared spectroscopy-Gasmet DX4000) and ammonia concentration would be recorded continuously. After the total gas flow was tested, flow rate of ammonia could be got through function (15) and quantity of escaped ammonia be equaled to integrated value of this rate as function (16) .
$L(N{H_3}) = {L_{total}} \times \varphi (N{H_3}) \times 100\% $ (15)
where L is the volume flow rate (L/min); φ(NH3) is the volume concentration of NH3 recorded by FTIR.
$n{(N{H_3})_{escaped}} = {{\int_0^t {L(N{H_3})dt} } \over {22.4}} \times {T \over {{T_0}}}$ (16)
where t is the time (min); T is the room temperature (K); T0 is 273.15(K).
The volume ratio is recorded constantly as Fig. 2 which is shown in black line and calculated integral results for n(NH3) escaped in blue line.
Figure 2
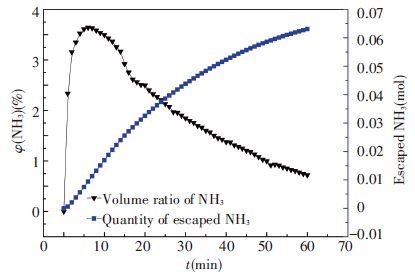 Figure 2 Volume ratio and mole quantity of escaped NH3
 2.4.3 Measurement error and discussions FTIR is a highly precise instrument whose relative error is less than ±2%,so escaped quantity calculated from function (14) can be tested and verified by that from function (16) and result error of titration could be given as function (17) .
$\delta = {{{n_{loss}} - {n_{escaped}}} \over {{n_{escaped}}}} \times 100\% $ (17)
From the above, we can get two results about NH3 loss (escape) that one from chemical titration and the other from FTIR. Obviously, these two results have a good fit and relative error is within ±7.31% as given in Fig. 3 and Table 4. Also, the stability and constancy can keep in a good state without being influenced by concentration change.
Figure 3
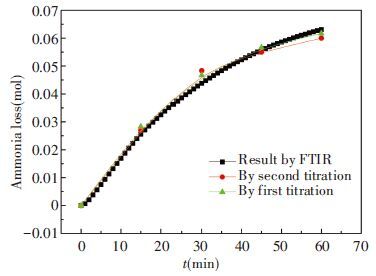 Figure 3 Comparison of results between titration and FTIR
 表 4
01st
2nd0
00-
-
151st
2nd0.027
0.0270.02565.470
5.470
301st
2nd0.048
0.0470.04385.023
7.310
451st
2nd0.057
0.0550.05572.330
-1.260
601st
2nd0.062
0.0610.0631-1.740
-3.330
Table 4 Relative error of measurement
The precision of FTIR is acknowledged widely, so the well fitted result of chemical titration could be seen feasibly and reliably.
3 Results and Discussion3.1 Effect of Original Ammonia ConcentrationIn the first group of experiments, four different concentration of aqueous ammonia are used as CO2 absorbent. The different concentrations of original ammonia aqueous are 7.2, 5.4, 3.4 and 1.2 mol/L, respectively. The absorbent temperature is 20 ℃, flow rate of mixed gases was 1.0 L/min and ratio of CO2 is at 13.6%. The concentration of ammonia is measured by titration and the results are shown in Fig. 4. CO2 removal efficiency at the same period is shown in Fig. 5.
Figure 4
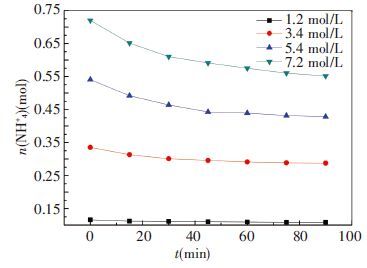 Figure 4 Changes of ammonia amount in 1st group
 Figure 5
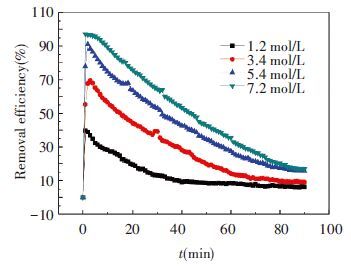 Figure 5 Removal efficiency of CO2 in 1st group
 It can be seen from Fig. 4, the highest original concentration is effected largest and the ammonia escape resulting in ammonia amount is decreased by 23.44% from 0.72mol to 0.55 mol in the whole experimental process. This is the biggest drop compared with the other three ammonia solutions which are decreased by 20.8%, 14.1%, and 6.5%, respectively. Apparently, the higher concentration of original ammonia, the more ammonia escapes. This is because higher concentration of ammonia will have a stronger driving force.
However, from Fig. 5 we can know that low ammonia concentration will lessen CO2 removal efficiency (defined as function 18) notably. If original concentration is below 3 mol/L, the highest removal efficiency will drop remarkably which is not satisfiable for actual condition and absorption capability is also unacceptable. This has the same conclusion with Hsu’s[25].
$e = {{{V_{C{O_2}, in}} - {V_{C{O_2}, out}}} \over {{V_{C{O_2}, in}}}} \times 100\% $ (18)
3.2 Effect of Absorbent TemperatureIn the second group of experiments, original ammonia concentration is intended to be 6.5 mol/L, flow rate is 1.0L/min and ratio of CO2 is 13.6%. The absorbent temperatures are 20, 30, 40 and 50 ℃, respectively. The results are shown in Figs. 6 and 7.
Figure 6
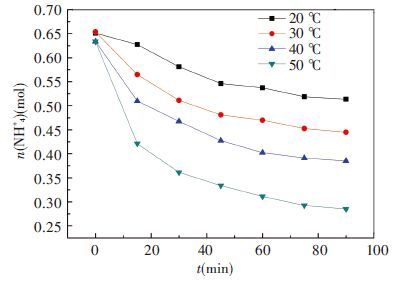 Figure 6 Changes of ammonia amount in 2nd group
 Figure 7
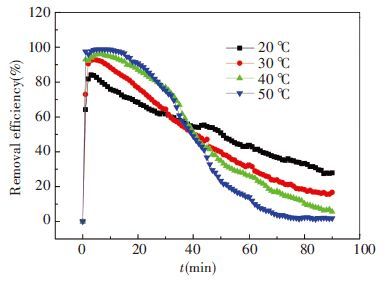 Figure 7 Removal efficiency of CO2 in 2nd group
 As shown in Fig. 6, high temperature will accelerate the escape rate making ammonia amount drop from 0.63mol to 0.29 mol in 90 min. The significant reduction is 55.0% compared with 39.3% in 40 ℃, 31.9% in 30 ℃ and 21.1% in 20 ℃, respectively. Apparently, temperature has significant influence on ammonia escape. This is because the E (Henry's constant) is rise by high temperature which makes mass transfer driving force stronger[26]. Thus in actual CO2 absorption condition absorbent temperature is expected to be as low as possible.
Fig. 7 shows CO2 removal efficiency of four conditions. Firstly we can observe that in the former 30 min, higher temperature can help improve efficiency but not distinct. This is because high temperature can accelerate chemical reaction rate. Secondly, efficiency dropped more quickly in higher temperature condition for it makes more dramatic reduction in ammonia concentration leading to lower the absorption ability. Likewise, Alston’s chilled ammonia process[27] recommended the 0-10 ℃ as CO2 absorption temperature, its purpose is the same as the original intent of lower temperature to control the ammonia escape.
3.3 Effect of Gas Flow RateIn the third group of experiment, original ammonia concentration is 7.3mol/L, absorbent temperature is 20 ℃ and ratio of CO2 is 13.6%. The flow rates are 0.5, 0.75, 1.0 and 1.25 L/min, respectively. The results are shown in Figs. 8 and 9.
Figure 8
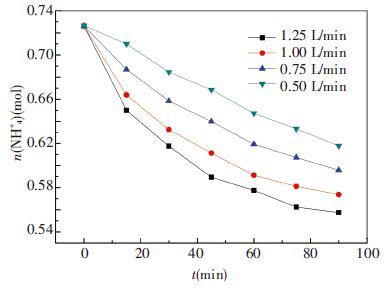 Figure 8 Changes of ammonia amount in 3rd group
 Figure 9
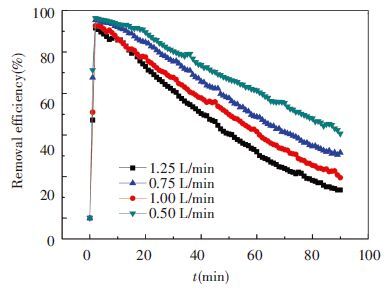 Figure 9 Removal efficiency of CO2 in 3rd group
 From Fig. 8, we can see that the faster gas flows, the more ammonia escapes. In 90 minutes, the most intense ammonia loss is 23.6% of original absorbent from 0.73 mol to 0.56 mol. The others are 21.0% at 1.0 L/min, 18.1% at 0.75 L/min and 14.6% at 0.5 L/min, respectively. This is because faster gas flow makes gas phase update more quickly and partial pressure of NH3 is reduced relatively which makes ammonia volatilizes more easily. On the other hand, higher rate of gas flow has a bigger capacity that can contain and carry more volatilized NH3 resulting in more ammonia loss.
Fig. 9 shows different CO2 removal efficiencies of four conditions. In the initial time of experiment, efficiency has a little difference but in later period the difference gradually increase. This is due to the working condition of high volume flow rate of ammonia escape serious, its liquid absorption ability is relatively obvious, so CO2 removal efficiency drops rapidly. The conclusions can be got that low gas-liquid ratio is beneficial to improve the efficiency of CO2 absorption, at the same time to maintain a longer time of efficient absorption.
3.4 Effect of CO2 Ration in Mixed GasIn the fourth group of experiment, the concentration of original ammonia is 7.1mol/L, absorbent temperature is 20 ℃, and flow rate is at 1.0L/min. CO2 ratio is adjusted in mixed gas at 15%, 10%, 5% and 0, respectively. The effect of CO2 ration on ammonia escape is shown in Fig. 10 and CO2 removal efficiency is shown in Fig. 11.
Figure 10
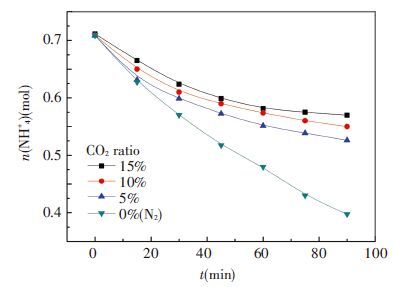 Figure 10 Changes of ammonia amount in 4th group
 Figure 11
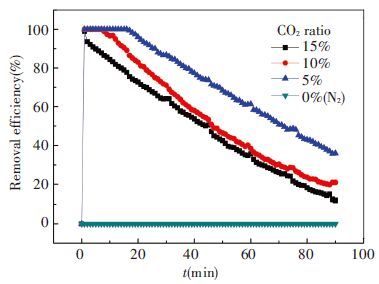 Figure 11 Removal efficiency of CO2 in 4th group
 In Fig. 10, the amount of ammonia at 0% CO2 has a linear decrease in the whole 90 min which makes ammonia loss reach 43.9% of original absorbent from 0.71 mol to 0.30 mol. This trend has a significant difference with the other three because absorbent is not carbonation molecular state during whole process. Mass transfer driving force of it is much stronger than those carbonation into ionic state mostly. Inversely, for other three conditions, the higher CO2 load is, the less ammonia would be escaped. This makes 15% CO2 be the least ammonia loss. Then, high CO2 ratio is recommended. As flue gas from industry like power plant is around 15%, it is absolutely unnecessary to reduce CO2 ratio.
As four conditions have different CO2 ratios, the CO2 removal efficiency of them is not comparable and Fig. 11 is just given as reference.
4 Conclusions1) Chemical titration is a simple and effective method for ammonia measuring in liquid phase. In this study, the relative error is within -3.33%-7.31% compared with result by FTIR. For CO2 absorption using ammonia scrubbing, ammonia escape is intense which can be about 20%-55% of original absorbent. The basic rule of ammonia escape and favorable conditions or the parameter optimization is as follows: low concentration of ammonia absorption liquid is beneficial to reduce ammonia escape. Ammonia concentration from 7.2 mol/L to 1.2 mol/L can make the escape of ammonia content from 23.4% to 6.5%. Recommend concentration selection in actual working condition of 1 mol/L ammonia as the absorption liquid.
2) Temperature condition is beneficial to reduce ammonia escape. Absorption temperature rating from 50 ℃ and 20 ℃ can reduce amount of ammonia escape from 48.7% to 18.3%, and low temperature is beneficial to maintain the CO2 absorption efficiency at the same time. Suggesting that the actual working condition of selecting 20 ℃ as absorption temperature.
3) Low flue gas volume flow rate is conducive to reducing ammonia escape. Flue gas volume flow rate from 1.25L/min to 0.50 L/min can make the amount of ammonia escape from 24.1% to 14.6%. Low flue gas volume flow rate at the same time maintain CO2 absorption efficiency. Suggesting that choosing smaller flue gas volume flow rate.
References
[1]Hsunling B, Chin Y A. Removal of CO2 greenhouse gas by ammonia scrubbing.Industrial & Engineering Chemistry Research,1997, 36(6): 2490-2493.(
 0)
0)[2]Ciferno J P, Philip D P, Thomas T. An economic scoping study for CO2 capture using aqueous ammonia.Washington D C: US Department of Energy (DOE), 2005.(
 0)
0)[3]Hsunling B, Chin Y A. Removal of CO2 greenhousegas by ammonia scrubbing.Industrial & Engineering Chemistry Research,1997, 36: 2490-2493.(
 0)
0)[4]Yeh A C, Bai H. Comparison of ammonia and monoethanolamine solvents to reduce CO2 greenhouse gas emissions.Science of the Total Environment,1999, 228(2): 121-133.(
 0)
0)[5]Hsu C. Study on carbon dioxide removals from flue gas using chemical absorption method .Taiwan: Cheng Kung University, 2003.
Hsu C. Study on carbon dioxide removals from flue gas using chemical absorption method .Taiwan: Cheng Kung University, 2003. (
 0)
0)[6]Zhang Mao, Wu Shaohua, Li Zhenzhong. Power plant CO2 capture and resource recovery technology.Power System Engineering,2005, 23(3): 239-243.(
 0)
0)[7]DiaoYongfa, Zheng Xianyu, He Boshu. Experimental study on capturing CO2 greenhouse gas by ammonia scrubbing.Energy Conversion and Management,2004, 45: 2283-2296.(
 0)
0)[8]Zhang Jun, Gong Maoli, Jia Jiangxia. Study on removal of low concentration CO2 from flue gas by aqueous ammonia under HIGEE at normal atmosphere.Journal of Anhui University of Science and Technology, Natural Science,2006, 26(1): 48-51.(
 0)
0)[9]Wang Yu. Effect of ammonia impact on indoor environment quality in civil architecture.Forestry Science and Technology Information,2007, 2: 88-89.(
 0)
0)[10]Zhang Jun, Gong Maoli, Jia Jiangxia, et al. Enhancing the ammonia absorption of CO2 in flue gas by Higee.Anhui University of Science and Technology (Natural Science Edition),2006, 26(1): 48-51.(
 0)
0)[11]Andrea C, Lidia L. Reduction of carbon dioxide emissions from a SCGT/ CC by ammonia solution absorption:preliminary results.International Journal of Thermodynamics,2004, 7: 173-181.(
 0)
0)[12]Resnik K P, William G, Hreha D C, et al. A parametric scan forregenerativeammoniabased scrubbing for the capture of CO2. Proceedings of 23rd Annual International Pittsburgh Coal Conference. Pittsburgh, 2006.
Resnik K P, William G, Hreha D C, et al. A parametric scan forregenerativeammoniabased scrubbing for the capture of CO2. Proceedings of 23rd Annual International Pittsburgh Coal Conference. Pittsburgh, 2006. (
 0)
0)[13]Liu W, Zheng W, Sun Z. On line method of measuring ammonia-nitrogen in the ocean using three-electrode combined probe.Journal of Tianjin University,2001, 34(2): 133-136.(
 0)
0)[14]Dong H, Zeng L. An on-line method of measuring gaseous ammonia and ammonium in aerosol in atmosphere.Acta Scientiarum Naturalism Universities Pekinensis,2007, 43(6): 816-821.(
 0)
0)[15]Tong J, Wei X, Liu Z. Analyzing NH3 volatilization of different fertilizers by FTIR spectra measurement.Spectroscopy & Spectral Analysis,2009, 29(7): 1872-1875.(
 0)
0)[16]GB3599-2001, Standard for agricultural ammonium bicarbonate testing in China.
GB3599-2001, Standard for agricultural ammonium bicarbonate testing in China. (
 0)
0)[17]Lin Shuchang, Zeng Yonghuai. Acid-base titration principle.Beijing: Higher Education Press, 1989: 295-297.(
 0)
0)[18]Liu Y. Process and technique of supergravity chemical industry.Beijing: National Defense Industry Press, 2009: 103-107.(
 0)
0)[19]Liu Fang, Wang Shujuan, Chen Changhe, et al. Research progress of CO2 capture by using ammonia from flue gas of power plant.CIESC Journal,2009, 2: 269-278.(
 0)
0)[20]Qian Zhikui. Kinetics of carbonation process in the production of soda.Soda Industry,1997, 1: 32-37.(
 0)
0)[21]Nanjing Institute of Chemical Technology Mineral Engineering, Teaching and Research Group. A translation of ammonium bicarbonate.Beijing: China Industry Press, 1965: 11-24.(
 0)
0)[22]Hatch T F, Pigford R L. Simultaneous absorption of carbon dioxide and ammonia in water.Industrial and Engineering Chemistry Research Fundamentals,1962, 1(3): 209-213.(
 0)
0)[23]Pazuki G R, Pahlevanzadeh H, Mohseni A. A solubility of CO2 in aqueous ammonia solution at low temperature.Computer Coupling of Phase Diagrams and Thermochemistry,2006, 30: 27-32.(
 0)
0)[24]Zhao Fengying, Hu Kandong. Analytical chemistry. Beijing: Press of University of Science and Technology of China, 2005. 104-109.
Zhao Fengying, Hu Kandong. Analytical chemistry. Beijing: Press of University of Science and Technology of China, 2005. 104-109. (
 0)
0)[25]Hsu Chiahao. Study on carbon dioxide removals from flue gas using chemical absorption method. Taiwan: Cheng Kung University , 2003.
Hsu Chiahao. Study on carbon dioxide removals from flue gas using chemical absorption method. Taiwan: Cheng Kung University , 2003. (
 0)
0)[26]Liu Youzhi. Chemical process and technology on supergravity.Beijing: National Defense Industry Press, 2009: 103-107.(
 0)
0)[27]Darde V, Thomsen K, Willy J M, et al. Chilled ammonia process for CO2 capture.Greenhouse Gas Control Technologies 9. Proceedings of the 9th International Conference on Greenhouse Gas Control Technologies (GHGT-9) . Energy Procedia,2009(1): 1035-1042.(
 0)
0)