Xiaoling Liu, Qiao Huang, Yuan Ren
(School of Transportation, Southeast University, Nanjing 210096, China)
Abstract:
In order to improve the accuracy and consistency of data in health monitoring system, an anomaly detection algorithm for stay cables based on data fusion is proposed. The monitoring data of Nanjing No.3 Yangtze River Bridge is used as the basis of study. Firstly, an adaptive processing framework with feedback control is established based on the concept of data fusion. The data processing contains four steps: data specification, data cleaning, data conversion and data fusion. Data processing information offers feedback to the original data system, which further gives guidance for the sensor maintenance or replacement. Subsequently, the algorithm steps based on the continuous data distortion is investigated,which integrates the inspection data and the distribution test method. Finally, a group of cable force data is utilized as an example to verify the established framework and algorithm. Experimental results show that the proposed algorithm can achieve high detection accuracy, providing a valuable reference for other monitoring data processing.
Key words: stay cable health monitoring anomaly detection data fusion manual inspection
DOI:10.11916/j.issn.1005-9113.2016.03.003
Clc Number:U448.27
Fund:
Liu Xiaoling, Huang Qiao, Ren Yuan. Anomaly Detection Algorithm for Stay Cable Monitoring Data Based on Data Fusion[J]. Journal of Harbin Institute of Technology, 2016, 23(3): 39-43. DOI: 10.11916/j.issn.1005-911.

Fund Sponsored by the National Natural Science Foundation of China (Grant No. 51208096); Major Scientific and Technological Special Project of Jiangsu Provincial Communications Department (Grant No. 2014Y02); The Project of Jiangsu Provincial Communications Department (Grant No.2012Y25) Corresponding author E-mail:qhuanghit@126.com. Article history Received: 2015-10-02
Contents Abstract Full text Figures/Tables PDF
Anomaly Detection Algorithm for Stay Cable Monitoring Data Based on Data Fusion
Liu Xiaoling, Huang Qiao

 , Ren Yuan
 School of Transportation, Southeast University, Nanjing 210096, China
Received: 2015-10-02
Fund: Sponsored by the National Natural Science Foundation of China (Grant No. 51208096); Major Scientific and Technological Special Project of Jiangsu Provincial Communications Department (Grant No. 2014Y02); The Project of Jiangsu Provincial Communications Department (Grant No.2012Y25)
Corresponding author: E-mail:qhuanghit@126.com.
Abstract: In order to improve the accuracy and consistency of data in health monitoring system, an anomaly detection algorithm for stay cables based on data fusion is proposed. The monitoring data of Nanjing No.3 Yangtze River Bridge is used as the basis of study. Firstly, an adaptive processing framework with feedback control is established based on the concept of data fusion. The data processing contains four steps: data specification, data cleaning, data conversion and data fusion. Data processing information offers feedback to the original data system, which further gives guidance for the sensor maintenance or replacement. Subsequently, the algorithm steps based on the continuous data distortion is investigated, which integrates the inspection data and the distribution test method. Finally, a group of cable force data is utilized as an example to verify the established framework and algorithm. Experimental results show that the proposed algorithm can achieve high detection accuracy, providing a valuable reference for other monitoring data processing.
Key words: stay cable health monitoring anomaly detection data fusion manual inspection
1 Introduction For the operation safety, early warning and damage assessment of modern long-span bridges, they are usually equipped with structural health monitoring (SHM) systems suitable for their own features or demands[1]. Hundreds of sensors are installed in these SHM systems to monitor all kinds of index information[2-4]. So many test elements with continuous and long-term operation inevitably produce vast amounts of monitoring data. Meanwhile, due to a series of factors like sensor signal malfunctions, transfer omission and external environment interference, the collected data are incomplete, noise-polluted, or inconsistent[5]. The accuracy of monitoring data are an important premise of structural safety assessment. However, the immaturity of data processing technology in SHM systems has caused the accumulation of massive data[6-8], which may restrict the application of SHM systems in engineering projects.
In recent years, the idea of data fusion has received more and more attention especially for the bridge monitoring data processing[9-10]. Multiple sensors are usually used in SHM systems, such as vibration, cable force, stress and deformation. By synthetically processing the multiple-sensor information, data fusion can improve its intelligent degree of fault detection. There are a number of studies on data fusion methods in fault diagnosis, such as correlation fusion[11], temporal integration[12-13], fuzzy synthesis[14] and statistical methods[15] (hypothesis testing, Bayesian, etc.), which prove that data fusion is a powerful tool for solving the sensor fault diagnosis problem.
In this paper, on the basis of previous work, the data fusion method for health monitoring systems and manual inspection systems is studied. Firstly, the corresponding processing framework is established based on the idea of data fusion. Then, according to the features of data fusion of cable force, an anomaly detection algorithm is proposed. Finally, the framework and algorithm are verified with the monitoring data of Nanjing No.3 Yangtze River Bridge.
2 Data Processing Framework The SHM system of Nanjing No.3 Yangtze River Bridge was installed in May,2006.The 600 sensors can be categorized into 9 classes[16].In this study, data fusion technology is introduced to establish the data processing framework.As shown in Fig. 1, the data processing contains four steps: data specification, data cleaning, data conversion and data fusion. Abnormal data will be stored and puts feedback to the original data.Data fusion is the key step.The algorithm is described in the following section.
Figure 1
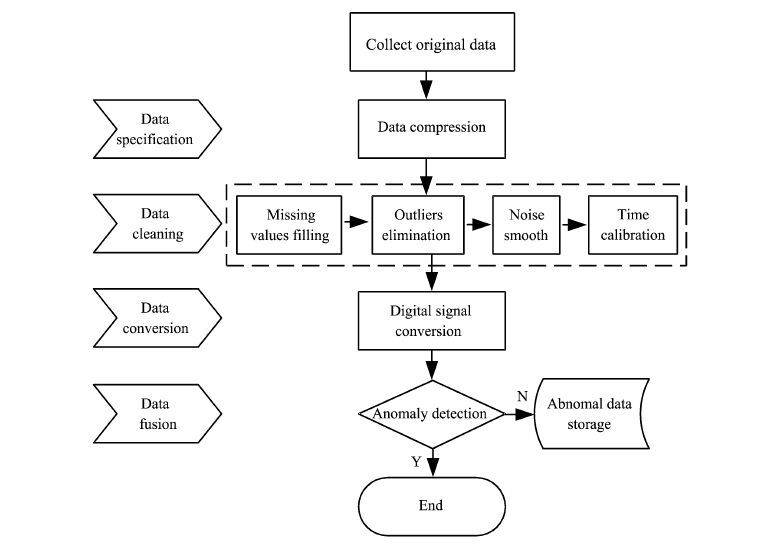 Figure 1 Data processing flow
 3 Data Fusion Algorithm Generally, the anomaly detection of cable force depends on the comparison and decision of the initial values. When the variation rate of the measured cable force exceeds the predefined threshold, an anomaly decision will be made. However, there are two problems in this method:
1) The threshold setting determines the accuracy of anomaly detection. Small threshold often loses normal cable force, while large threshold submerges abnormal cable force. Moreover, threshold setting is usually subjective and without a unified standard.
2) Continuous data distortion is usually complex, and thus it is difficult to recognize disordered data through simply utilizing data variation rate.
In view of this, this paper puts forward an anomaly detection algorithm based on data fusion to improve the consistency and accuracy of data anomaly detection. On one hand, the algorithm periodically checks the predefined data threshold by fusing the cable force; on the other hand, it combines the distribution test method for cable force. The detailed algorithm contains three steps:
1) To calculate the variation rate of the monitored and manual inspected cable force, and the variation rate of the average cable force measured by the i-th cable sensor with respect to the measured initial value is denoted di.
${d_i} = \left( {{c_i} - {c_{oi}}} \right)/{c_{oi}}$ (1)
where ci is the average monitored cable force for the i-th cable sensor (kN) and c0i is the original monitored cable force (kN) during the completion of bridge. In current traffic situation, the cable force variation rate caused by daily vehicle load is within 0% to 6% for these cables in this bridge, while that caused by temperature effect is less than 0.5%, which can be ignored. Therefore, we can use the average value to represent the measured cable force in normal operation situation.
Then the variation rate of the i-th cable from manual inspection in the same period and the completion of bridge is denoted as Di.
${D_i} = \left( {{C_i} - {C_{oi}}} \right)/{C_{oi}}$ (2)
where Ci is the manual measured cable force (kN) for the i-th cable and C0i is the measured cable force during the completion of bridge for the i-th cable (kN).
2) First-pass anomaly decision. Pressure sensors with a measuring accuracy of 1% are adopted in the cable force monitoring. Frequency method is used in the periodic inspection of cable force with a relatively large testing error, ranging from 2% to 4%. Therefore, it is feasible to use measured cable force variation rate as the threshold. The threshold △=|Di|. When |di| ≥ |Di|, the cable force is abnormal. Since only a part of cables are selected for the annual inspection, for those data without inspection, the threshold is defined as the maximum variation rate of the measured cable forces. Thus, all the cable force thresholds can be calculated as follows:
$\Delta =\left\{ \begin{align} & \begin{matrix} \left| {{D}_{i}} \right| & with inspected values \\\end{matrix} \\ & \begin{matrix} \max \left\{ \left| {{D}_{1}} \right|,\left| {{D}_{2}} \right|,\ldots ,\left| {{D}_{M}} \right| \right\} & otherwise \\\end{matrix} \\ \end{align} \right.$ (3)
where M refers to the number of manual inspections of cable forces.
3) Distribution test calculation. After the first-pass selection, the reliability of the remaining data is still uncertain. Although some average cable force values may not exceed the limitation, sharp fluctuations may appear. Therefore, the distribution test should be performed. In this study, by fitting the distribution of a large number of cable force data, the conclusion is drawn that the time-displacement data of cable force satisfy Type Ⅲ Extreme Value Distribution, with the cumulative distribution function:
$\eqalign{ & G\left( u \right) = \exp \left[ { - {{\left[ {1 + r\left( {\frac{{u - b}}{a}} \right)} \right]}^{ - 1/r}}} \right]I\left( u \right) \cr & \left( { - \infty < u < \infty , - \infty < b < \infty ,0 < a < \infty } \right) \cr} $ (4)
where r,b, and a represent the shape parameter, position parameter and scale parameter, respectively;I(u) is the indicator function:
$I\left( u \right)=\left\{ \begin{align} & \begin{matrix} 1 & \left[ 1+r\left( u-b \right)/a \right]>0 \\\end{matrix} \\ & \begin{matrix} 0 & otherwise \\\end{matrix} \\ \end{align} \right.$ (5)
By applying the Kolmogorov-Smirnov (K-S) test, the cumulative frequency distribution of the sample data is compared with the theoretical Type Ⅲ Extreme Value Distribution. If the difference between them is relatively small, it means that the samples pass the distribution test. The data failing to pass the test are stored in the anomaly data base and then sent back to the original data base to achieve the updating of data extraction.
The above steps are used for the anomaly detection of continuous data and the algorithm flowchart is shown in Fig. 2.
Figure 2
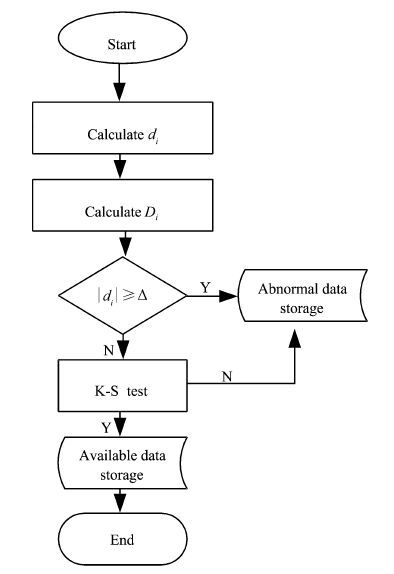 Figure 2 Flow chart of anomaly detection algorithm
 4 Project Example 4.1 Project Description The Nanjing No.3 Yangtze River Bridge is a five-span cable-stayed bridge with steel pylon and steel box girder. Its main span is 628 m. The SHM system of the bridge has been running since 2006. 8 × 21 pairs of stay cables are arranged symmetrically in east-west direction. The cables are high-strength parallel wires wrapped in high-density polyethylene. The stay cable sensors are placed in each cable. 24 hours ′ cable forces of the 42 upstream cables on both sides of the south pylon on March 8th,2013 are selected as the example. The cable sensors numbers are shown in Fig. 3.
Figure 3
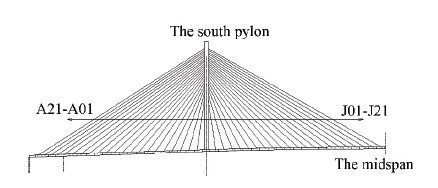 Figure 3 Diagram of the cable sensor numbers
 4.2 Data Processing Analysis According to the data processing workflow, the data are firstly normalized, cleaned and converted to generate 42 curves of cable forces, as shown in Fig. 4.
Figure 4
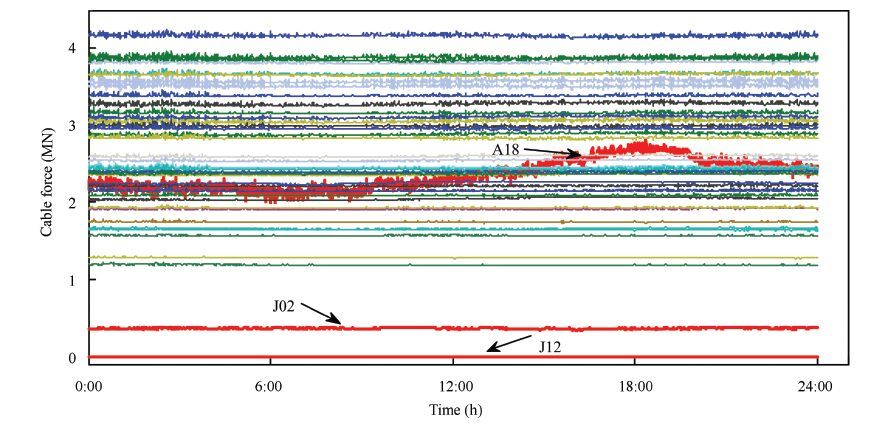 Figure 4 Curve of 42 cable forces
 It can be judged by visual inspection that there are 3 abnormal cables A18, J02, J12 in Fig. 4. The sensor of A18 cable is down, because the data is inconsistent with surrounding cable forces. The cable force of J02 cable is significantly less than 500 kN, which is far from real cable force, indicating that the sensor needs recalibration. The cable force of J12 cable is 0, indicating the sensor does not work.
The calculation is conducted according to the anomaly detection algorithm flowchart described in Section 2. Fig. 5 demonstrates the first-pass result of the variation rate, wherein the abnormal cables are circled. Among the 42 upstream cables, the inspection is only performed for A16-21 and J18-21 cables. Therefore, the thresholds of other cables are 8%. The first group of abnormal cables includes A03, J02 and J12.
Figure 5
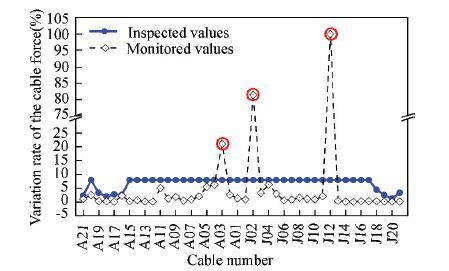 Figure 5 Anomaly detection result of the variation rate of the cable forces
 The K-S test is carried out in the second-pass test. According to the pre-calculation, the significance level is set as 0.01. Fig. 6 shows the result of anomaly detection. The abnormal cables include A18 and J02. Besides, A01 and J01 do not satisfy Type Ⅲ Extreme Value Distribution due to temperature effects.So they areexcluded from the second-pass test. The statistical results via the proposed anomaly detection method are shown in Table 1.
Figure 6
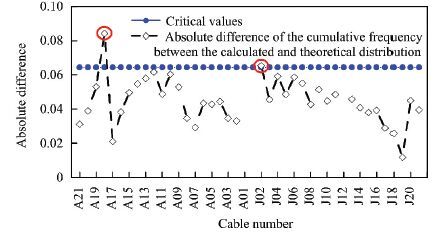 Figure 6 Result of K-S test
 表 1
42 upstream cables on both sides of south pylon-A18A18Malfunction detection95.2
A03-A03Recalibration
J02J02J02Recalibration
J12-J12Replace or abandon
Table 1 Statistical results of anomaly detection
As shown in Table 1, the A18 cable is detected in the second-pass test. The J02 cable is abnormal during the two pass tests. Compared with manual inspection, the proposed method can detect abnormal cables more effectively.
5 Conclusions By utilizing the cable monitoring data of Nanjing No.3 Yangtze River Bridge, this study draws the following conclusions:
1) An adaptive processing framework with feedback control is established, which includes four steps of data specification, data cleaning, data conversion and data fusion.
2) The proposed anomaly detection algorithm fuses the inspection data and the monitoring data. Two steps based on variation rate and distribution test method are applied. Experimental results for a set of cable force data achieve high detection accuracy.
3) Data processing information puts feedback and updates to the original data base, which further gives guidance for the sensor maintenance.
References
[1] Xu Y L, Zhang X H, Zhan S, et al. Testbed for structural health monitoring of long-span suspension bridges. Journal of Bridge Engineering, 2015, 17(6): 896-906. (
 0)
0)[2] Cao Y, Yim J, Zhao Y, et al. Temperature effects on cable stayed bridge using health monitoring system: a case study. Structural Health Monitoring, 2011, 10(5): 523-537. (
 0)
0)[3] Soman R N, Onoufrioua T, Kyriakidesb M A, et al. Multi-type, multi-sensor placement optimization for structural health monitoring of long span bridges. Smart Structures & Systems, 2014, 14(1): 55-70. (
 0)
0)[4] Wu H C, Xiang Y Q. Assessment the cable tension and the linetype state of cable-stayed bridge based on variable weight synthesis. China Railway Science, 2006, 27(6): 42-48. (
 0)
0)[5] Ko J M, Ni Y Q. Technology developments in structural health monitoring of large-scale bridges. Engineering Structures, 2005, 27(12): 1715-1725. (
 0)
0)[6] Dan D H, Zhao Y M, Yang T, et al. Health condition evaluation of cable-stayed bridge driven by dissimilarity measures of grouped cable forces. International Journal of Distributed Sensor Networks, 2013(1): 1212-1215. (
 0)
0)[7] Tan D M, Qu W L, Zhang J B, et al. Damage identification of cable of long span cable-stayed bridge. Journal of Wuhan University of Technology, 2012, 34(7): 107-110. (
 0)
0)[8] Ni Y Q, Ye X W, Ko J M. Monitoring-based fatigue reliability assessment of steel bridges: analytical model and application. Journal of Structural Engineering, 2010, 136(12): 1563-1573. (
 0)
0)[9] Khaleghi B, Khamis A, Karray F O, et al. Multisensor data fusion: a review of the state-of-the-art. Information Fusion, 2013, 14(1): 28-44. (
 0)
0)[10] Wu S X, Li Fang. Research on monitoring data processing method about long-span cable-stayed bridge SHM system. Construction Technology, 2009(2): 94-96. (
 0)
0)[11] Jiang S F, Fu C, Wu Z Q. Intelligent data-fusion model using correlation fractal dimension for structural damage identification. Smart Materials and Intelligent Systems, PTS 1 and 2, 2011, 143: 1300-1304. (
 0)
0)[12] Kumagai S, Doman K. Detection of inconsistency between subject and speaker based on the co-occurrence of lipmotion and voice towards speech scene extraction from news videos.IEEE International Symposium on Multi-media. California: IEEE, 2011, 311-318. (
 0)
0)[13] Wu E, Liu W, Chawla S. Spatio-temporal outlier detection in precipitation data. Knowledge Discovery from Sensor Data, 2010, 5840: 115-133. (
 0)
0)[14] Wi H J, Lee J H, Blumenstein M, et al. Development of methodology for enhancing visual bridge condition assessment using image processing techniques. Applied Mechanics & Materials, 2013, 256. (
 0)
0)[15] Lu Z, Rao W, Wu Y J, et al. A Kalman filter approach to dynamic OD flow estimation for urban road networks using multi-sensor data. Journal of Advanced Transportation, 2015, 49(2): 210-227. (
 0)
0)[16] Meng Q C, Qi X, Li Q. Research of optimal placement of sensors for health monitoring system of the 3rd nanjing changjiang river bridge. Bridge Construction, 2007(5): 111-119. (
 0)
0)