 ,1,2, Haiwan Wei1, Min Liu1,2, Ning Wang
 ,1,21Department of Physics,
 2
Received:2021-03-11Revised:2021-06-3Accepted:2021-06-8Online:2021-08-05

Abstract
Keywords:
PDF (1283KB)MetadataMetricsRelated articlesExportEndNote|Ris|BibtexFavorite
Cite this article
Tao Li, Haiwan Wei, Min Liu, Ning Wang. Ability of the radial basis function approach to extrapolate nuclear mass. Communications in Theoretical Physics, 2021, 73(9): 095301- doi:10.1088/1572-9494/ac08fa
1. Introduction
Mass is one of the most basic and important bulk properties of nuclei. Much related nuclear information can be derived from it, such as the shell effect [1–9], the deformation effect [10], the nucleon separation energy [11] and the alpha decay energy [12, 13] of nuclei, based on its accurate measurement and prediction. It is also crucial data used to measure the nuclear charge radius in laser spectroscopy experiments [14–18]. In addition, the nuclear mass is an important input to the simulation of the rapid neutron-capture process (r-process) in stellar nucleosynthesis [19–23].More than 100 years ago, stable nuclear masses in nature began to be measured, based on the development of mass spectrometry [24]. To date, more than 2500 nuclear ground-state masses have been measured, due to the development of radioactive ion-beam facilities [25, 26]. However, the large number of neutron-rich nuclear masses required for r-process simulation are rarely included in experimental measurements, and neither are the masses of superheavy nuclei, which have been of great concern. Therefore, a reliable theoretical model for predicting nuclear masses is extremely important. There are two types of mass model that can theoretically predict the masses of all nuclei. One is the macroscopic–microscopic mass model, which includes the finite-range droplet model (FRDM12) [27] and Weizsäcker-Skyrme (WS) [28–31] models. The other is the microscopic mass model, which includes the Duflo-Zuker (DZ) [32, 33] and Hartree–Fock-Bogoliubov (HFB) [34–36] models. In addition, there are several large-scale mass tables are calculated using microscopic theories, such as the density functional theories [37–39]. The root-mean-square (rms) deviation between the calculations of these mass models [27, 30, 31, 33, 35] and the experimentally measured 2408 nuclear masses are about 0.3–0.6 MeV [40]. However, A. Sobiczewski et al [41–43] found that the accuracy of the theoretical model in predicting masses of nuclei in an unknown region is independent of the accuracy with which the model describes the measured nuclear masses. In addition, the predictive accuracies of these mass models are still far from those required by the studies of exotic nuclear structures and r-process simulations. In order to further improve the accuracy of the results predicted by the nuclear mass models, some neural network approaches have been introduced. For example, the radial basis function (RBF) [44–49], the Bayesian neural network (BNN) [50, 51] and the kernel ridge regression (KRR) [52] approaches can successfully improve the accuracy of nuclear mass prediction. Using these neural network approaches, the rms deviation between the predictions of the theoretical models and the experimental measurements can be reduced to 0.2 MeV.
Although neural network approaches have been successful in predicting nuclear masses, all the successes have been based on interpolations or extrapolations that were close to the learning set. Therefore, when the extrapolation range is extended away from the learning set, it is worth confirming whether the neural network approach is still effective in improving the prediction abilities of the nuclear mass models. In this work, the ability of the RBF approach to extrapolate the nuclear mass at a distance from the learning set is systematically investigated; the extrapolation regions are mainly concentrated in neutron-rich and superheavy nuclei. The numerical details of the RBF approach will be presented in section
2. Numerical details
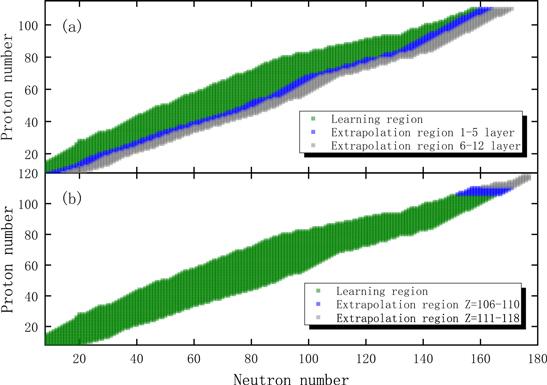
As in [44–48], the RBF approach has been widely applied in improving the mass predictions of nuclear models. The revised mass of a nucleus (Z, N) is given byThe prediction of an unknown nuclear mass can be regarded as the extrapolation or interpolation of the surface of the nuclear mass. In order to study the ability of the RBF approach to extrapolate the nuclear mass in the neutron-rich region, we select the evaluation masses of 3,281 nuclides (N ≥ 8, 8 ≤ Z ≤ 110) in AME2016 [25], as shown in figure 1(a). In figure 1(a), first, the green region is used as learning set 1 to extrapolate the nuclear masses of 12 layers (the blue and gray regions) in the neutron-rich region. In order to further study whether the expansion of the learning set will affect the extrapolation ability of the RBF approach, the green and blue regions are used as learning set 2 to extrapolate the nuclear masses of seven layers (the gray region) in the neutron-rich region. Similarly, in order to study the ability of the RBF approach to extrapolate the masses of nuclei in the superheavy region, we select the evaluation masses of 3336 nuclides (N≥8, Z≥8) in AME2016, as shown in figure 1(b). In figure 1(b), the green region is learning set 1′, used to extrapolate the masses of nuclei (Z ≥ 106) in the superheavy regions (blue and gray regions), and then the green and blue regions are used as learning set 2′ to extrapolate the the masses of nuclei (Z≥111) in the superheavy region (gray region). For the theoretical mass models, we take the two DZ31 [33] and HFB27 [35] microscopic mass models and the two FRDM12 [27] and WS4 [31] macroscopic–microscopic mass models as examples. For convenience, the nuclear mass model improved by the RBF approach is denoted by Model+RBF. To evaluate the predictive power of the nuclear mass models combined with the RBF approach, the rms deviation
Figure 1.
 New window|Download| PPT slide
Figure 1.(a) Nuclei in the learning set (green region) and two test sets (blue and gray regions) used to examine the extrapolation ability of the RBF approach in the neutron-rich region. (b) Nuclei in the learning set (green region) and two test sets (blue and gray regions) used to examine the extrapolation ability of the RBF approach for the superheavy nuclei.
3. Results and discussions
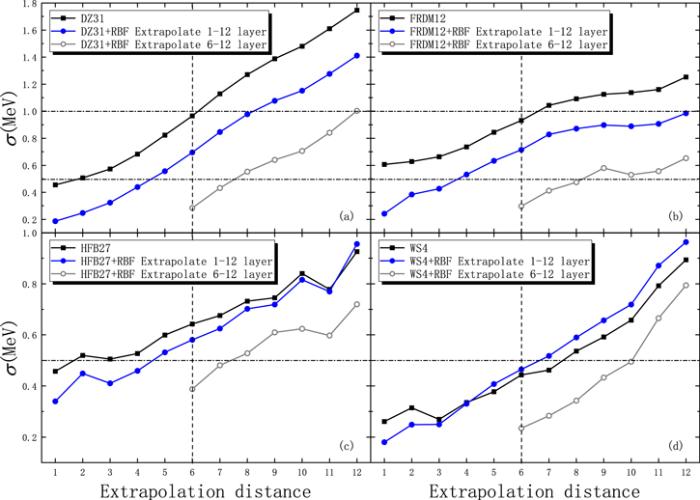
First, we studied the extrapolation ability of the RBF approach combined with the DZ31, HFB27, FRDM12, and WS4 models in the neutron-rich region. Figure 2 shows the variation trend of the rms deviation with respect to the evaluation masses from AME2016 and the extrapolation masses of each layer of nuclei in the neutron-rich region with extrapolation distance. Clearly, the rms deviations of the prediction results of the four mass models increase with the extrapolation distance, while the rms deviations of the prediction results of the HFB27 and WS4 models are less than 1 MeV. When the mass model is combined with the RBF approach to extrapolate the masses of 1-to-12-layer nuclei in the neutron-rich region, the improvement ability of the RBF approach depends on the theoretical model chosen. It can been seen from figures 2(a) and (b) that the RBF approach can always improve on the prediction results of the DZ31 and FRDM12 models. As shown in figure 2(c), the extrapolation ability of the RBF approach is effective within about ten steps for the HFB27 model. As shown in figure 2(d), for the WS4 model, the RBF approach may make the extrapolation result worse than the model itself, although the extrapolation result is effective within three steps. As can be seen from figure 2, in the neutron-rich region, the extrapolation results of the mass models combined with the RBF approach are significantly improved with the expansion of the learning set. Obviously, when the WS4 model is combined with the RBF approach to extrapolate the nuclei of the fifth layer, the rms deviation is still within 0.5 MeV. This may be attributed to the lower rms deviation between the predictions of the WS4 model and the existing experimental data.Figure 2.
 New window|Download| PPT slide
Figure 2.Root-mean-square (rms) deviations with respect to the evaluation masses from AME2016 and the extrapolation masses of each layer of nuclei in the neutron-rich region. The solid squares and circles represent the prediction results of the model and the Model+RBF for 1–12 extrapolated nuclear layers, respectively. The hollow circles represent the results of the Model+RBF for the extrapolation of 6–12 nuclear layers.
In order to investigate the reasons for the reversal of the extrapolation results of the Model+RBF in the neutron-rich region, the reconstruction function to reproduce the deviation between the evaluation masses from AME2016 and the results predicted by the mass models is analyzed. Figure 3 shows the reconstruction functions S1, S2 and the deviations between the evaluation masses from AME2016 and the prediction masses of the WS4 model. According to figure 3, it can be found that with an increase in the extrapolation distance, the deviations of the masses for nuclei in the superheavy region gradually increase from the fifth layer. So we guess that, in the neutron-rich region, the improved results of the WS4 model according to the reconstruction function S1 get worse because of the mutation in the superheavy region. The improved results of the WS4 model using the reconstruction function S2 get better because learning set 2 already contains a little information about the mutation in the superheavy region. In addition, it can be seen that with an increase in the extrapolation distance, the deviations of the nuclear masses in the region near the proton numbers 10≤Z≤40 gradually increase from the eighth layer. In the last two layers, the deviations in this region are even more than 2 MeV, which may be the reason why the trends of the rms deviations in figure 4(d) show inflection points in the tenth layer. In a similar way to the analysis of figure 3, we also analyzed the results of the DZ31, HFB27, and FRDM12 models. It was found that with an increased distance from the learning set, the deviations of the nuclides around the proton magic numbers Z=20 and 50 gradually increased for the HFB27 model. This may be the reason why the extrapolation results of the HFB27+RBF become worse in the last layer. For the DZ31 and FRDM12 models, the mutation of the deviation of the extrapolation result is small. Therefore, in the neutron-rich region, the RBF approach can always improve the extrapolation results of the DZ31 and FRDM12 models. This analysis shows that in the neutron-rich region, the extrapolation results of the models will be improved by the RBF approach within at least three steps. If the deviations of the extrapolation region are less abrupt than those of the learning set, this improvement will persist over longer extrapolation distances.
Figure 3.
 New window|Download| PPT slide
Figure 3.Deviations between the evaluation masses from AME2016 and the masses predicted by the WS4 model in the extrapolation neutron-rich region. The reconstruction functions S1 and S2 are obtained from learning set 1 and learning set 2, respectively. Figures
Figure 4.
 New window|Download| PPT slide
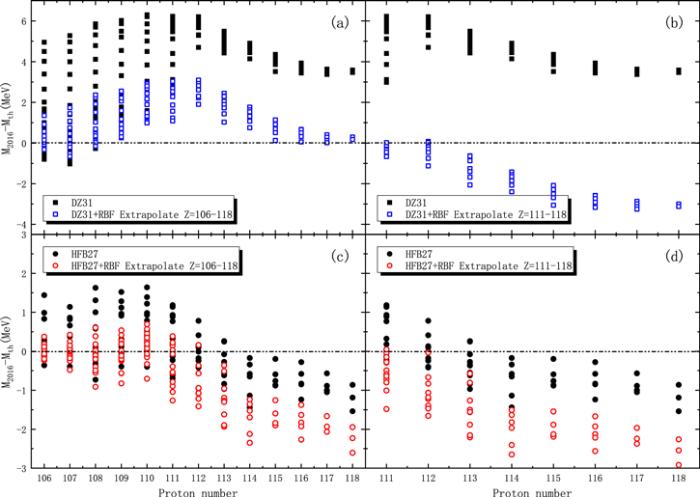
Figure 4.Deviations between the evaluation masses from AME2016 and the masses extrapolated by the DZ31 and HFB27 models and the corresponding improved masses extrapolated by the RBF approach in the superheavy region. The solid and hollow blocks represent the results of the DZ31 model and the DZ31+RBF, respectively. The solid and hollow circles represent the results of the HFB27 model and the HFB27+RBF, respectively.
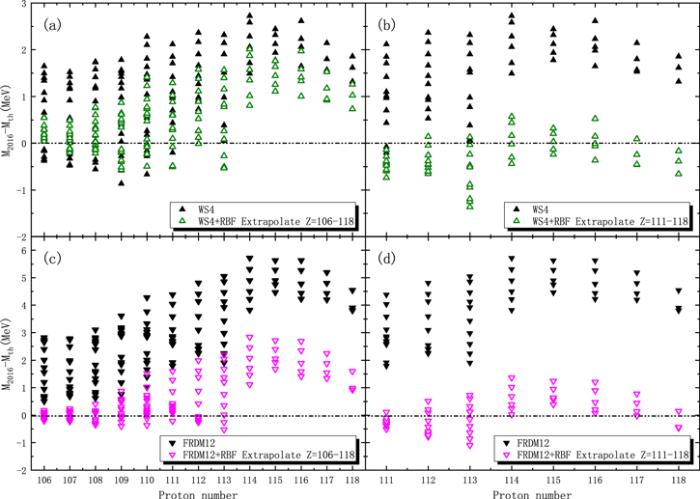
Similarly, the extrapolation ability of the RBF approach in the superheavy region is investigated. Figure 4 shows the deviations between the evaluated masses from AME2016 and masses extrapolated by the DZ31 and HFB27 models and their corresponding improved masses extrapolated by the RBF approach. Figure 4(a) shows the results of the DZ31 model and the DZ31+RBF for nuclei with proton numbers Z=106–118. It can be seen that the deviations between the predicted results of the DZ31 model and the evaluation masses from AME2016 are more than 6 MeV, but the results of the DZ31+RBF model are reduced to 3 MeV. Figure 4(b) shows the results of the DZ31 and DZ31+RBF models for nuclei with proton numbers Z=111–118. It is found that the results after 3 steps of extrapolation are worse than the results in figure 4(a), even though the learning set is expanded. Figure 4(c) shows the results of the HFB27 and HFB27+RBF models for nuclei with proton numbers Z=106–118. Although the extrapolation results of the HFB27 model combined with the RBF approach achieve good results within five steps, the extrapolation results beyond five steps are worse than those of the HFB27 model alone. As can be seen from figure 4(d), although the learning set is expanded, the extrapolated results of the HFB27+RBF model are worse than those of figure 4(c). It can be seen that, based on the information obtained from figure 4, the RBF approach should be carefully combined with the DZ31 and HFB27 models when extrapolating nuclear masses in the superheavy region. Figure 5 shows the deviations between the evaluation masses from AME2016 and the masses extrapolated using the WS4 and FRDM12 models and their corresponding improved masses extrapolated by the RBF approach. Figure 5(a) shows the results of the WS4 and WS4+RBF models for nuclei with proton numbers Z=106–118. It is found that the extrapolation results of the WS4 model are significantly improved by the RBF approach. It is worth mentioning that in figure 5(b), the extrapolation results of the WS4 model will be further improved by the RBF approach due to the expansion of the learning set. The deviations between the evaluation masses from AME2016 and the masses extrapolated by the WS4 model combined with the RBF approach are within 1 MeV for nuclei with proton numbers Z=111–118. Figures 5(c) and (d) show the results of the FRDM12 and FRDM12+RBF models. The trends of their results are similar to those of the WS4 model. It is found that, by studying the distribution of the deviation between the evaluation masses from AME2016 and prediction results of the models, the deviations of the nuclides near Z=114, compared to those of the nuclides near Z=110, showed a larger mutation for the DZ31 and HFB27 models. This may be the reason for the reversal of the prediction results of the DZ31 and HFB27 models combined with the RBF approach in the superheavy region.
Figure 5.
 New window|Download| PPT slide
Figure 5.Similar to figure 4, but for the WS4 and FRDM12 models.
4. Conclusions
In summary, the ability of the RBF approach to extrapolate the masses of nuclei in the neutron-rich and superheavy regions was investigated in combination with the DZ31, HFB27, FRDM12 and WS4 mass models. The prediction abilities of the mass models are improved when they are combined with the RBF approach in the neutron-rich region, and the improvement becomes better with an enlargement of the learning set. However, the prediction results of the WS4 model in the neutron-rich region may become worse when combined with the modification of the RBF approach. In the superheavy region, the RBF approach shows different performances in improving the predictions of the mass models. Although the learning set is expanded, the extrapolation results of the DZ31 and HFB27 models combined with the RBF approach may become worse in the superheavy region. It is gratifying that the RBF approach shows good performance in improving the prediction of nuclear masses in the superheavy region when used with the WS4 and FRDM12 models.This analysis shows that when the RBF approach is applied with a simple linear basis function, different mass models have different performances when used to extrapolate nuclear masses in a same region, and a single mass model may have different performances when used to extrapolate nuclear masses in different regions. The quality of these performances mainly depends on whether the deviation of the extrapolation region shows a larger mutation compared to the learning set. The WS4 and FRDM12 models, combined with the RBF approach, obtain better prediction results when extrapolating nuclear masses in the neutron-rich and superheavy regions.
Acknowledgments
This work was supported by the National Natural Science Foundation of China (Grant No. U1867212, 12047567), the Natural Science Foundation of Guangxi (Grant NO. 2017GXNSFGA198001) and the Middle-aged and Young Teachers’ Basic Ability Promotion Project of Guangxi (CN) (Grant No. 2019KY0061).Reference By original order
By published year
By cited within times
By Impact factor
DOI:10.1088/1572-9494/ab6906 [Cited within: 1]
DOI:10.1103/PhysRevC.90.024320
DOI:10.1088/1674-1137/39/10/104001
DOI:10.1103/PhysRevLett.114.202501
DOI:10.1103/PhysRevC.98.024310
DOI:10.1103/PhysRevLett.120.062503
DOI:10.1103/PhysRevLett.121.022506
DOI:10.1103/PhysRevLett.120.232501
DOI:10.1103/PhysRevLett.124.092502 [Cited within: 1]
DOI:10.1103/PhysRevC.96.014310 [Cited within: 1]
DOI:10.1016/j.adt.2017.09.001 [Cited within: 1]
DOI:10.1088/1674-1137/40/5/054102 [Cited within: 1]
[Cited within: 1]
DOI:10.1140/epja/i2015-15023-2 [Cited within: 1]
DOI:10.1016/j.physletb.2019.134805
DOI:10.1103/PhysRevLett.122.192502
DOI:10.1038/s41567-020-0868-y
DOI:10.1038/s41567-020-01136-5 [Cited within: 1]
DOI:10.7498/aps.61.072601 [Cited within: 1]
DOI:10.1016/j.physletb.2013.04.048
DOI:10.1103/PhysRevC.100.024330
DOI:10.1007/s11433-018-9355-y
DOI:10.1016/j.adt.2018.03.003 [Cited within: 1]
DOI:10.1360/SSPMA-2019-0308 [Cited within: 1]
DOI:10.1088/1674-1137/41/3/030003 [Cited within: 2]
DOI:10.1103/PhysRevLett.121.022506 [Cited within: 1]
[Cited within: 3]
DOI:10.1103/PhysRevC.81.044322 [Cited within: 1]
DOI:10.1103/PhysRevC.82.044304
DOI:10.1103/PhysRevC.84.014333 [Cited within: 1]
DOI:10.1016/j.physletb.2014.05.049 [Cited within: 3]
DOI:10.1103/PhysRevC.52.R23 [Cited within: 1]
[Cited within: 3]
DOI:10.1103/PhysRevC.88.024308 [Cited within: 1]
DOI:10.1103/PhysRevC.88.024308 [Cited within: 2]
DOI:10.1103/PhysRevC.93.034337 [Cited within: 1]
DOI:10.1143/PTP.113.785 [Cited within: 1]
DOI:10.1016/j.adt.2017.09.001
DOI:10.1038/nature11188 [Cited within: 1]
DOI:10.7498/aps.70.20201734 [Cited within: 1]
DOI:10.1103/PhysRevC.89.024311 [Cited within: 1]
DOI:10.1103/PhysRevC.90.017302
DOI:10.1016/j.adt.2017.05.001 [Cited within: 1]
DOI:10.1103/PhysRevC.84.051303 [Cited within: 2]
DOI:10.1103/PhysRevC.88.024325
DOI:10.1103/PhysRevC.90.014303
DOI:10.1103/PhysRevC.94.054315
DOI:10.1016/j.scib.2018.05.009 [Cited within: 1]
DOI:10.1088/1674-1137/43/7/074104 [Cited within: 1]
DOI:10.1016/j.physletb.2018.01.002 [Cited within: 1]
DOI:10.1103/PhysRevC.100.054311 [Cited within: 1]
DOI:10.1103/PhysRevC.101.051301 [Cited within: 1]
