 ,Department of Optoelectronics,
 Received:2020-06-10Revised:2020-09-19Accepted:2020-10-20Online:2020-12-18

Abstract
KeywordsЃК
PDF (929KB)MetadataMetricsRelated articlesExportEndNote|Ris|BibtexFavorite
Cite this article
Vimal Raj, M S Swapna, S Sankararaman. Hidden periodicity in Stripe 82 with Saraswati supercluster—a fractal analysis. Communications in Theoretical Physics, 2021, 73(1): 015402- doi:10.1088/1572-9494/abc3ab
1. Introduction
The galactic distribution in the Universe is hierarchical, ranging from two galaxy system called binaries to systems with thousands of galaxies called superclusters. Superclusters are groups of clusters of galaxies which are one of the largest known structures in the Universe. The galaxy agglomerations on superclusters extend more than 100 Megaparsecs (Mpc) across and mass more than 1016 solar masses. Most of the superclusters at high redshifts are not virialized [1]. Superclusters are subjected to a wide range of studies [2–6]. The origin and formation of matter in the Universe, distribution of galaxies, and presence of dark energy and dark matter can be studied by analyzing the structure, density, luminosity and time evolution of the superclusters [1, 5, 7–11]. Voids are other large-scale structures found in the Universe where the luminous density is almost zero. Most of the superclusters are surrounded by voids [1, 7]. The supercluster—void network in the Universe is commonly termed as the cosmic web.The invention of sophisticated imaging and spectroscopic techniques lead to various surveys about the redshift, luminosity, position, and velocity flow of the galaxies, stars and matter in the Universe. In galaxy redshift surveys, the redshift values of galaxies are recorded, and the information like angular position, velocity and others about the galaxies are estimated from the redshift values. Among the various redshift surveys, the Sloan Digital Sky Survey (SDSS) is the one which has a broad area coverage and a large number of redshift counts. SDSS uses a Sloan 2.5 m telescope to image the galaxies and multi-fibre spectrograph to record the redshifts of galaxies. SDSS covers the northern and southern galactic caps [12]. Stripe 82 is a region in the southern galactic gap which has high sampling density. In the equatorial coordinate system, the Stripe 82 is between the right ascension 310° and 59° and declination between −1.25° and 1.25°. The comoving radial extend of the Stripe 82 region is up to 1559 Mpc. A large number of study has been conducted in Stripe 82 region to know about the galaxy distribution and matter formation.
Saraswati is the recently reported supercluster by Bagchi et al which is at a distance of about 1000 Mpc away from earth and extends about 200 Mpc across in comoving coordinates [1]. It is a massive supercluster with a calculated mass of about 2×10¹⁶ solar mass and its mean position is at a redshift z=0.28. There are about 43 massive galaxy clusters or groups in the Supercluster region with most of them populated at the centre. Bagchi et al used the data from the Sloan Digital Sky Survey (SDSS-III D12) [12] to discover the Saraswati supercluster. The redshift data from the SDSS is converted into comoving coordinates and analyzed using Friends of Friends algorithm with a linking length of 19 Mpc. Of several techniques for the analysis of superclusters, fractal analysis is one among them.
Fractal analysis is a powerful tool to study the distribution of galaxies in the Universe quantitatively. Fractals are self-affine or self-similar objects, which are irregular and have a scale-invariance. The galactic distribution in the Universe can be studied by considering it as a fractal pattern [6, 13–17]. The complexity of the distribution can be quantified by using the fractal dimension, which measures the deviation of a pattern from the regularity or Euclidean dimension. The fractal dimension is a non-integer value, which must be greater than the topological dimension and lesser than the Euclidean dimension [18, 19]. The morphology of superclusters and voids, the distribution of luminous matter in the Universe, self-similar and self-affine structures in the Universe can be studied by using fractal analysis.
In the present work, fractal analysis is done on the whole Stripe 82, the central part of the Stripe 82 and also on the Saraswati supercluster region. Fractal dimension and relevant information about the fractals can be estimated by using numerous techniques. Power spectrum method is a powerful tool for analyzing two-dimensional projections. The advantage of the power spectrum is that the complexity along a line can be quantified by using this method. The multifractal analysis is another method to characterize large scale structures. From the multifractal analysis, various fractal dimensions like the box-counting dimension, information dimension and correlation dimension can be estimated. The variation of dimensionality with length scales can be studied by using this method. The fractal dimension alone cannot provide all the information about the pattern or image, so we use a measure called lacunarity. Lacunarity quantifies the gappiness and rotational invariance or symmetry of the pattern or image. This measure can provide information about the voids in the Universe.
2. Data
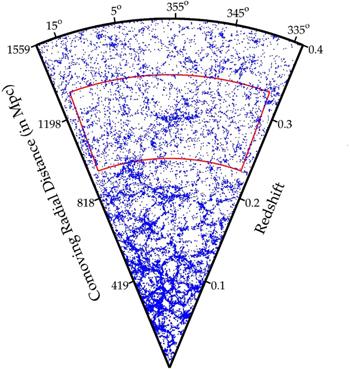
In the present work, the Stripe 82 region and the recently reported Saraswati supercluster in the Stripe 82 are studied by using various fractal analyzing methods. The Stripe 82 region is sampled by different programs of the Sloan Digital Sky Survey (SDSS-III DR12) [20, 21]. The photometric and spectroscopic data from different programs like ‘LEGACY’, ‘BOSS’ and ‘SOUTHERN’ are combined to form a uniform dataset of Stripe 82 region which comprise the Saraswati supercluster. Only the galaxies which shows clear photometry and which has redshift errors less than 1% is selected to the dataset. The discrepancies on the luminosity magnitude arising due to the motion of galaxies are K-corrected using the software called K-CORRECT version 4.3 to convert the data into comoving coordinates [22]. A volume-limited dataset is made by limiting the absolute magnitude of cModel r-band Mr≤−21.53 and the redshift value z≤0.4 [23]. The central part of the Stripe 82 which contains the Saraswati supercluster is also used for the analysis. The right ascension values of the central part lie between 337° and 15°, and redshift ranging from 0.23 to 0.33. The Stripe 82 region contains a total of 20 583 galaxies in which 3016 galaxies are in the central part. The Saraswati supercluster contains 100 galaxies which are the largest supercluster in the central part as reported by Bagchi et al. In the central part, the Saraswati supercluster is at right ascension values from 350° to 10° and at a mean redshift of 0.28. The Stripe 82 region shown in figure 1 is the one reported by Bagchi et al [1].Figure 1.
 New window|Download| PPT slide
Figure 1.Stripe 82 region with central part marked as red and right ascension values at the top [1].
The cosmological parameters for the analysis of the astronomical data are obtained from the five years Wilkinson microwave anisotropy probe results [24]. The parameters such as the radiation density parameter ΩR=8.493*10−15, matter density parameter ΩM=0.279 dark energy density parameter ΩΛ=0.721, Hubble constant H0=70.1 km s−1 Mpc−1, and the state of the dark energy ω0=−1 are used in the present study [1, 6].
3. Fractal analysis
Self-similarity is the underlying principle behind the fractal analysis. There are several methods—box counting, power spectrum, multifractal, lacunarity, correlation and information dimension—for the determination of fractal dimension and image analysis. In the present study, the image processing software—ImageJ with Frac-Lac has been used.3.1. Power spectrum method
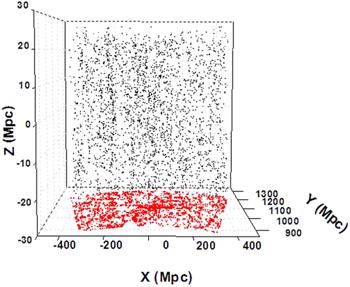
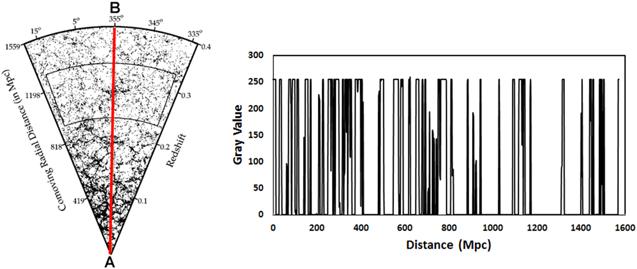
Power spectrum method is a valuable tool for finding the fractal dimension of two-dimensional images. The complexity of the images along a particular direction can be estimated by using this method. In this method, the three-dimensional (3D) distribution of galactic points is projected on to a two-dimensional plane, as shown in figure 2. The galaxy distribution of the projection along a particular direction is evaluated by using an image processing software (ImageJ). The methodology adopted for computing the fractal dimension involves (i) the conversion of the image into grayscale, (ii) analysis of grayscale intensity distribution along different directions between the right ascension values 335° and 17°, (iii) computation of the fast Fourier transform (FFT) of the directional grayscale intensity data, and (iv) the study of power distribution for different frequencies. For this, the grayscale intensity distribution in the image along a line is computed using ImageJ, as shown in figure 3.Figure 2.
 New window|Download| PPT slide
Figure 2.XY projection of the central part of the Stripe 82.
Figure 3.
 New window|Download| PPT slide
Figure 3.The grayscale intensity variation along the line AB passing through the right ascension 355° in the Stripe 82 image.
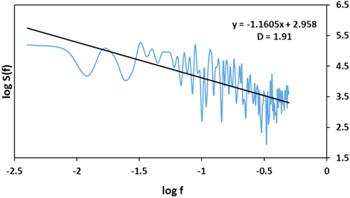
Then the FFT of the intensity distribution corresponding to the galaxy is calculated using the software Origin. The Power ‘S(f)’, which is the square of the magnitude of the FFT signal for different frequency ‘f’, where f is in Mpc−1, obeys the fractal power law with an exponent $\beta ,$ as given in equation (
Then a scatter diagram is plotted with log S (f) along the y-axis and log f along the x-axis. Equation (
3.2. Lacunarity
The texture of a fractal can be described by using lacunarity, which is a measure of gappiness of a pattern. It also provides information regarding the degree of homogeneity and symmetry. A low lacunarity value suggests a higher degree of homogeneity and symmetry. For a highly homogenous symmetric sample, the lacunarity value is close to zero, and for a disordered sample, the value is higher than one [14, 27, 28]. In the present study, the box-counting lacunarity is determined using the plugin Fraclac in ImageJ. For finding the lacunarity, the pattern under study is filled with boxes of size ‘l’. The box-counting lacunarity is estimated by varying the box size ‘l’ and inspecting the elements within as in standard box-counting technique. From the number of pixels in each box, the mean pixel value (μ) of the pattern is estimated, and the standard deviation (σ) of pixel distribution is calculated. The lacunarity (L) of the pattern at a specific box size is the ratio of the variance (σ2) to the square of the mean value (μ) as given in equation (3.3. Multifractal analysis
Multifractals are fractals which can be fully characterized with multiple scaling rules or dimensions. One of the tools in the multifractal analysis is the generalized dimension D(Q). The generalized dimension gives the variation of the probability distribution of a pattern when an amount Q distorts it. The multifractal analysis is usually done by using the box-counting method. For this, the pattern understudy is filled with boxes with size ‘ϵ’. Then, the distribution of pixels over these boxes are found. The probability distribution of pixels in each box is calculated using equation (Then, the generalized dimension D(Q) is given by equation (
The generalized dimension D(Q=0) gives the box-counting dimension DB, D(Q=1) gives the information dimension DI and D(Q=2) gives the correlation dimension Dc [15, 29]. Equations (
4. Results and discussion
4.1. Power spectrum method
The data set under study is a 3D catalogue, but it can be approximated as a laminar structure because of its small depth in the declination direction (about 2.5°). So the analysis is done on the projection of 3D catalogue whose small depth in the declination direction is suppressed. Also, according to the general theorem of fractal projections [14]. If a pattern in a 3D space is projected orthogonally on to a two-dimensional surface and the fractal dimension of the projection Dpr is less than two, then the fractal dimension of the pattern in 3D space D=Dpr. This theorem implies that as long as the fractal dimension of the 2D projection is less than two, then that fractal dimension quantifies the complexity of the 3D data.The 3D galactic points, forming the central part of Stripe 82, projected on to a two-dimensional plane is shown in figure 2. The entire projection giving the Stripe 82 is shown in figure 1. The fractal analysis of the central part of the Stripe 82 regions is done by using the power spectrum method. The region between right ascension values 337°–15° is divided into sectors of 1°, and by the power spectrum method, the complexity along the radial direction is estimated. The analysis is done for the redshift 0.23≤z≤0.33 with the comoving radial distance 938–1305 Mpc. The slope of log s(f) versus log f plot gives the fractal dimension as discussed in section
Figure 4.
 New window|Download| PPT slide
Figure 4.log s(f) versus log f graph for the right ascension angle 355°.
Figure 5.
 New window|Download| PPT slide
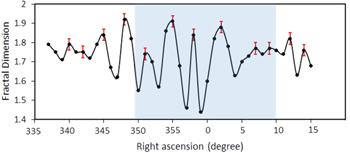
Figure 5.Variation of fractal dimension with right ascension values in the central part of the Stripe 82 region (0.23≤z≤0.33) with Saraswati supercluster region shaded with error bar at the peak position.
Figure 5 shows that the value of fractal dimension swings between 1.44 and 1.92, which indicates the difference in complexity in the central part of the Stripe 82 region. The right ascension values corresponding to the peak positions, the angular separation between two adjacent peaks and the fractal dimension with standard error are tabulated in table 1. The average standard error in the slope of the log s(f) versus log f curve plot of the power spectrum and hence the error in the fractal dimension is found to be ±0.03. From figure 5, a periodic variation in fractal density can be seen across the central part of the Stripe 82 region. Table 1 shows a periodicity of 3.09° or 71 Mpc in the distribution of galaxies, which throws light into the hidden nature of periodicity in the distribution of galaxies in space.
Table 1.
Table 1.Right ascension values of peak positions for the central part of Stripe 82 with corresponding fractal dimension.
| Peak positions (degree) | Fractal dimension (±0.03) | Difference between the peak position (degree) |
|---|---|---|
| 340 | 1.79 | |
| 342 | 1.75 | 2 |
| 345 | 1.84 | 3 |
| 348 | 1.92 | 3 |
| 351 | 1.74 | 3 |
| 355 | 1.91 | 4 |
| 358 | 1.84 | 3 |
| 2 | 1.88 | 4 |
| 7 | 1.77 | 5 |
| 9 | 1.77 | 2 |
| 12 | 1.82 | 3 |
| 14 | 1.76 | 2 |
New window|CSV
For confirming the presence of periodicity in the distribution of galaxies, fractal dimension estimation using the power spectrum method is applied on the entire Stripe 82 region. The region between right ascension values 335°–17°, redshift between 0 and 0.4 and the comoving radial distance 0–1559 Mpc in the Stripe 82 region is used for the analysis (log s(f) versus log f plot of the right ascension 337°–17° of the entire Stripe 82 is given in the supplementary file S1). The variation of the fractal dimension with a standard error along the Stripe 82 region is shown in figure 6.
Figure 6.
 New window|Download| PPT slide
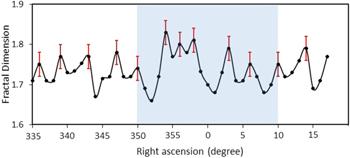
Figure 6.Variation of fractal dimension with right ascension values in the Stripe 82 region (0≤z≤0.4) with Saraswati supercluster region shaded with error bar at the peak position.
The fractal dimension in the Stripe 82 regions varies between a maximum of 1.83 and a minimum of 1.66. Periodicity in the galaxy distribution similar to that of the central part is observed in the entire Stripe 82. This similarity shows that the periodicity in the galaxy distribution is not a localized phenomenon. Table 2 shows the right ascension values corresponding to the peak positions, the fractal dimension with standard error and the separation between two adjacent peaks. From table 2 it can be seen that the fractal dimension shows an average angular periodicity of 3.45°, which corresponds to a spatial periodicity of 94 Mpc across the Stripe 82 region and is in good agreement with the 120 Mpc in the Abell galaxy clusters as reported by Einasto et al [10].
Table 2.
Table 2.Right ascension values of peak positions for Stripe 82 region and corresponding fractal dimension.
| Peak positions (degree) | Fractal dimension (±0.03) | Difference between the peak position (degree) |
|---|---|---|
| 336 | 1.75 | |
| 339 | 1.77 | 3 |
| 343 | 1.77 | 4 |
| 347 | 1.78 | 4 |
| 350 | 1.74 | 3 |
| 354 | 1.83 | 4 |
| 356 | 1.8 | 2 |
| 358 | 1.81 | 2 |
| 3 | 1.79 | 5 |
| 6 | 1.75 | 3 |
| 10 | 1.75 | 4 |
| 14 | 1.79 | 4 |
New window|CSV
4.2. Lacunarity analysis
To study the texture of the two-dimensional projection of Saraswati supercluster, lacunarity analysis is carried out by varying the box-size and grid orientation in ImageJ software. The lacunarity analysis helps to quantify the presence of voids and the invariance of the texture under rotational and translational transformations. The lacunarity analysis of the Saraswati region gives the lacunarity value as 0.4644±0.02. The detailed lacunarity analysis of the three regions are also given in the supplementary file S1. This value indicates the existence of some kind of symmetry (rotational or translational) in the Saraswati supercluster. The deviation from perfect rotational or translational symmetry or homogeneity may be due to the randomly distributed voids. The lacunarity analysis of the central portion of Stripe 82 is found to be 0.358±0.002, whereas the entire Stripe 82 is 0.4622±0.01. These values indicate nearly the same texture throughout Stripe 82.4.3. Multifractal analysis
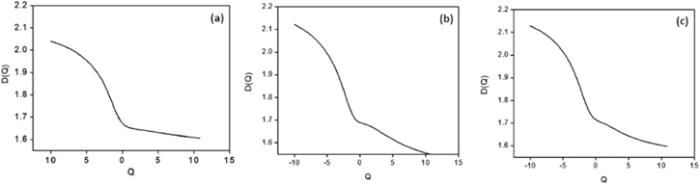
The multifractal analysis is carried out in the (a) Saraswati region, (b) central part of Stripe 82 and (c) Stripe 82 regions that help to identify the different dimensions in the pattern. The shape of the variation of generalized dimension D(Q) with the amount of distortion (Q) gives information about the homogeneity of the galaxy distribution. A linear variation of D(Q) versus Q at the value closer to the Euclidean dimension (2—for laminar projections) suggests a transition of the galaxy distribution to homogeneity at all scales. In contrast, a sigmoidal variation points to the multifractal galactic distribution. All the three regions—(a) Saraswati region, (b) central part of Stripe 82 and (c) Stripe 82—exhibit a sigmoidal variation of the generalized dimension D(Q) with Q, as shown in figure 7, which indicates the multifractal nature of the galactic distribution [30]. From the data of the generalized dimension of the Saraswati region, it is evident that the box-counting dimension D(Q=0) is 1.67, the information dimension D(Q=1) is 1.65, and the correlation dimension D(Q=2) is 1.64. The box-counting dimension of 1.67 indicates a sheet-like morphology with the presence of giant voids [9]. When the analysis is carried out at the central part of Stripe 82 the fractal dimensions obtained are D(Q=0)=1.689, D(Q=1)=1.680, D(Q=2)=1.66 and for the entire Stripe 82 region the values obtained for fractal dimensions are D(Q=0)=1.71, D(Q=1)=1.70, D(Q=2)=1.68. The values of the fractal dimensions D(Q=0, 1, and 2) are less than the Euclidean dimension (2), which indicates a heterogeneous distribution of galaxies in all the three regions. The higher value of correlation and information dimension in the entire Stripe 82 region indicates a relatively high probability of finding another galaxy in the neighbourhood of a galaxy in the entire Stripe 82 than in the central part and the Saraswati supercluster region [30].Figure 7.
 New window|Download| PPT slide
Figure 7.Generalized dimension D(Q) versus Q plot for (a) Saraswati region (b) central part of Stripe 82 and (c) Stripe 82.
5. Conclusion
The studies on the structure of galaxies and the distribution of galactic points are of great importance in cosmology. The present work attempts to explore the hidden features of superclusters taking the recently reported Saraswati supercluster and the Stripe 82 region containing it as an example. The Saraswati supercluster, the central part of Stripe 82 and Stripe 82 as a whole are subjected to fractal and lacunarity analysis. When the lacunarity values give information about the texture and symmetry of the distribution of galactic points, the fractal dimensions give the complexity of distribution. The lacunarity values obtained for the regions under study are low, indicating a near symmetric distribution. The plot of fractal dimension calculated by the power spectrum method shows a kind of periodic distribution across Stripe 82 region. The central part of the Stripe 82 and the Stripe 82 region as a whole is found to exhibit a periodicity of about 71–94 Mpc, which is in agreement with the 120 Mpc in the Abell galaxy clusters as reported by Einasto et al [10]. Other fractal dimensions like the box-counting dimension, information dimension and correlation dimension are also found through multifractal analysis.Acknowledgments
Vimal Raj is grateful to the Council of Scientific and Industrial Research (India) for research fellowship. The authors are also thankful to SDSS III DR 12 database. Funding for SDSS-III has been provided by the Alfred P Sloan Foundation, the Participating Institutions, the National Science Foundation, and the US Department of Energy Office of Science. The SDSS-III web site isReference By original order
By published year
By cited within times
By Impact factor
DOI:10.3847/1538-4357/aa7949 [Cited within: 7]
DOI:10.1093/mnras/269.2.301 [Cited within: 1]
DOI:10.1051/0004-6361:20065296
DOI:10.1088/2041-8205/759/1/L7
DOI:10.1146/annurev.aa.21.090183.002105 [Cited within: 1]
DOI:10.1007/s12648-019-01400-2 [Cited within: 3]
DOI:10.1038/300407a0 [Cited within: 2]
DOI:10.1146/annurev.aa.26.090188.003215
DOI:10.1093/mnras/237.4.929 [Cited within: 1]
DOI:10.1038/385139a0 [Cited within: 2]
DOI:10.1038/343726a0 [Cited within: 1]
DOI:10.1088/0067-0049/219/1/12 [Cited within: 2]
DOI:10.1016/S0370-1573(97)00044-6 [Cited within: 1]
[Cited within: 2]
DOI:10.1086/185254 [Cited within: 2]
DOI:10.1007/978-94-009-0965-6_14
DOI:10.1016/j.physa.2014.09.044 [Cited within: 1]
DOI:10.1140/epjp/i2018-11918-y [Cited within: 1]
DOI:10.1140/epjp/i2017-11826-8 [Cited within: 1]
DOI:10.1086/374238 [Cited within: 1]
DOI:10.1209/0295-5075/88/59001 [Cited within: 1]
DOI:10.1086/510127 [Cited within: 1]
DOI:10.1086/323717 [Cited within: 1]
DOI:10.1088/0067-0049/180/2/330 [Cited within: 1]
DOI:10.1029/GL016i007p00673 [Cited within: 1]
DOI:10.1109/51.139038 [Cited within: 1]
DOI:10.1103/PhysRevE.53.5461 [Cited within: 1]
DOI:10.1016/S0165-0270(96)00080-5 [Cited within: 1]
DOI:10.1103/PhysRevLett.62.1327 [Cited within: 1]
[Cited within: 2]
