 ,1,?, Tao Sun,2,?, Dan-Ni Cao,3,§, Lin Zhang,4,?
Corresponding authors: ? E-mail:li_shu_bin@163.com? E-mail:315722588@qq.com§ E-mail:17114256@bjtu.edu.cn? E-mail:zhang_lins@hotmail.com
Received:2018-07-22Online:2019-04-1
| Fund supported: |

Abstract
Keywords:
PDF (1986KB)MetadataMetricsRelated articlesExportEndNote|Ris|BibtexFavorite
Cite this article
Shu-Bin Li, Tao Sun, Dan-Ni Cao, Lin Zhang. Incident Detection Method of Expressway Based on Traffic Flow Simulation Model *. [J], 2019, 71(4): 468-474 doi:10.1088/0253-6102/71/4/468
1 Introduction
With the arrival of big data era, the Internet of things has a rapid development. It will lead to a qualitative leap of information technology again. The expressway promotion of information technology using big data is the key to establish the comprehensive traffic information management platform. Traffic incident is the most striking entry in expressway database. It can trigger a series of chain reaction, such as traffic congestion, environmental pollution, resource consumption, and can easily lead to secondary accidents. Therefore, monitoring the incident quickly, efficiently and timely is an important way to reduce the accident hazards. Researches on the traffic incident have been carried out more than 40 years over the world, but there has never been given a complete definition. Usually, the so-called traffic accidents are defined as the known and unknown events, which impact the road traffic flow operation.[1] Such as traffic accidents occurred on the expressway or urban road, the vehicle broke down and the goods scattered are all called the traffic events.[2] The cause of traffic accidents includes many aspects such as the road planning and design is not so reasonable or it may be caused by other uncertain occurrence.[3-5] As everyone knows, the traffic incident is unpredictable and non-experimental. It is difficult to capture its potential regularity in the actual transportation system. Even more difficult is the lack of real historical data.[6] Therefore, the expressway incident detection has always been the difficult and critical point in expressway management. Fortunately, the intelligent transportation and modern communication technologies have made a great development and make it possible to detect the expressway incident. It is possible to search the time and position of the traffic incident by comparing the differences between the normal and congested state of traffic system operation. There are a lot of outstanding work[7-9] and many predictive models and methods.[10-11]In China, all the expressways are charged, so the most comprehensive data are the toll data at the entrances and exits on expressways. Although it is possible to obtain some monitoring data of road sections and some traffic incident data through the mobile phone positioning technology, but the data are not enough to cover the entire road network. Therefore, the proposed method of incident detection in this paper is only based on toll data. In order to find the location and occurring time of the incident, the mesoscopic traffic simulator of the expressway is built to estimate the normal state of the expressway system. It can be used to compare the abnormal fluctuations by judging the occurrence of incidents.
2 Technology Principles
2.1 The Network State Estimation
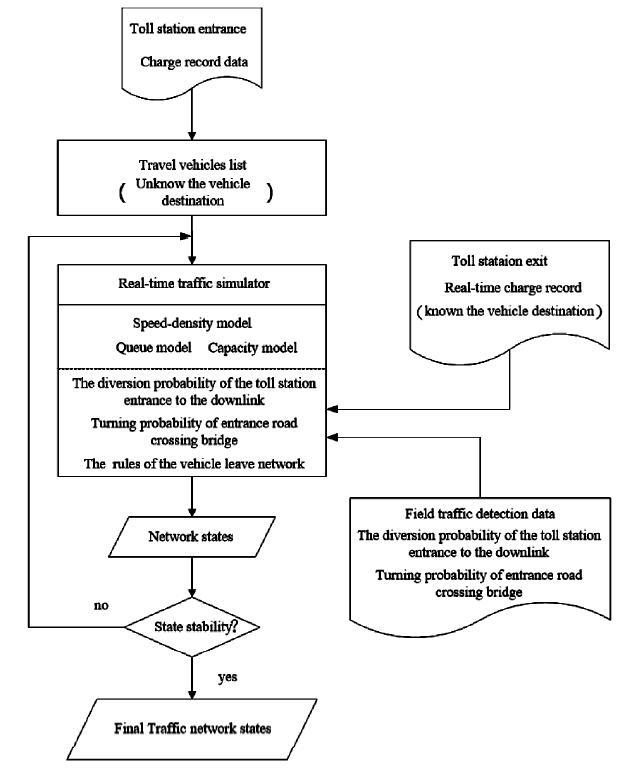
The specific programs to detect traffic incident is proposed in this section. The main idea is to establish a real-time online traffic states estimation platform that can obtain the normal state of traffic network. It can be used as a benchmark. By incidents scanning algorithm, we can determine whether there is an abnormal state on the road. Moreover, the incident position and time can be given by the secondary scanning algorithm.Figure 1 illustrates how the traffic simulation model estimates the traffic network states. There are several simulation-based dynamic network loading model and speed-density model used to move vehicles through the network. Generally, the historical toll data record vehicle OD information accurately, which are taken as input data of the simulation. But the vehicle toll data on the network only have the time of entering the expressway. Therefore, the vehicles' destinations are unknown immediately. This is a difficult point for mesoscopic simulator. Obviously, this method needs to detect road section flow of each entrance ramp so as to get the ratio of the vehicles turning to two different directions after entering the toll station. The same way is used on the downstream of the overpass on expressway.
Fig. 1
 New window|Download| PPT slide
Fig. 1Network states estimation method.
The real-time traffic simulator extracts the information of the vehicles entering the network in the current time from the toll data. The information includes the station name, the time and the vehicle type etc. When one toll record is inputted in the real-time traffic simulator, the corresponding vehicle is loaded onto the right location on the network according to its travel time. The simulator generates the movement immediately on the traffic network. Because the destinations of the simulated vehicles are unknown, their turning probabilities on the entrance ramp and entrance lane of overpass are estimated based on the real-time sensor data located on the road or the historical data.
At the same time, the real-time traffic simulator extracts the information of the vehicles leaving the network in current time from the toll system. The information includes the name of the toll station, the type of vehicle, the time of entering the expressway, etc. When the record of one exiting vehicle is inputted in the real-time traffic simulator, the system is looking for a simulated vehicle on the upstream mainline at the simulated toll exit station. When the type of vehicle is consistent with the toll record and the estimated arrival time at exit is close to the time of leaving road network in the toll records (for example, less than 5 minutes), the vehicle is considered to reach the destination. Then, the vehicle is removed from the simulator and stored into the list of the toll station.
2.2 Incident Detection Technology
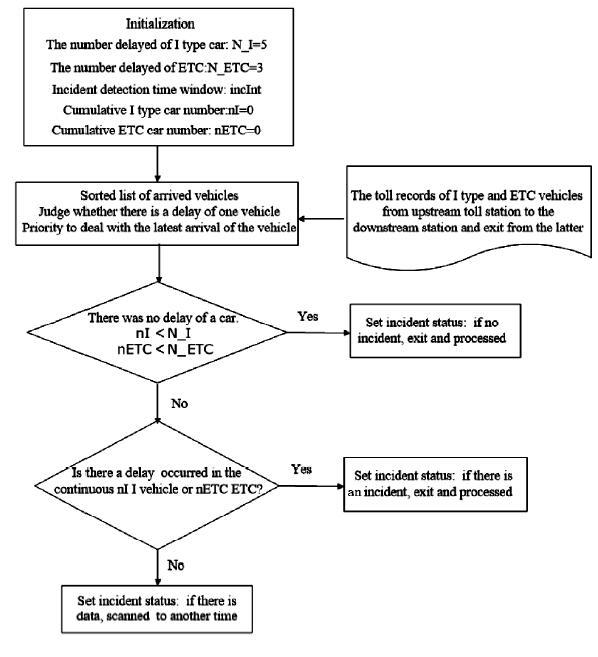
If the traffic network has no incident, the relevant historical toll data and the real-time detection data are inputted into the simulator we can obtain the current estimated traffic states. The latter can be used as a benchmark state of road network under normal traffic conditions. If there are more vehicle travel time records deviate from the outputted ones of real-time traffic simulation system, the traffic incident may be occurred in the road network. It is the main idea of the incident detection algorithm in this paper. Figure 2 illustrates the technological process.Fig. 2
 New window|Download| PPT slide
Fig. 2Incidents scanning algorithm.
In this paper, the vehicles were divided into two types, i.e. the standard car type I and ETC vehicle. The travel times of these two types of vehicles were used to detect if there is an incident occurred. The incident status of toll station shows whether there are traffic incidents affecting the operation of mainline traffic flow. The status include incident occurred, no incident, incident occurred on the upstream of mainline and no data. The "incident occurred on the upstream of mainline" means the incident occurred on the direct upstream mainline or within a certain range (for example, within 30 kilometers). "No data" indicates that there is not enough toll record data to judge the incident status of toll station. In order to determine whether the vehicles have travel delays, the travel time data contained in vehicle toll records and generated by real-time traffic simulation system will be compared. If there is a great difference, there is a delay.
3 The Mesoscopic Traffic Simulation Model
In this paper, the improved mesoscopic traffic simulation model in Ref. [12] is used to simulate the moving behaviors of the vehicles, including the queuing model, speed-density relationship model, etc.Firstly, the speed-density relationship model is described in detail. In the mesoscopic traffic simulation model, the link is divided into segments with the same physical properties. The vehicles' speed on the segments is decided by the density. The density is computed by the distance ahead of the vehicle according to the anisotropic mesoscopic simulation (AMS) model, which means that at any time, a vehicle's prevailing speed is influenced only by the vehicles in front of it. The speed and density model can be formulated as follows:
Here, $v^{t}_{i}$ is the speed of vehicle $i$ at time $t$; $v^{i}_{f}$ is the free flow speed on this road; $v_{\rm min}$ is the speed limit of remaining free stream running; $\rho$ is the density; $v_{\rm max}$ is the maximum design speed of the road; $\rho_{\rm max}$ is the maximum density; $\alpha, \beta$ are the model parameters.
The density of specific area ahead of one vehicle can be formulated as follows:
where $N^{t-1}_{i}$ is the number of vehicles within length $l$ ahead of $i$ at time $t-1$; $n$ is the number of lanes; $l$ is the length of the specific area.
It is worth explaining that the length of a particular area can be changed with the variety of the traffic environment. For example, some road section is flat in front of the vehicle at a simulation time, the length $l$ can be defined slightly longer; Otherwise, it can be defined shorter. In one word, the length can be dynamically changed according to the physical properties.
The deterministic queuing model describes the queuing behaviors of the vehicles at the intersection, including the vehicles entering the queuing, moving in the queue and leaving the queue. The queuing delay of the $i$-th vehicle in the queue is:
where $c$ is the output capacity of the lane group. Till time $t$, there are $ct$ vehicles leaving the queue. If a moving vehicle reaches the end of the queue at time $t$, its position (and, therefore, the position of the end of the queue) will be
where $q(0)$ is the end position of the queue at time $t=0$; $l_{\rm car}=1/\rho_{\rm jam}$ is the average length of vehicles including headways; Normally, the truck and bus can be converted to the standard car; $\rho_{\rm jam}$ is jam density; $m$ is the number of moving vehicles between the considered vehicle and the queue at time $t=0$.
Note that there are three cases: when $0<q(t)<L$, the model is relevant;
The case $q(t)<0$ will never occur.
The case $q(t)>L$ means that the queue is already dissipated when the vehicles reached the end of the segment.
4 The Ratio Estimation of Traffic Flow
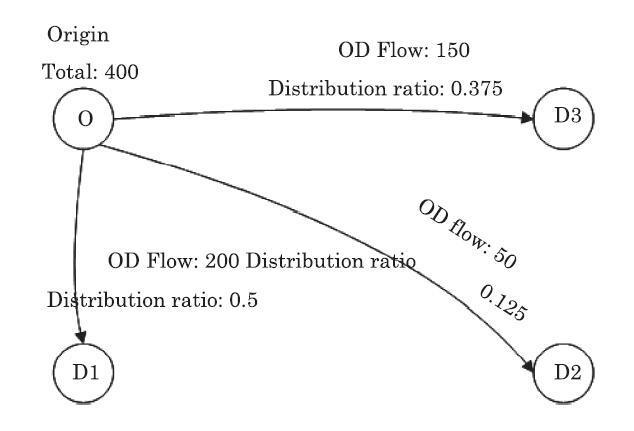
In this paper, it is difficult to find the information of turning vehicle at the crossway of expressway. The system can track the vehicles leaving the expressway by the toll data. Unfortunately, there are many vehicle entered the expressway, but there is no exit the road. Its travel direction can not be got. Therefore, it is necessary to assign a path to the vehicles at the crossway. The proposed method exploits the historical turning ratios of vehicles to all directions. The vehicles select their travel paths according to the turning probabilities of traffic flow, as shown in Fig. 3.Fig. 3
 New window|Download| PPT slide
Fig. 3Dynamic OD flow ratio.
The ratios are estimated using the least squares method and calculated according to the average values within a week or a month, and updated over time.[13]
5 The Mesoscopic Traffic Simulation
The simulation describes the vehicles' movement in the network, not only the occurrence and elimination of incidents. Firstly, the entire simulation time period $T$ is divided into several updated time periods. In this period, the parameters of the system model are updated such as parameter $\alpha$ and $\beta$. Moreover, each updated time period is divided into several advanced time periods $\Delta t_{\rm advance}$. In this period, the vehicles location are advanced on the network. Mathematical expressions are as follows:where $k_U$ and $k_v$ are positive integer. The specific algorithm process is as follows:
(i) Initialization
A large amount of input data are required including the topological structures of network, the geometrical characteristics of the road, the simulation time range, and the detailed descriptions of vehicles required to loaded (the current locations, travel destinations, travel paths, etc.). Network loaded is divided into two situations: single-point district and multi-point district. The former can load the vehicles to the first road section of their destination paths; and the latter randomly assigns the vehicles to a certain node, then loads in accordance with the first method. At $t=0$, all the vehicles are loaded to the initial positions on the network, and update counter $j=0$.
(ii) Update cycle
(a) Initialization again, set $i=0$. Update the segment properties according to the traffic incidents and construction area. Update the output capacity, the density and speed of the segment. Update the accept capacity of downstream segment.
(b) At this period, the vehicle advanced algorithm is executed. The speed-density relationship model is used to calculate the vehicle speed, and then calculate the new position of the vehicle. The vehicles will be loaded to the current locations, and advanced counter is updated to $i=i+1$.
(c) All advanced periods have been processed, and the algorithm is over.
(iii) Termination criterion
Termination criterion has the same processing mode with the advanced period; when $j=k_U$, the algorithm is over.
(iv) Output
The average speed, density and traffic flow of segment are the main indicators of the evaluation on the transport network, which are the outputs of the simulation. In addition, the queue length, travel OD information and travel time impedance of vehicle, etc. can also be outputted.
The aforementioned algorithm is the mesoscopic traffic simulation process. If there is an incident, the system needs to input such properties as duration, damage and so on. In addition, if one segment blocked suddenly, some vehicles on road may get the information and select other paths. It needs to use the path search algorithm of large-scale network.[14]
6 Case Study
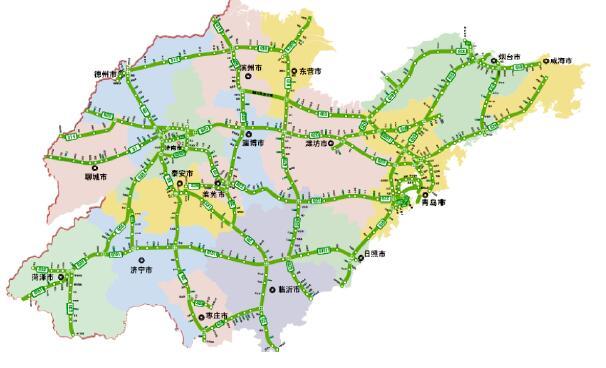
In this paper, the expressway network of Shandong province is taken as an example. The network has roads of 5200 kilometers length, 58 crossways, and 350 toll stations. In current days, there are about one million cars traveling on the network every day. The road network is shown in Fig. 4. Although there are monitored data on some segments, but it is not in the scope of the study. Therefore, the main input data are the toll data in this paper.Fig. 4
 New window|Download| PPT slide
Fig. 4The expressway network of Shandong.
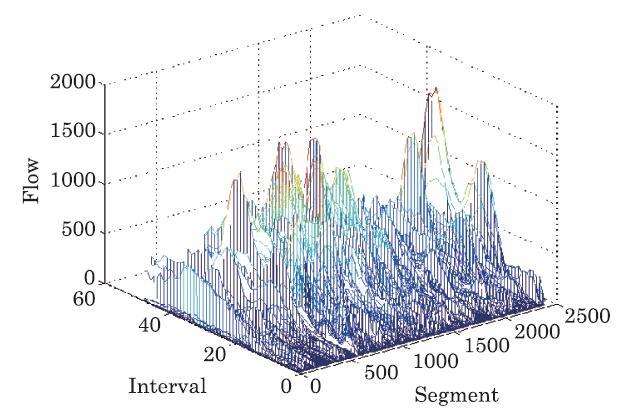
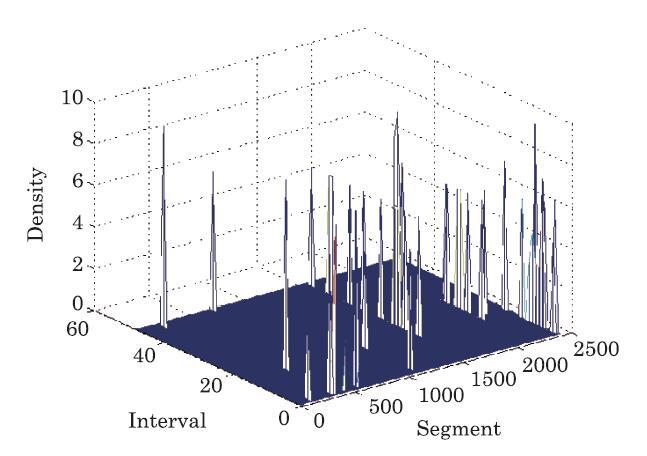
$v_{\rm free}$=120 km/h, $\rho_{\rm jam}$=0.1150, $\alpha$ is 1.9420, $\beta$ is 0.5040, AMS length is 150 m. The total simulation period is 15 hours and is divided into 60 time periods with 15 minutes each. If there is not any incident on the network, the simulation can output the average density, average flow, and average speed on every segment, as shown in Fig. 5 and Fig. 6.
Fig. 5
 New window|Download| PPT slide
Fig. 5The flow on segment per interval.
Fig. 6
 New window|Download| PPT slide
Fig. 6The density on segment per interval.
The selected data are one-day data in 2011. Firstly, the invalid data are eliminated. There are many other types of vehicles such as bus, truck and etc., but they are all converted into standard car. The model parameters are defined as the following.
There have been five traffic accidents that day according to the real records, as listed in Table 1. In the simulation, the exit toll records within recent 40 minutes are analyzed in every 10 minutes, so that the traffic incidents that affect the mainline traffic flow can be found. If a vehicle has a delay, its travel delay must be greater than 5 minutes and meet one of the following conditions: (a) for the vehicles with travel time more than 10 minutes, their travel delay is more than 20% of free travel time; (b) for the vehicles with the travel time less than 10 minutes, their delay is more than 40% of free travel time. According to these conditions, the system can determine the occurring time and place of the incident.
Table 1
Table 1Incidents in one day in 2011 of Shandong expressway road network.
 |
New window|CSV
Table 2 listed the detected incidents by proposed algorithm including the incident time and location. The continuous detection number is the number of times that the incident is detected within a continuous time interval (usually 10 minutes). If the incident is not detected within 30 minutes, the number can be cleared. The results show that the proposed incident detected algorithm is much effective and accurate. It is worth noting that the input data are only toll data, although there are some monitored data can be utilized. If that is done, incident detection will be more accurate.
Table 2
Table 2The closest detected incidents by proposed algorithm.
 |
New window|CSV
However, the proposed incident detection algorithm can not provide the detailed information of the incident and its property. Therefore, it is suggested that the video detection equipment should be installed in most segments. The real-time monitored data can also be set in the proposed system. The detection results will be more satisfactory.
7 Conclusions and Remarks
The expressway incident detection has always been a hot spot of traffic science and traffic engineering. In this paper, an expressway incident detection algorithm was proposed based on the improved mesoscopic traffic flow simulation model. The proposed algorithm only exploited the toll station data, its advantage is much more accurate and comprehensive. The disadvantage is that there are too much data and it is difficult to deal with. There are many crossways in the studied traffic network that have no related monitoring data. Herein, it is difficult to know the driving direction of the vehicles. Therefore, the historical data were used to determine the turning ratios of vehicles. This is similar to the intersection of urban road network. The movement of vehicles can be simulated on the network once the turning ratio is obtained. If there is some monitoring data, the problem can be solved more easily. The expressway network of Shandong province is exploited to an example. The results show that the proposed model and algorithm are effective and feasible.For the expressway management department, the road network is huge and more and more data are cumulative, so some supercomputing technology must be developed. A kind of new real-time management mode of expressway is such a closed-loop management mode of "the current traffic management strategies $\to$ online assessment strategies based on dynamic traffic analysis system $\to$ using optimization algorithms to improve management strategies $\to$ updating the previous management strategy $\to$ implementing the optimal management strategy obtained by several iterations". This is also our main work in the future.
Reference By original order
By published year
By cited within times
By Impact factor
[Cited within: 1]
[Cited within: 1]
[Cited within: 1]
[Cited within: 1]
[Cited within: 1]
[Cited within: 1]
[Cited within: 1]
[Cited within: 1]
[Cited within: 1]
[Cited within: 1]
[Cited within: 1]
[Cited within: 1]
