HTML
--> --> --> Figure1. Topography and spatial distribution of weather stations around the 100 km Ultramarathon race site. Shading indicates the altitude of the terrain. Dark circles represent weather stations. The radius of 27.6 km centered at the CP2–CP3 segment is marked as a red dash line. The red triangle is the forecast grid in the ECMWF and GRAPES models. The red and blue lines represent the route of the marathon and the Yellow River, respectively.
| Name | Elevation (m) | Temperature | Wind | Dew Temperature | Precipitation |
| Jingtai | 1630.9 | X | X | X | X |
| Zhongquan | 1358.0 | X | ? | ? | X |
| Wufo | 1314.0 | X | ? | ? | X |
| Xiquanzhen | 1650.0 | X | ? | ? | X |
| Luyang | 1575.0 | X | X | ? | X |
| Jinpingcun | 1284.8 | ? | ? | ? | X |
| Taihecun | 1321.0 | ? | ? | ? | X |
| Dapingcun | 1309.5 | ? | ? | ? | X |
| Dashui | 1880.0 | ? | ? | ? | X |
| Datangfengdianchang | 1740.0 | X | X | ? | X |
| Tiaonongshiyanzhan | 1640.0 | X | X | ? | X |
| Shuanglongxiang | 1850.0 | X | X | ? | X |
| Shimen | 1716.0 | X | ? | ? | X |
Table1. The name, elevation, and available variables of Jingtai national operational meteorological station and 12 AWS sites. “X” represents the stations have the observation.
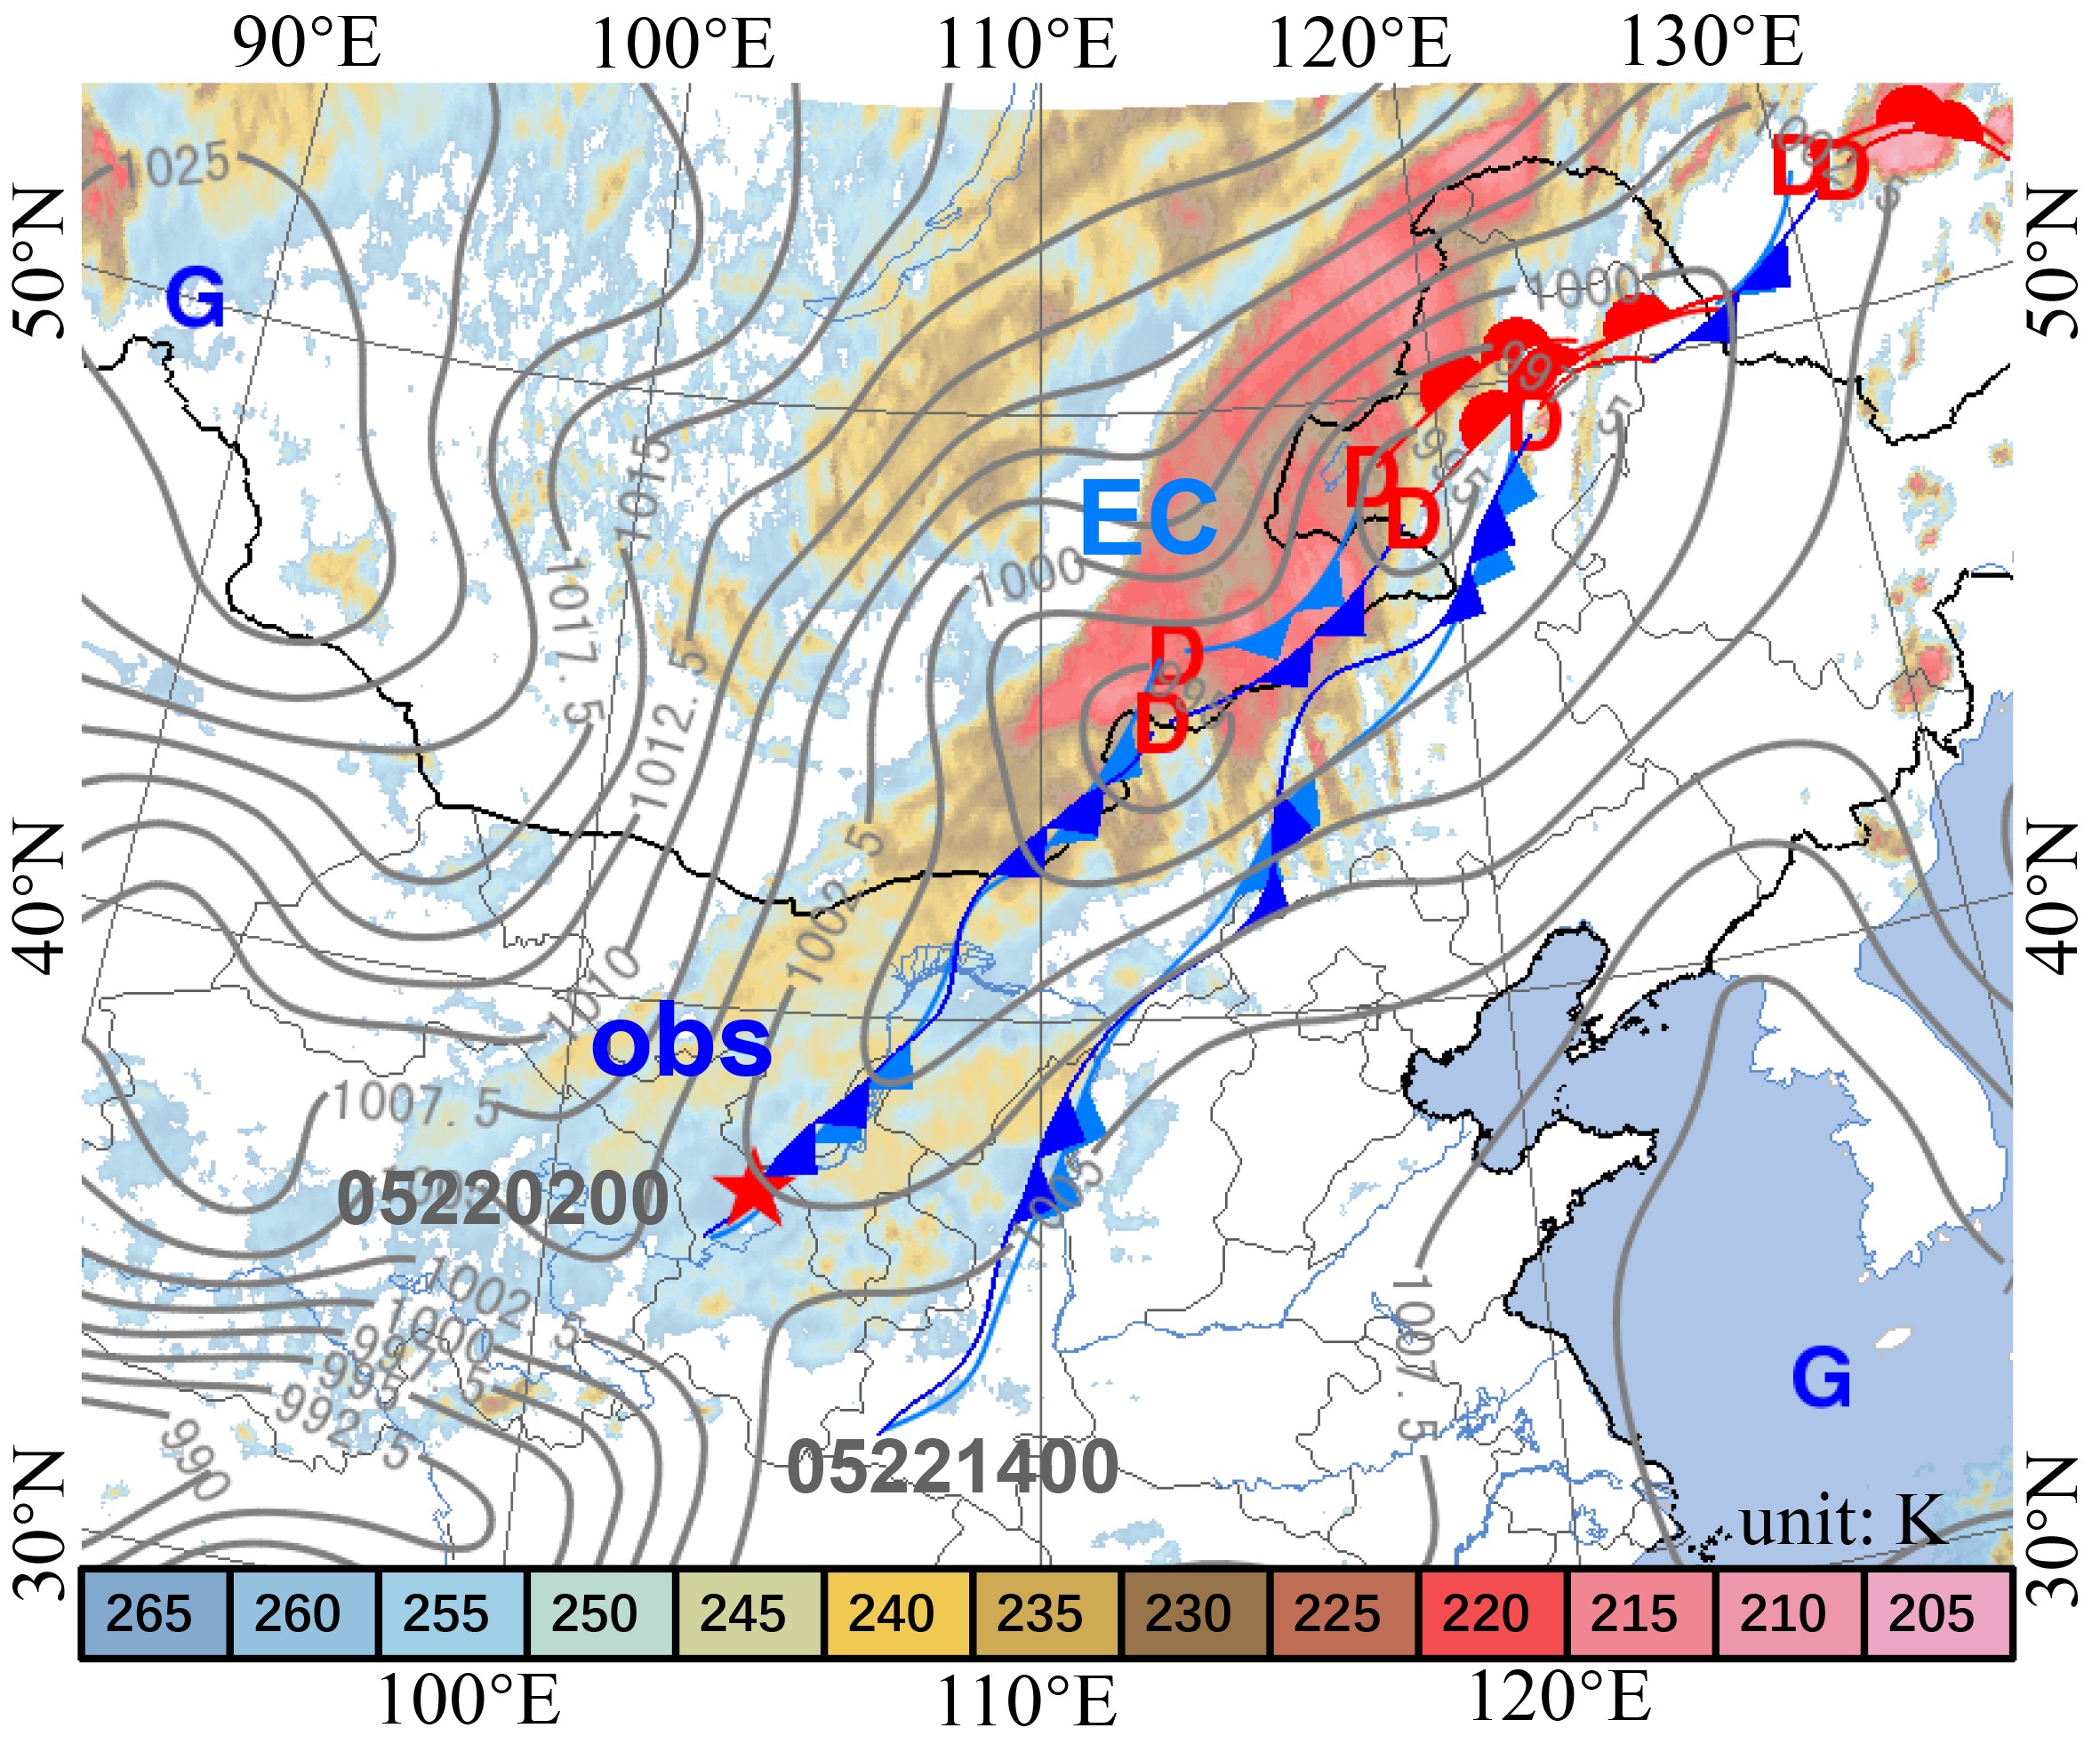 Figure2. Sea level pressure (solid dark lines) at 0200 LST 22 May 2021 from MICAPS. The cold fronts, marked by light blue lines, were forecasted by the ECMWF model at 0200 LST 22 May and 1400 LST 22 May, initialized at 2000 LST (1200 UTC) 20 May 2021. The dark blue lines are the surface cold front observed by surface meteorological stations. Shading represents the 10.8 μm infrared brightness temperature at 1400 LST from FY-4A. The red star indicates the Jingtai Station. D and G represent the low-pressure and high-pressure centers, respectively.
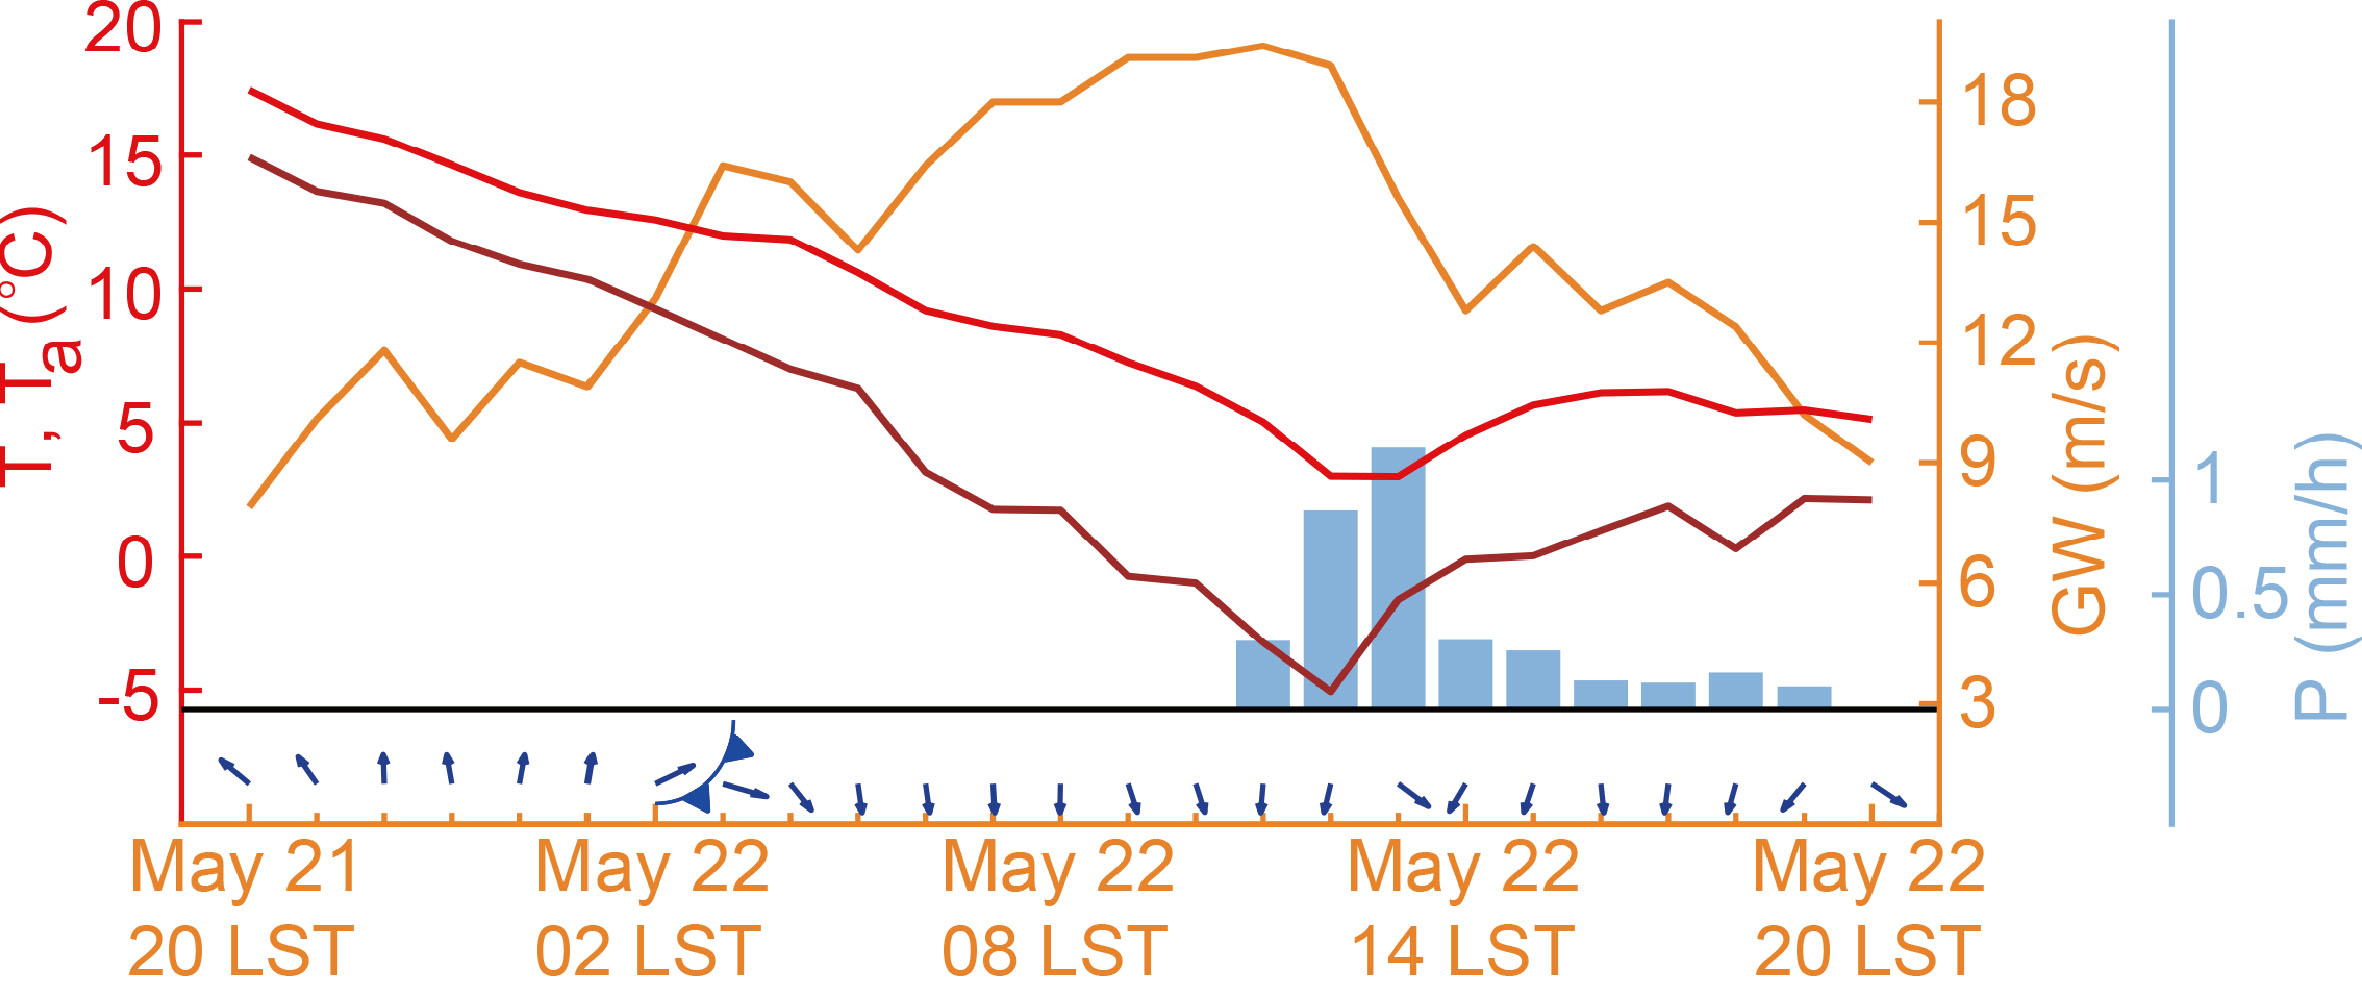 Figure3. Time series of the analyzed hourly temperature (red solid line), apparent temperature (dark red solid line), gust wind speed (yellow solid line), wind direction (blue arrows), and precipitation (light blue bars) at CP3 from 2000 LST 21 May to 2000 LST 22 May 2021. The cold front arrived at 0200–0300 LST 22 May 2021 and is marked in the figure.
There were 4464 records for each variable in the month of May from 2016 to 2021. If we define an extreme event by variable when the variable’s values are within the top or bottom 1% of the entire record for May, there was only an extreme low apparent temperature event during the Tragedy Hours (Fig. 4d). However, if top or bottom 5% were used to define an extreme event, the event was also extreme with respect to temperature (bottom 4.5% at 1200 LST) and gust wind speed (top 1.7% at 1100 LST) (Figs. 4a and 4c). The shaded area in Fig. 4e represents the distance of daily minimum to maximum surface temperature. Normally, the maximum daily temperature occurs at 1200–1400 LST due to solar radiation, while the minimum daily surface temperature occurs in the early morning before sunrise. However, cold air behind the front dominated CP3 during the Tragedy Hours, and solar radiation had a reduced effect on local temperature. Therefore, the temperature reached a minimum of about 3.0°C at 1200 LST and rose to 4.5°C at 1400 LST (Fig. 3). After the cold air center moved out of the CP2–CP3 region, the temperature continued to rise after the Tragedy Hours. When checking the minimum daily temperatures during each May of the past six years, we found that the Tragedy Day was not the only day with the low temperature (lower than 3.0°C) occurring around noon. Other cases were 3 May 2017 and 21 May 2018.
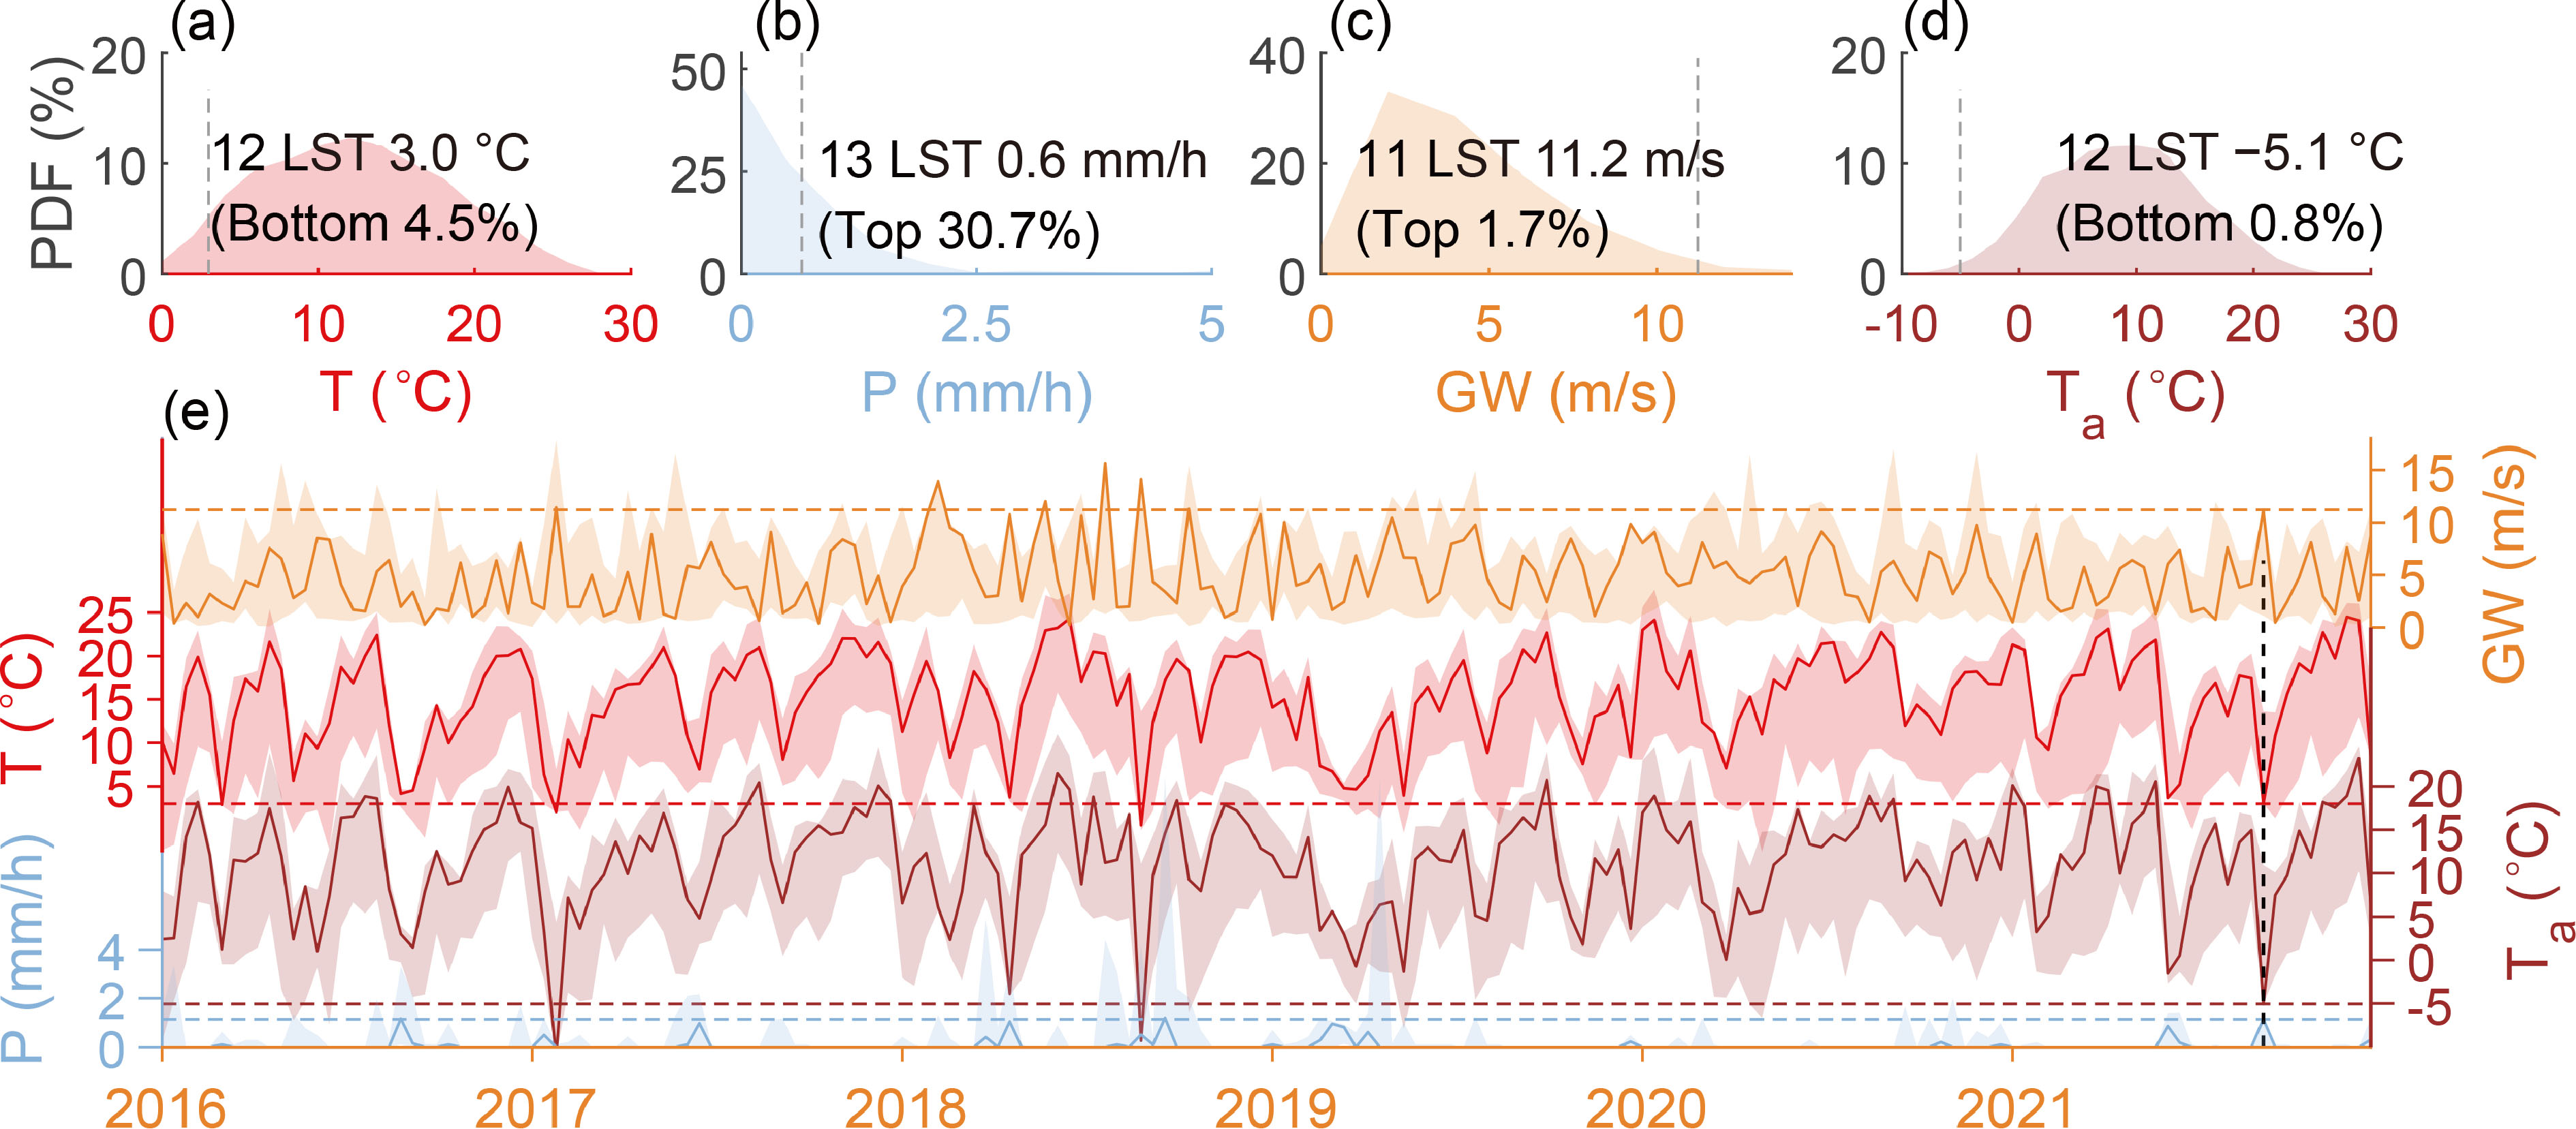 Figure4. Probability density function of analyzed hourly surface temperature (a), precipitation (b), gust wind speed (c), and apparent temperature (d) at CP3 using data in the month of May from 2016 to 2021, and analyzed hourly precipitation (light blue), temperature (red), apparent temperature (dark red), and gust wind speed (yellow) of CP3 in May from 2016 to 2021 (e). The solid curves in (e) display the daily values of each variable at 1200 LST for temperature, 1100 LST for gust wind speed, and 1300 LST for precipitation in May, and the straight dashed lines in (a–e) are the value of each variable at the corresponding hour on 22 May 2021. Shading represents the diurnal range of each variable.
In summary, the weather that occurred during the Tragedy Hours is considered an extreme cold event and an extreme high wind event for the month of May based on the records of the past six years (if the lower proposed threshold of top or bottom 5% is used to define an extreme event). In terms of precipitation, the Tragedy Day event was nowhere near an extreme weather event (Fig. 4b). However, when any given adjacent three hours were checked for surface temperature lower than 3.0°C, gust wind speed greater than 11.2 m s?1, and precipitation greater than 0.1 mm, besides the Tragedy Day, 1 and 13 May 2016, 3 May 2017, and 21 May 2018 were the only four samples found to meet the criteria, ranking the Tragedy Hours in the top 0.1%. Based on this analysis of combining low temperature, high wind speed, and precipitation, it can be concluded that the weather event during the Tragedy Hours was extreme.
We used the forecasts at 1400 LST 22 May from the deterministic runs and ensemble runs of the ECMWF and GRAPES models to further evaluate the forecast performance for meteorological variables. Since the tragedy was caused by hypothermia, surface temperature, gust wind speed, and precipitation were chosen. For surface temperature, the ECMWF deterministic run initiated 24 hours prior forecasted a low temperature of 5.5°C, which was within 1.0°C of the estimated actual low temperature. The GRAPES ensemble run initiated two days prior predicted a low temperature close to 4.5°C (Fig. 5b), but that forecast may not have been useful because the accurately forecasted low temperature did not persist as lead time was reduced. Moreover, the top and bottom temperature range from ensemble forecasts valid at 1400 LST 22 May with different lead times (represented by the shading in Fig. 5) covered the low temperature in all seven (five) days prior to the event for the ECMWF (GRAPES) model. Although the low temperature occurred with low probability, it provided useful information for warning event organizers and participants that they might be exposed to such a low temperature. This information would have given the organizers enough time to prepare for the low temperature.
 Figure5. ECMWF (a) and GRAPES (b) forecasts valid at 1400 LST 22 May 2021 with 6–354 h lead times. The colors of light blue, red, and yellow represent the 6-h accumulated precipitation, temperature, and maximum gust wind speed between 0800–1400 LST, respectively, from the deterministic run (solid line) and ensemble runs (shading). The dashed lines represent the analyzed values for the three variables at the valid time at CP3.
Since only the ECMWF model output included the maximum gust wind speed from the prior six hours, we compared its forecasted maximum gust wind speed during 0800–1400 LST on the Tragedy Day with the analyzed maximum gust wind speed during the same time period. The deterministic forecasts maintained gust wind speeds stronger than 11.2 m s?1 for all nine days leading up to the event (Fig. 5a). Additionally, more than half of the 50 ensemble members with 10 days lead time forecasted gust wind speed to exceed the analyzed value. These persistent high gust wind speed forecasts provided evidence to support high wind warnings.
In terms of precipitation forecast, both the GRAPES and ECMWF models performed reasonably well. In general, both the ECMWF and GRAPES models produced light precipitation forecasts 1–3 days before the Tragedy Hours for the deterministic runs, while the ensemble runs provided a certain likelihood of precipitation with 15 days lead time. Low-temperature forecasts were produced in deterministic runs with one day lead time by ECMWF, while a few ensemble members forecasted temperatures lower than the estimated value at CP3 as early as seven days prior by ECMWF and five days prior by GRAPES. The gust wind speed was also predicted by ECMWF starting from nine days before the Tragedy Hours.
High-impact weather events have never been precisely defined. They are normally perceived as events having major effects on society and economy, such as severe thunderstorms, tropical cyclones, and heatwaves. However, it is hard to measure the effects on society and economy because both depend on human activity. It is likely that a non-severe weather event causes a major effect on society. As an example, a light rain event during National Day marching activities with the participation of around 10 000 people is a high-impact weather event. With 21 deaths, there is no doubt that the weather on the Tragedy Day is considered a high-impact weather event. But if there were no race, it would not have been high-impact weather. So, an extreme weather event does not have to be a high-impact weather event, and a normal weather event might be an extreme weather event.
Defining the weather event on 22 May as high-impact weather or extreme weather is not the key point of this study. The ECMWF deterministic forecast with lead time of 30 hours correctly predicted the time and location of the cold front and its associated low temperature, high gust wind speed, and light precipitation. However, tragedy still occurred. Therefore, the key question is: What lessons have we learned from this tragedy?
1) In addition to standard weather forecasts, hazard and impact forecasts of high-impact weather should be developed in order to reduce loss of life risks.
One may ask why the model forecast information was not utilized to warn the race organizers and runners. To answer that question, it is helpful to recognize that a high-quality weather service should be tailored to different users based on their specific needs. In this case, warnings were issued only regarding weather, which apparently did not translate into a warning of potential risks to organizers and runners. Hazard and impact forecasts, in addition to the weather forecast, would have been useful in preventing the tragedy. What the organizers and runners really needed was a hypothermia risk forecast at the race site for a particularly short time period. Currently in China, hypothermia risk is not the service responsibility of the local weather forecasting agencies. With more and more people being involved in the Ultramarathon in China, the market might stimulate private enterprises to make hazard and impact forecasts in the future. It is also suggested that the government should enact rules requiring marathon organizers to obtain and secure specialized forecast services and products from the local weather forecasting agencies.
2) Probability forecasts can provide valuable information and hence should be issued by government weather agencies and communicated well to the public.
About ten years ago, probability weather forecasts first appeared in China, but it was difficult for the government and public to accept it because probabilistic forecasts were perceived as imprecise. Even with recent advances in numerical weather prediction, the accuracy of deterministic forecasts can still vary a lot from day to day due to atmospheric predictability limits. Therefore, a deterministic forecast alone can not provide adequate information for planning and decision making. In this tragedy case, the deterministic forecast and at least half of the ensemble members produced high wind speed forecasts 10 days prior to the event. Simply put, there was greater than a 50% risk of high wind speed, and the organizers should have had enough time to prepare for the risk if the forecast and its probability had been delivered to the end-user. Even if the message of the 50% risk of low temperature and high wind speed were delivered to the runners just one day before the event, most of them would have worn jackets.
3) Knowledge of how to evaluate the impact of weather should be delivered to public.
Although high-impact weather normally refers to severe weather, non-severe weather can become high-impact weather when certain human outdoor activities are involved. Runners in shorts and vests are vulnerable to low temperatures, which in this case were exasperated by high wind speeds and precipitation. In this case, the organizers and most of the runners were not aware of the high wind speed warning and the precipitation forecast. It should be pointed out that there were 4–5 runners who had passed the CP2–CP3 segment successfully that day because they had brought outdoor jackets to keep them warm. Different people may evaluate the impact or risk of weather at different levels. If the organizers (or runners) had been able to make the right impact evaluation and prepared the runners (or themselves) for the extreme weather, the tragedy would have been prevented.
How to increase the value of weather forecasts to provide better service to users and to prevent weather-related disasters is a great challenge. To meet this challenge, the World Meteorological Organization (WMO) World Weather Research Program (WWRP) launched a 10-year international high-impact weather (HIWeather) project in 2016.
The HIWeather project is guided by the idea of an end-to-end approach for the provision and improvement of forecasts and warnings for high-impact weather events, from understanding, observing, and predicting the phenomenon and its impact, to an appropriate communication of forecasts and risks, and to successful warnings. A conceptual model of warning chain was produced in the HIWeather project in pursuit of successful weather-hazards warnings. The value chain comprises the following components and their connections: observations, weather forecast, hazard forecast, impact forecast, the generation of warnings, and decision making (Fig. 6). Those components need not only meteorological and related physical sciences, but also social, behavioral, and economic sciences. Thus, the bridges connecting them depend on applications of social science, especially communication science. From observation to decision making, there are several “mountains and valleys” to overcome. Collaborations among scientists in different areas, governments, social media, and citizens are needed for successful hazard prevention.
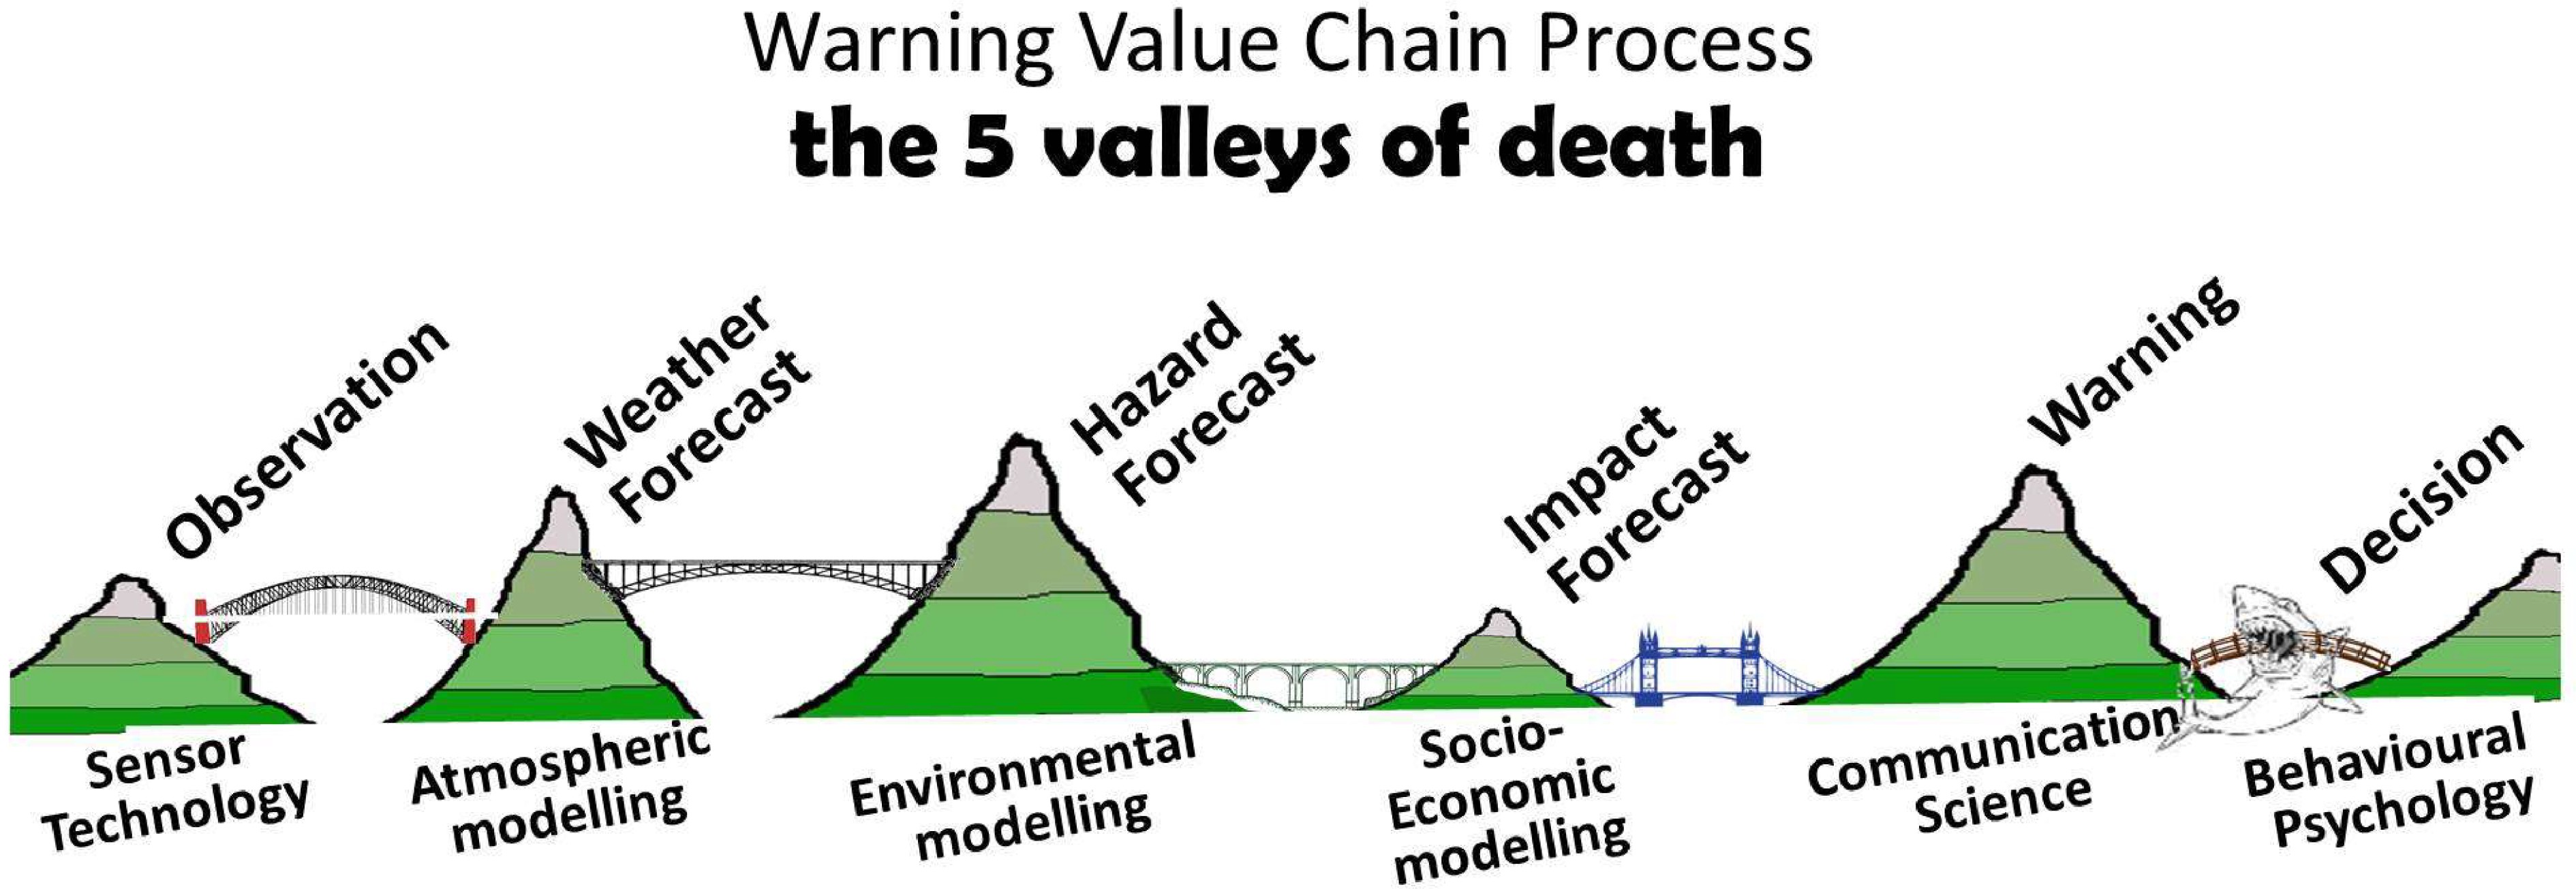 Figure6. Conceptual model of warning value chain. Bridges represent interdisciplinary or interagency communication (reproduced from Zhang et al., 2019).
Acknowledgements. This study was supported by the National Key Research and Development Project (Grant No. 2017YFC1502004) and National Natural Science Foundation of China under Grant No. 42030607.
