HTML
--> --> -->The characteristics of the MCSs and the associated back-building convective lines are different in different synoptic environments. The back-building MCSs east of the Rocky Mountains in the United States have a quasi-stratiform area of convection that produces a region of stratiform rain on the rear side of the MCS, and the back-building process is generally dependent on lifting provided by storm-generated cold pools (Schumacher and Johnson, 2005). Over the northwestern Mediterranean, back-building quasi-stationary MCSs often form in an environment of moist and conditionally unstable air, which is carried by a southwesterly to southeasterly low-level marine flow (Ducrocq et al., 2013). The low-level cold pool under the MCS can lift the marine flow (Ducrocq et al., 2008) or modify the low-level circulation to enhance convergence forcing locally (Duffourg et al., 2016) to induce back-building processes. When this moist and conditionally unstable flow impinges on some of the mountains along the western Mediterranean, orographic lifting has been proposed as a mechanism for triggering heavy precipitation events involving back-building MCSs (Buzzi et al., 1998; Rotunno and Ferretti, 2001; Ducrocq et al., 2008).
In east China, the MCSs associated with a quasi-stationary or slow-moving front during the mei-yu season (also known as the Changma season in Korea or the Bai-yu season in Japan) are essential systems for producing heavy rainfall events over the Yangtze-Huai Rivers basin (Ding, 1992; Chen et al., 1998; Zhang and Tan, 2009; Luo et al., 2013). Some MCSs embedded with quasi-linear back-building convection are often observed along the mei-yu front. Luo et al. (2013) investigated a back-building MCS along a mei-yu front during the midnight-to-morning hours and found two scales of the convective organization during the development of the MCS: one is the east- to northeastward “echo training” of convective cells along individual rainbands, and the other is the southeastward “band training” of the rainbands (the movement of the parallel rainbands) along the quasi-linear MCS. MCSs with a similar convective organization as in Luo et al. (2013) are also found in extreme rainfall events occurred over coastal South China during the pre-summer rainy season (e.g., Wang et al., 2014; Liu et al., 2018), while the mesoscale mountains near the coastal line sometimes can play a role in the convective initiation and organization.
The back-building MCS in Luo et al. (2013) occurred in an area of flat terrain, while many mountains with a mean height of ~1000 m can be found over the Yangtze River-Huaihe River basin (Wang and Tan, 2006), which could have an effect on the back-building MCSs along the mei-yu front. Sun et al. (2015) found the mountains favor the formation and maintenance of the back-building pattern of a mei-yu front MCS, but the role of the mountains was not revealed in detail. For the mei-yu front MCS over complex terrain, it is still not clear how the mountains modify the cold outflow under the MCS and how the mountains alter the back-building process of the convective lines associated with the MCS. Moreover, the mountains on the south side of the mei-yu front can modify the upstream airflow that approaches the mei-yu front, which can affect the evolution of the back-building MCS. This study will investigate a typical case involving back-building MCSs over complex terrain during the mei-yu season, with the primary aim being to focus on the role of the complex terrain in the formation of the back-building convective lines associated with the mei-yu front MCSs.
The rest of this paper is organized as follows: Section 2 gives an overview of the case. The numerical model and experiment design for the simulation of the case are introduced in section 3. The results are discussed in detail in section 4. Finally, a summary is given in section 5, including a conceptual model of the role of the complex terrain in the formation of the back-building convective lines.
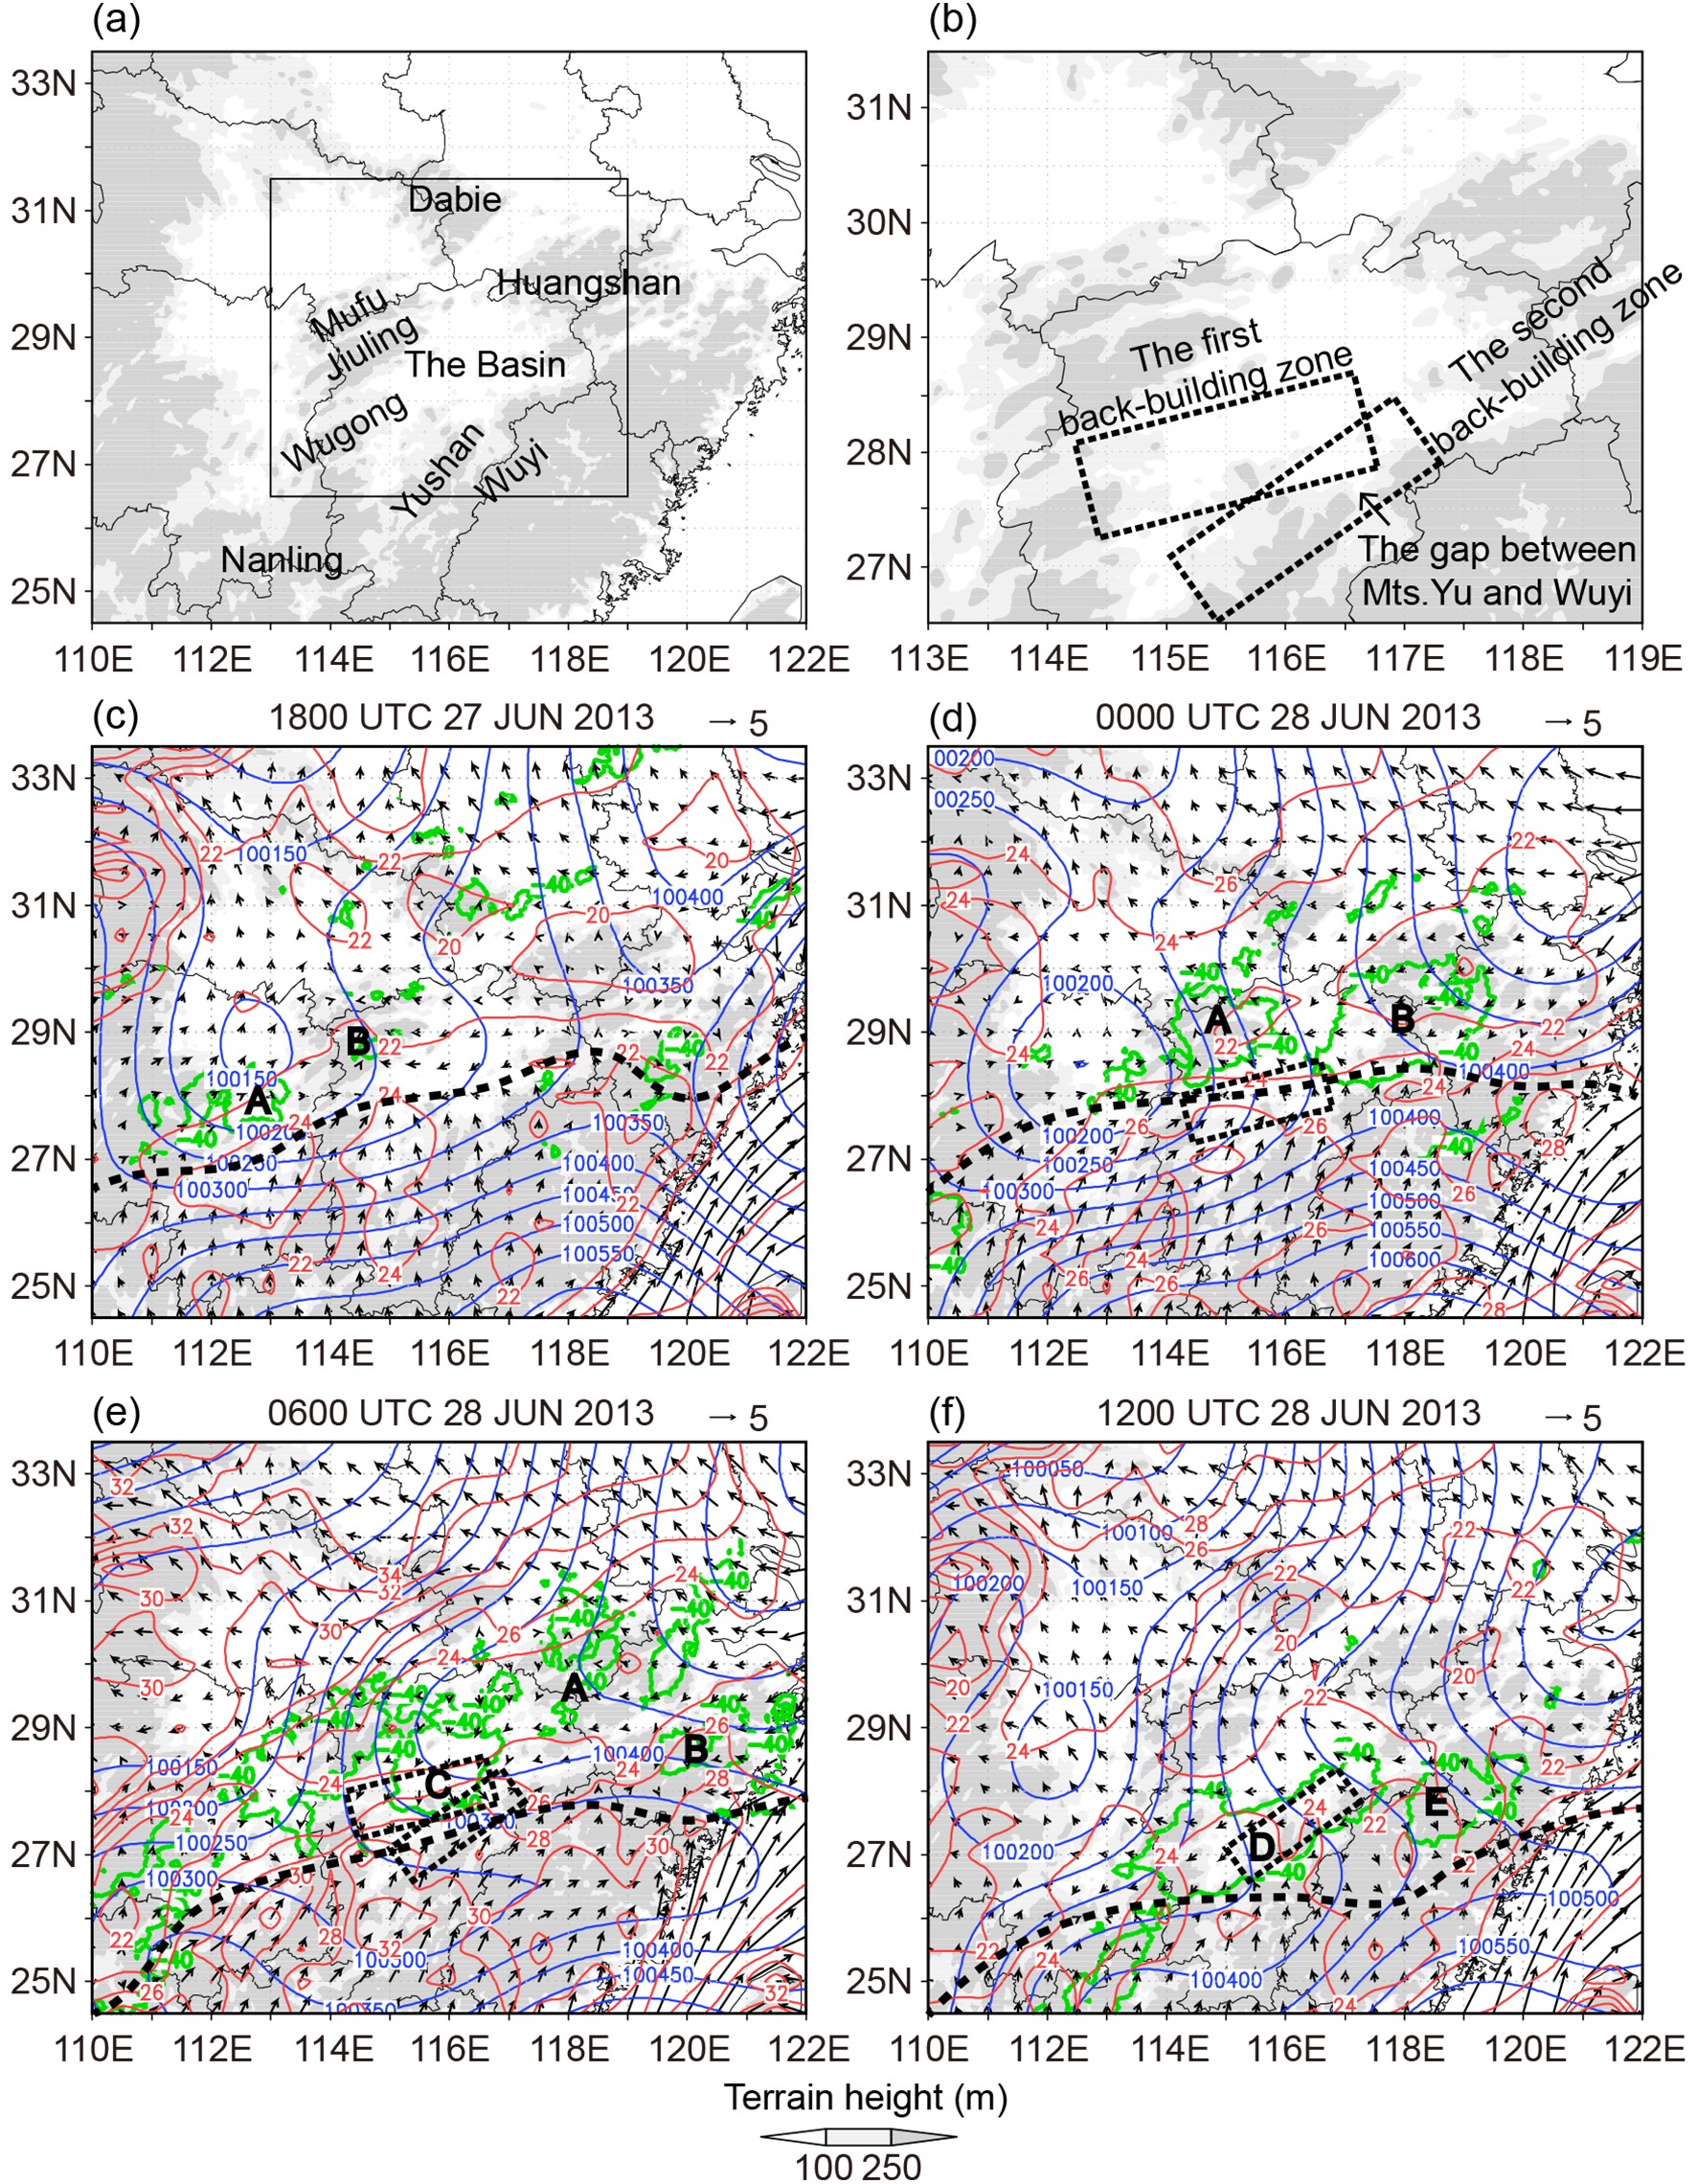 Figure1. Panels (a) and (b) show the terrain features. The terrain height is shaded in grayscale. A basin and surrounded mountains of Nanling, Wugong, Yushan, Wuyi, Jiuling, Mufu, Dabie, and Huangshan are denoted in (a). The basin area outlined with a solid box in (a) is enlarged in (b) with two zones of back-building and the gap between Yushan and Wuyi Mountains denoted. Panels (c?f) show the mean sea level pressure (blue contours, hPa), 2-m temperature (red contours, °C), 10-m horizontal winds (vectors, m s?1), and the infrared brightness temperature (TBB) at –40°C (thick green contours) at (c) 1800 UTC 27 June 2013, (d) 0000, (e) 0600, and (f) 1200 UTC 28 June 2013. The fields of pressure, temperature, and wind are plotted from the NCEP 0.25°×0.25° reanalysis data. The TBB data are obtained from the satellite data archive for research and education at http://weather.is.kochi-u.ac.jp/sat/GAME/. The evolution of two focused cloud clusters (labeled with “A” and “B”) in (c) is shown in Fig. 2. The bold dashed line denotes the south leading edge of the mei-yu front. The first zone and the second zone of back-building are also shown in (d?e) and (e?f), respectively. See the text for the details.
The NCEP 0.5°×0.5° reanalysis data (National Centers for Environmental Prediction, 2003) are used to portray the environmental conditions for the case. At 1800 UTC 27 (0200 LST 28), June 2013 (Fig. 1c), the mei-yu front region characterized by weak temperature gradients and low wind speeds covered the basin area. The leading edge of the mei-yu front, identified by the sharp contrast of the near-surface horizontal wind vectors at 10 m above ground level along the south boundary of the weak gradients of 2-m temperature, was located on the north side of the Nanling and Wuyi Mountains. To the west of the basin, there was a low pressure center embedded within the mei-yu front. The circulation of the low showed interactions with the southerly airflow ahead of the mei-yu front and also with the Jiuling and Mufu Mountains, where two cloud clusters labeled with A and B formed. The cloud clusters in Fig. 1 are outlined by the ?40°C isotherm of the infrared brightness temperature (TBB) retrieved from Multi-functional Transport Satellite (MTSAT).
Over the next 6 hours, the cloud cluster B moved eastward and quickly developed within the basin area (Fig. 1d). The cloud cluster A also developed and propagated over the Jiuling and Mufu Mountains. The southerly airflow ahead of the mei-yu front became stronger at this time, and both of the two cloud clusters extended southwestward to the first back-building zone, showing more or less back-building features. The back-building features are hypothesized to be a result of interaction between the stronger southerly airflow and the cold outflow associated with the precipitation of the two cloud clusters.
Six hours later (Fig. 1e), cloud cluster B weakened and moved out of the basin area, and cloud cluster A also weakened and separated into cloud cluster segments. To the southwest of cloud cluster A, a new cloud cluster C formed, which also showed a back-building character on its southwest side within the first back-building zone. The cloud clusters C and A exhibited linear shapes roughly parallel to each other, and their back-building development appeared to push the leading edge of the mei-yu front southward.
After another 6 hours (Fig. 1f), cloud clusters C and A also moved out of the basin area and dissipated. Meantime, a new cloud cluster D covering the second back-building zone, which originated roughly from where C quickly grew, and a new cluster E east of D developed rapidly along the Yushan and Wuyi Mountains, and further pushed the leading edge of the mei-yu front southward.
The detailed evolution of the cloud clusters mentioned above is shown in Fig. 2 in hourly maps of TBB. Note the line features of the cloud clusters A and C in Fig. 2d, which can be identified from the lower values of TBB and the wave pattern of the south sides of the two cloud clusters. This is the first stage (stage I) of back-building starting from the first back-building zone shown in Fig. 1b. The development of cloud cluster D also shows line features of back-building (Fig. 2j), and the back-building development of the cloud cluster E east to D is much clearer (Figs. 2h-j). The second stage (stage II) of back-building starts from the second back-building zone shown in Fig. 1b and is also associated with the interaction between the cold outflow in the basin area and the southerly airflow ahead of the mei-yu front. At the same time, the mountains should play an important role as the leading edge of the mei-yu front moved southward.
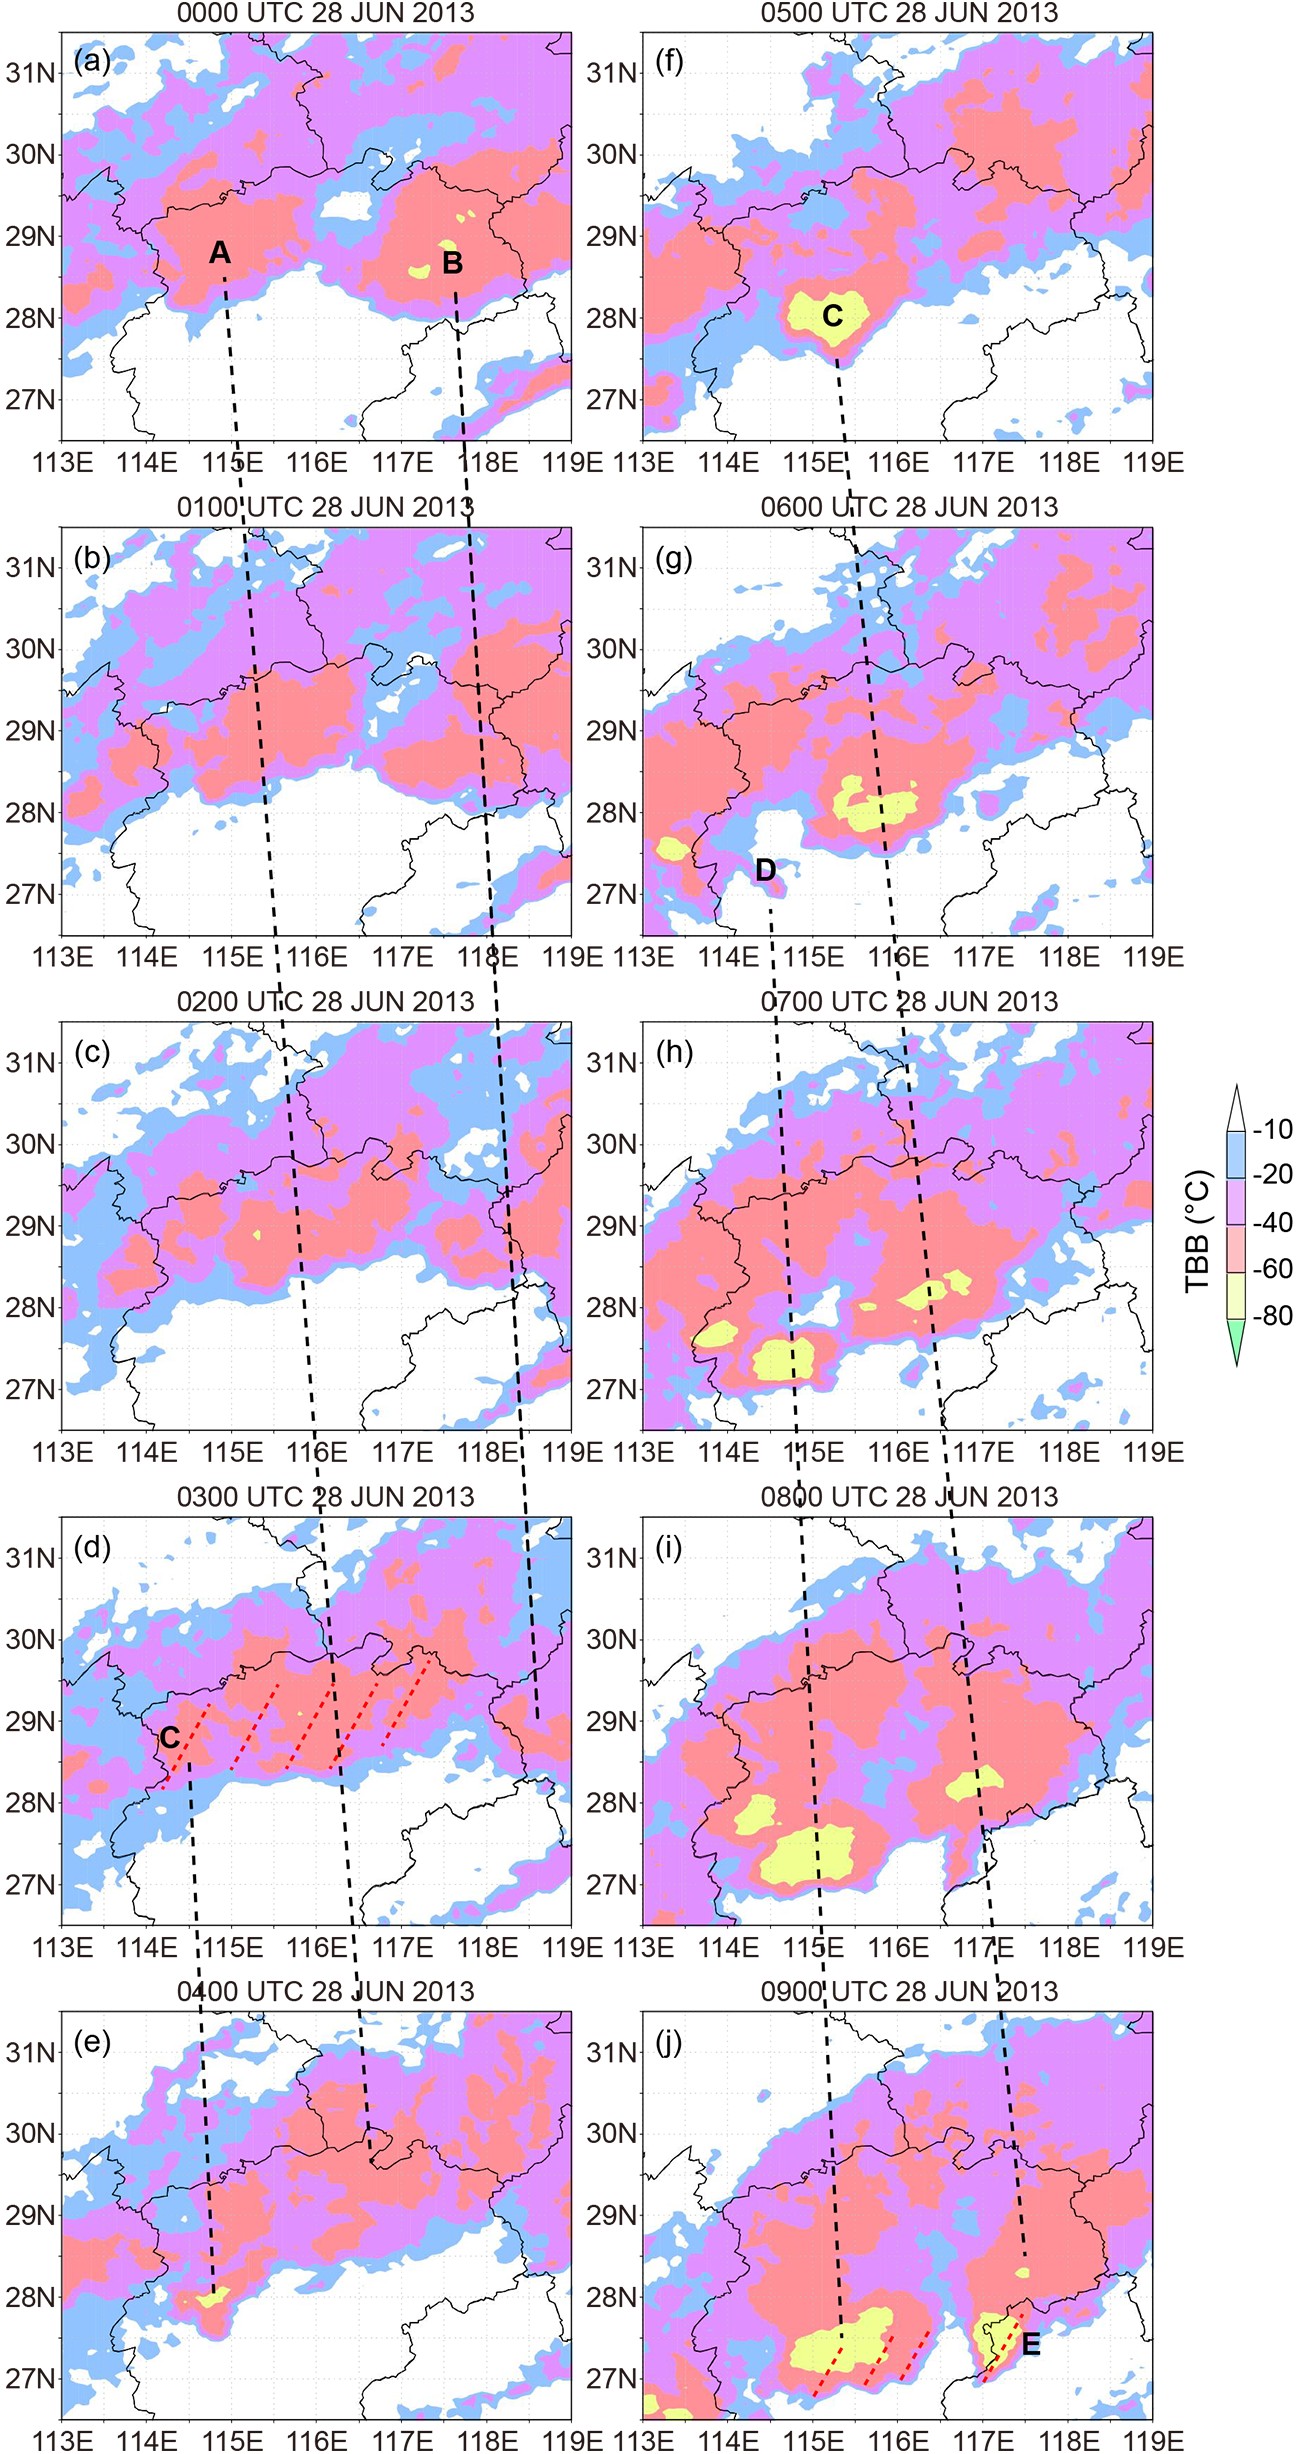 Figure2. Evolution of TBB (shaded) in the solid box region in Fig. 1a at (a) 0000, (b) 0100, (c) 0200, (d) 0300, (e) 0400, (f) 0500, (g) 0600, (h) 0700, (i) 0800, and (j) 0900 UTC 28 June 2013. The focused cloud clusters are labeled as A, B, C, D, and E. The black dashed lines denote the positions of the cloud clusters. The red dashed lines in (d) and (j) show the line features of the cloud clusters. The TBB data are obtained from the satellite data archive for research and education at http://weather.is.kochi-u.ac.jp/sat/GAME/.
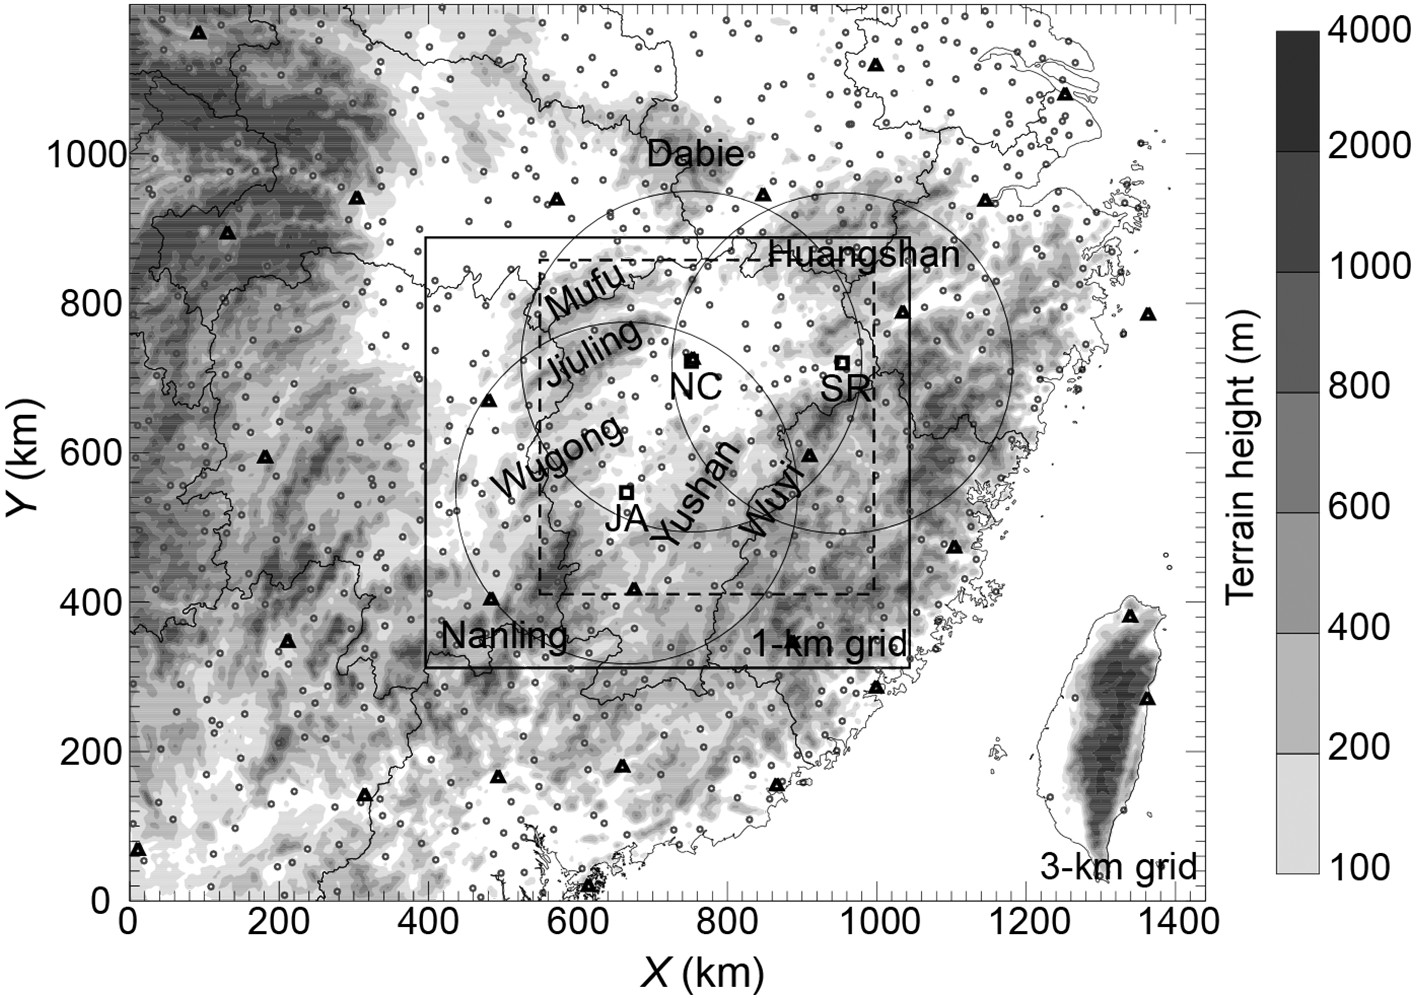 Figure3. The 3-km model domain nested with a 1-km subdomain (solid box). The small triangles and circles mark the stations from conventional radiosonde and surface networks, respectively. The small squares mark radar locations of Nanchang (NC), Ji’an (JA), and Shangrao (SR), with large circles indicating their maximum radar ranges. The dashed box denotes the horizontal plotting region in later figures. The terrain elevation is shaded in grayscale with mountainous regions denoted as in Fig. 1a.
The model is initiated at 1200 UTC 27 June 2013 and is integrated for 36 hours until 0000 UTC 29 June 2013. For the 3-km grid, the lateral boundary conditions (LBCs) are generated from GFS global 0.5-degree analysis fields at 6-hour intervals obtained from the Historical Unidata Internet Data Distribution (IDD) Gridded Model Data (National Centers for Environmental Prediction, 2003). The initial condition for the 3-km grid is created using the ARPS three-dimensional variational (3DVAR) data analysis scheme (Gao et al., 2004) based on the GFS global 0.5-degree analysis fields and the conventional radiosonde and surface observations shown in Fig. 3. The nested 1-km grid gets its initial condition from the interpolation of the 3-km analysis and its LBCs from the 3-km forecasts at 10-min intervals. The ARPS is used in its full physics mode, as in Wang and Xue (2012).
In this case, the cold outflow is generally confined within the basin surrounded by the Mufu-Jiuling and Huangshan Mountains on the north side, and several low mountains are scattered among the first back-building zone where stage I convective lines formed. It is not clear whether the low mountains play a role in the formation of stage I convective lines. Neither is it clear whether the Mufu-Jiuling and Huangshan Mountains play a role in altering the strength of the cold outflow within the basin and, thus, the back-building processes associated with the cold outflow interacting with the southerly flow along the leading edge of the mei-yu front during the two stages of convective line formation. To evaluate the two points in question, sensitivity experiments with the mountains parallel to the leading edge of stage I convective lines removed (NoMidMts) and with the Mufu-Jiuling and Huangshan Mountains on the north side of the basin removed (NoNorthMts) were designed, respectively (Table 1).
| Abbreviation | Description |
| CNTL | The control experiment using real terrain. |
| NoMidMts | The mountains parallelly near the leading edge of stage I convective lines are removed. |
| NoNorthMts | The Mufu-Jiuling and Huangshan Mountains on the north side of the basin are removed. |
Table1. Experiment design.
4.1. The simulated convective lines and cold outflow
Figure 4 shows the observed (left, obtained from radar observations at Nanchang, Ji’an, and Shangrao as shown in Fig. 3) and the simulated (right) composite radar reflectivity (RFC) at 0300 and 0900 UTC 28 June 2013. The lines of the cloud cluster in Figs. 2d and 2j primarily correspond to the lines of RFC shown as dashed lines in Figs. 4a and 4c, respectively. The line features of the RFC at the two stages are generally reproduced in the simulation (dashed lines in Figs. 4b and 4d), except the simulated RFC is slightly greater, and the position of the convective lines is slightly to the south of the observed convective lines. The simulation also reproduces the broad stratiform region that follows the convective lines at the two stages (Figs. 4a-b and 4c-d). The convective line corresponding to the cloud cluster E in Fig. 2j was initiated later in the simulation and did not separate from the other convective lines (Fig. 4d), as observed (Fig. 4c), which will be discussed next.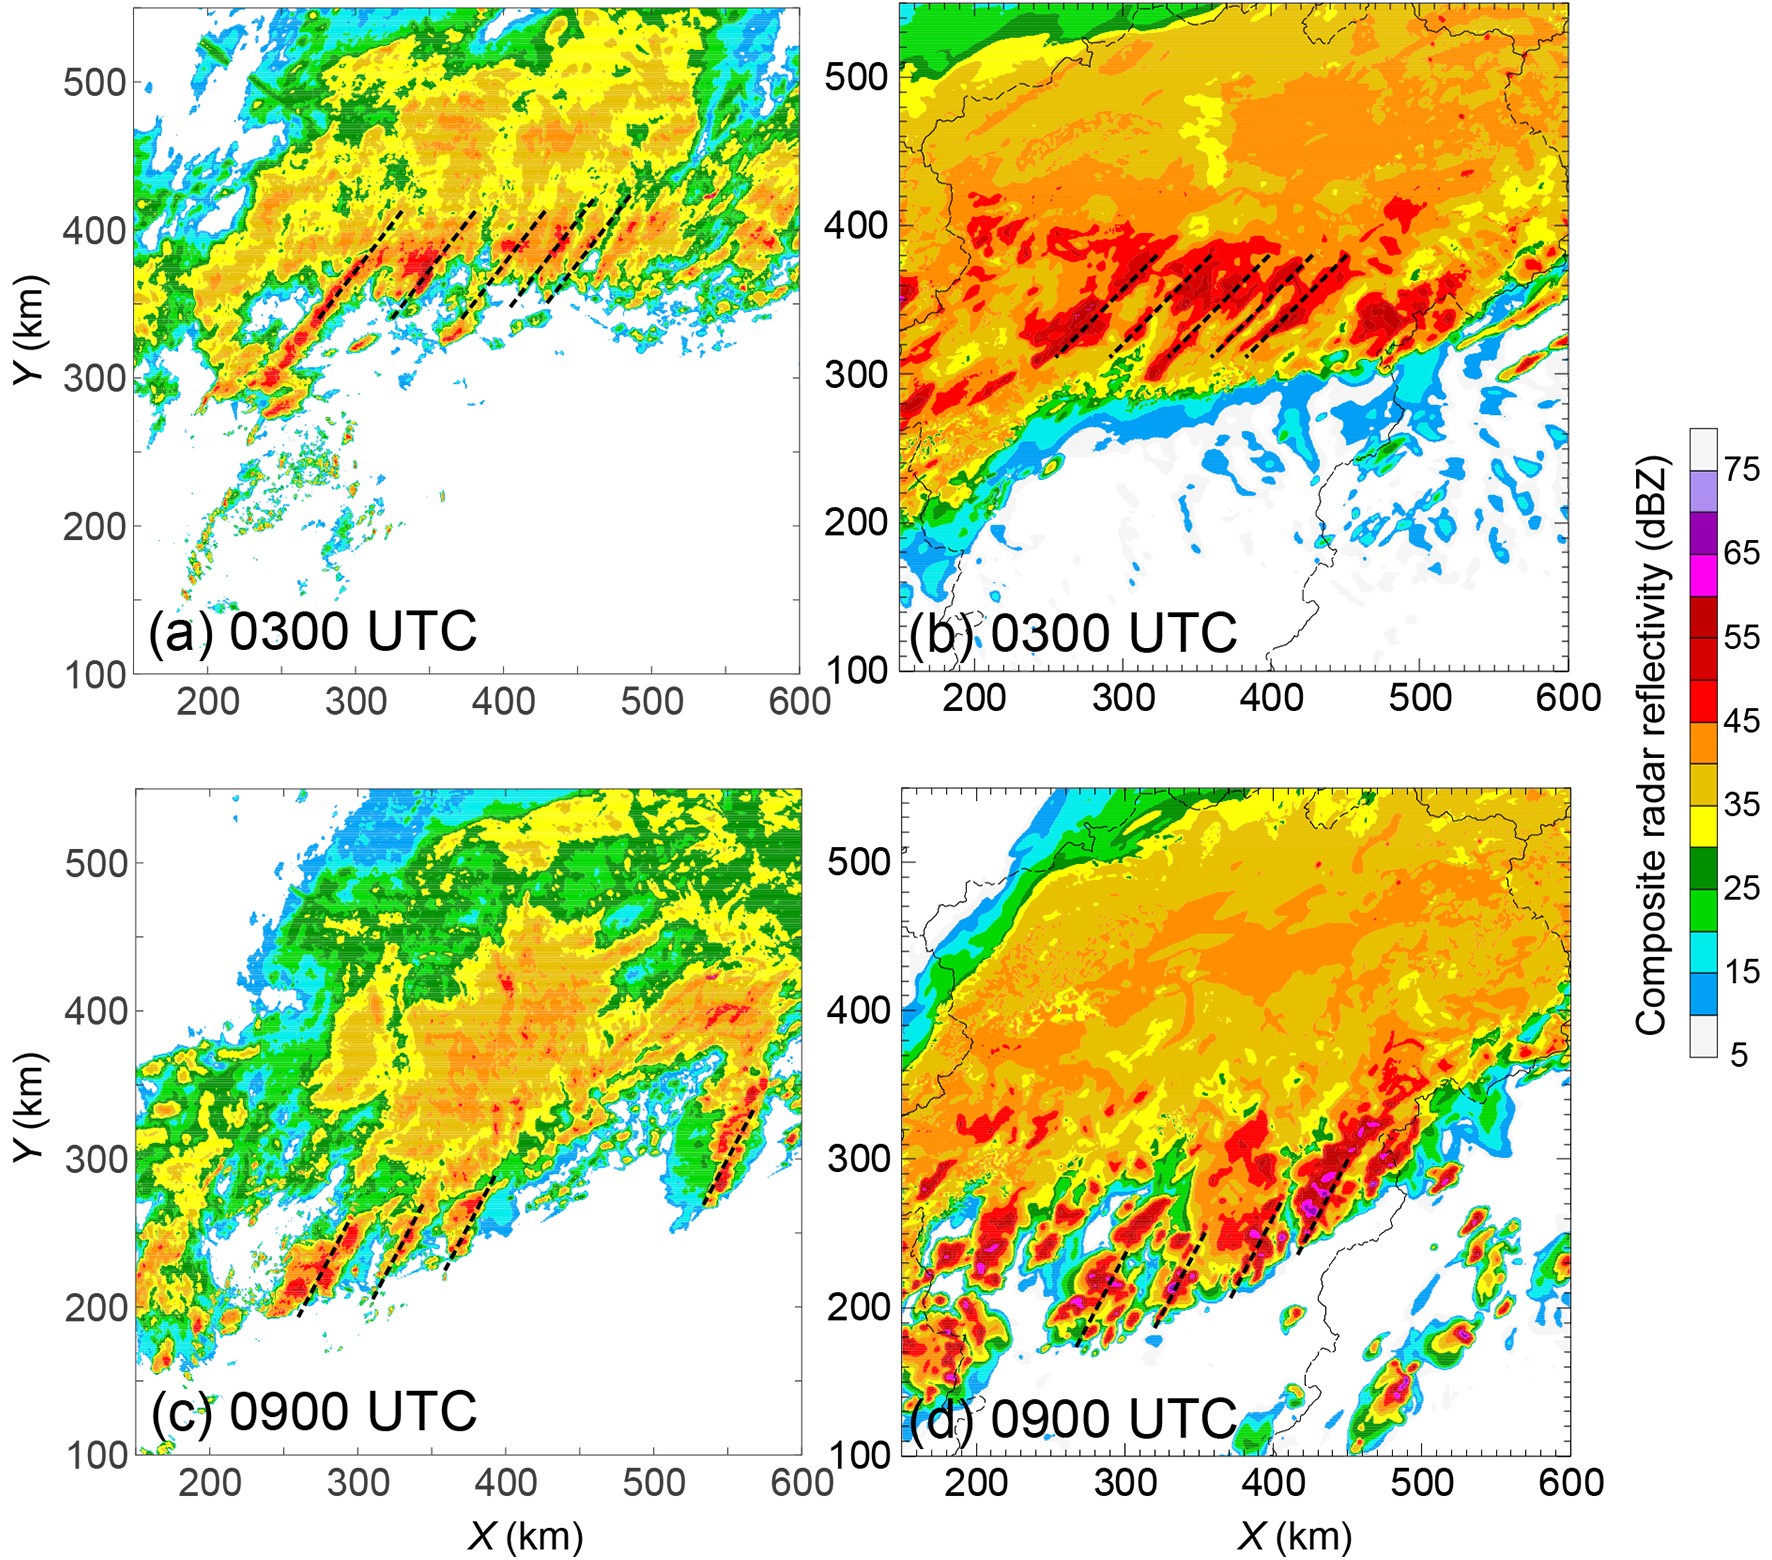 Figure4. Observed (left) and simulated (right) composite radar reflectivity at (a, b) 0300 and (c, d) 0900 UTC 28 June 2013. The dashed lines denote the line features of the composite radar reflectivity.
The two stages of back-building convective line formation are associated with the interaction between the cold outflow in the basin and the southerly airflow ahead of the mei-yu front, as discussed in section 2. The cold outflow linking with precipitation in the basin is shown in Fig. 5. The precipitation data used in Figs. 5a and 5b is the hourly, 0.1° × 0.1°, gauge-satellite merged precipitation product, which can be obtained from the National Meteorological Information Center of China. (available at
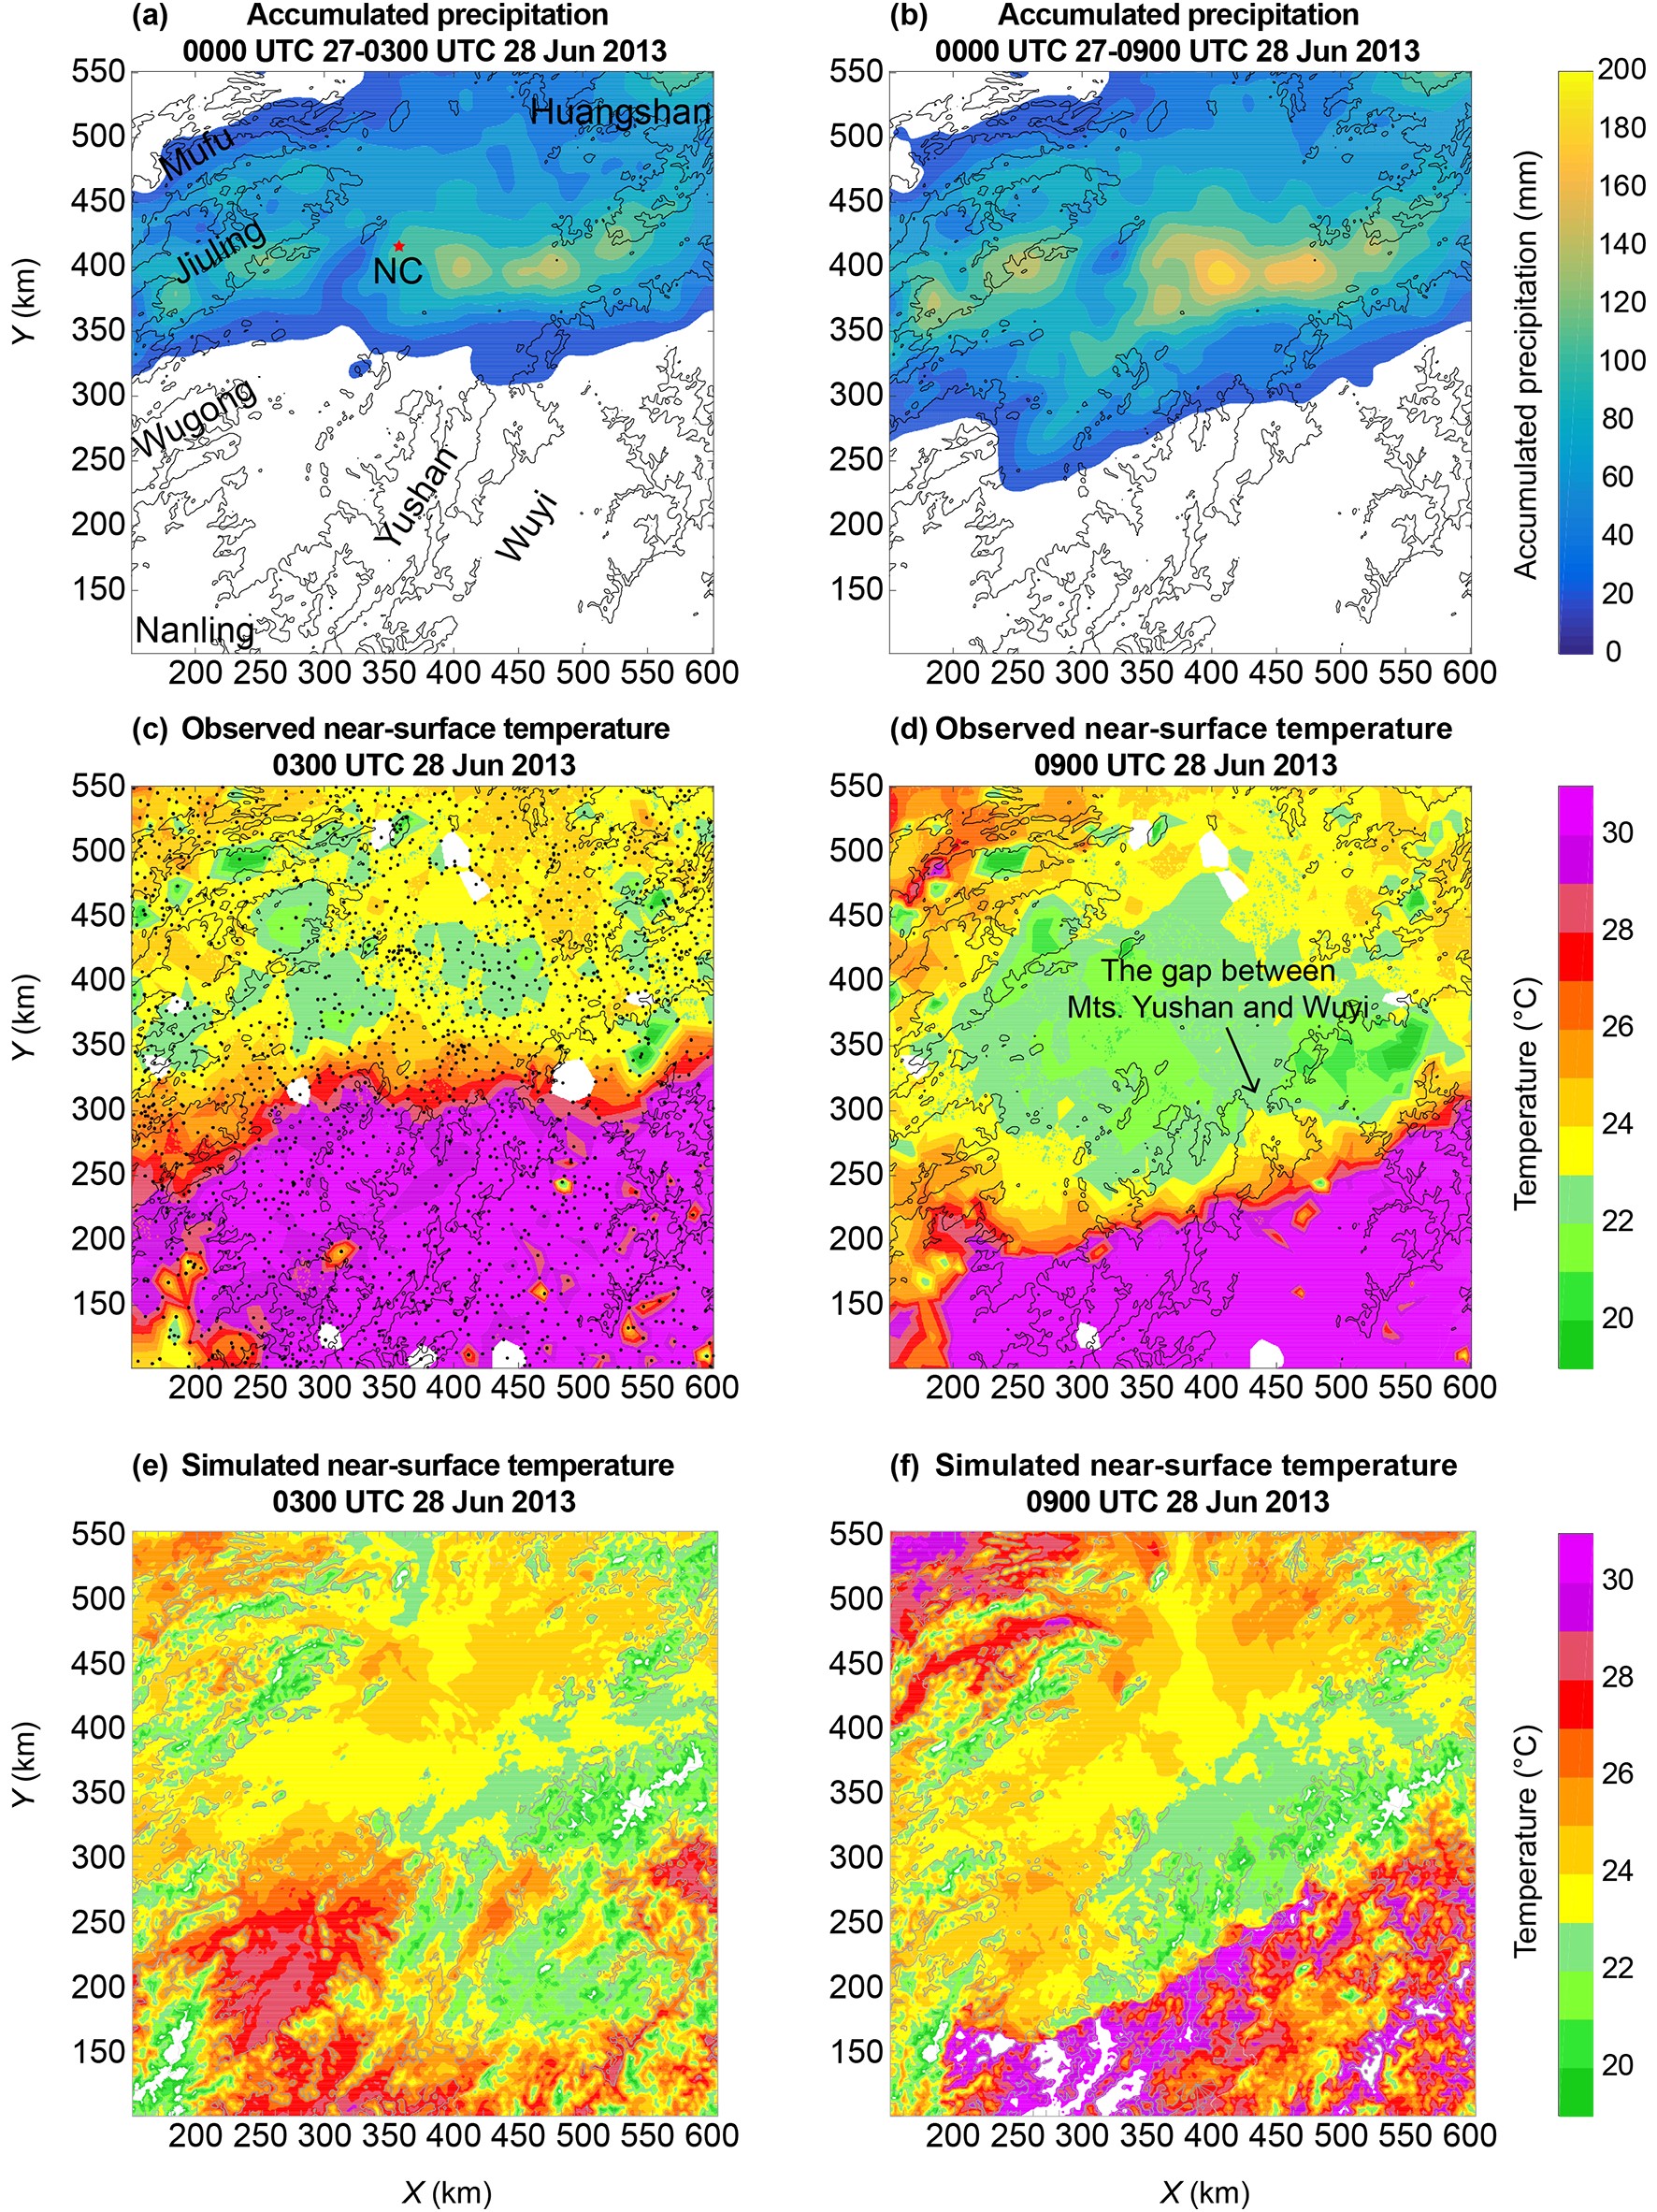 Figure5. Accumulated precipitation from 0000 UTC 27 June to (a) 0300 and (b) 0900 UTC 28 June 2013, and observed near-surface temperature at (c) 0300 and (d) 0900 UTC 28 June 2013. The plots of simulated near-surface temperature at 0300 and 0900 UTC 28 June 2013 are shown in (e) and (f), respectively. The red star in (a) denotes the location of Nanchang (NC), where the soundings are extracted from model forecasts and are shown in Fig. 6. The observed precipitation data are from the gauge-satellite merged precipitation data obtained from the National Meteorological Information Center of China (available at http://data.cma.cn/data/detail/dataCode/SEVP_CLI_CHN_MERGE_CMP_PRE_HOUR_GRID_0.10/keywords/CMORPH.html). The observed temperature data were from the observations of the automatic weather stations (AWS) shown as dots in (c).
The centers of accumulated precipitation from 0000 UTC 27 to 0300 UTC 28 June 2013 are mainly over the Jiuling Mountains and the western part of the basin between the Wuyi and Huangshan Mountains (Fig. 5a), roughly corresponding to the centers of cold outflow when stage I convective lines formed (Fig. 5c). The development of stage I convective lines induced heavy precipitation over the next 6 hours, and the accumulated precipitation by 0900 UTC 28 June 2013 becomes larger, spreading southward and extending to the southwestern part of the basin between the Wugong and Yushan Mountains (Fig. 5b). The cold outflow centers correlate less with the centers of the accumulated precipitation (Figs. 5b and 5d) due to the cold outflow that responded more directly to the recent 6-hour precipitation. The cold outflow advanced towards the Yushan and Wuyi Mountains and pushed the leading edge of the mei-yu front (stronger gradient of temperature) southeastward over the next 6 hours (Figs. 5c and 5d). It is conjectured that the Yushan and Wuyi Mountains may have modified the interaction between the cold outflow and warm southerly airflow along the leading edge of the mei-yu front, which should connect with the formation of stage II back-building convective lines.
The simulated cold outflow in the basin is weaker than shown in the observations (Figs. 5c-d and 5e-f), while the cold outflow centers over the western part of the basin between the Wuyi and Huangshan Mountains (Fig. 5e) and approaching the Yushan and Wuyi Mountains (Fig. 5f) are generally captured in the simulation. The simulated weaker cold outflow is partially associated with initial errors and model uncertainties, which starts at 1200 UTC 27 June 2013 and failed to produce the observed long-time accumulated precipitation, as in Figs. 5a, b. On the other hand, were the simulation to have begun earlier, the prediction of the convective line formation would not be as good due to the uncertainty associated with the initiation and evolution of the convection in the model (not shown).
The warm southerly airflow near the surface is also poorly simulated in terms of temperature (Figs. 5c-d and 5e-f). At 0300 UTC 28 June 2013, the simulated boundary of the warm southerly airflow is diffuse near the surface (Fig. 5e). This may be partially associated with the imperfect representation of the mountain and valley circulations to the lee side of the Nanling Mountains due to shorter integration of the model. By 0900 UTC, the simulated near-surface boundary of the southerly airflow becomes clearer and more consistent with that of the observations (Figs. 5d and 5f). While the boundary differs locally near the gap between the Yushan and Wuyi Mountains, it is the warm southerly airflow in the observations (Fig. 5d) or the cold outflow in the simulation (Fig. 5f) that intrudes into the gap. The cold outflow intrusion into the gap in the simulation results in a later formation of the convective line than that in the observations (the right convective line in Figs. 4c and 4d).
Note that the orientation of the stratiform region in Fig. 4 is roughly west-east at 0300 UTC, but changes to southwest-northeastward by 0900 UTC 28 June 2013. Figure 2 suggests that the stratiform region partially comes from the decaying of the former convective groups along the mei-yu front. When new convective regions generated on the south side of the stratiform region, processes associated with the detrainment of air from the convective regions and the transition of the weakening convective regions to stratiform regions should have played an important role as discussed in Luo et al. (2010). Figure 6 shows the soundings at Nanchang within the stratiform region at two times. Mid-level westerly winds are seen between 700 and 500 hPa, and the mean wind direction between the two levels primarily indicates the orientation of the stratiform region at the two times, respectively. Generally, the orientation of the stratiform region is directly linked with mid-level flow associated with the front. The motion of the convective lines shows a similar orientation to that of the stratiform region due to the mid-level flow, while the orientation of the convective lines or cell motion closely follows the direction of the southwest flow that impinges on the mei-yu front.
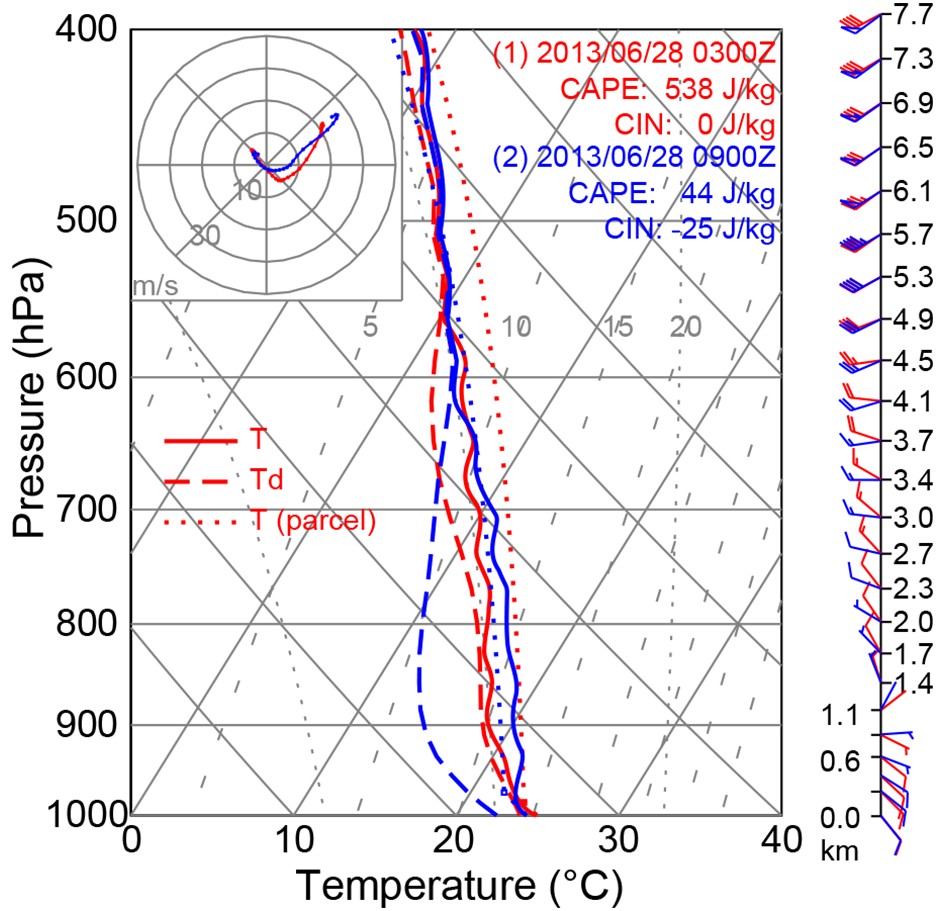 Figure6. Skew-T plots of soundings extracted from the model simulation at th e red star in Fig. 5a, at 0300 (red), and 0900 (blue) UTC 28 June 2013.
Below 900 hPa, southeast winds dominate (Fig. 6), indicating that the cold air flows from the cold outflow center to the sounding location at Nanchang. As the leading edge of the front advanced southward between 0300 and 0900 UTC 28 June 2013, the main body of the stratiform region gradually deviated from Nanchang, leaving drier and slightly warmer air in the mid-and-lower levels at Nanchang, but the near-surface cold airflow can still reach Nanchang, making the near-surface air at 0900 UTC colder than that at 0300 UTC (Fig. 6).
Overall, the convective lines, the cold outflow within the basin, and the warm southerly airflow ahead of the mei-yu front are reasonably simulated with acceptable correspondence to the observations, despite differences in strength and position details. This establishes the credibility of the model simulation to be further analyzed with a certain degree of confidence in the next sections.
2
4.2. Formation of convective lines during stage I
Low-level horizontal cross-sections at heights of 250 m and 500 m mean sea level (MSL) are plotted in Fig. 7 during the formation of stage I convective lines. The displays clearly show the interaction between the cold outflow and the warm southerly airflow and their modification by the local mountains. The convective lines along A1B1-A5B5 in Figs. 7c-f correspond to those shown as dashed lines in Fig. 4b.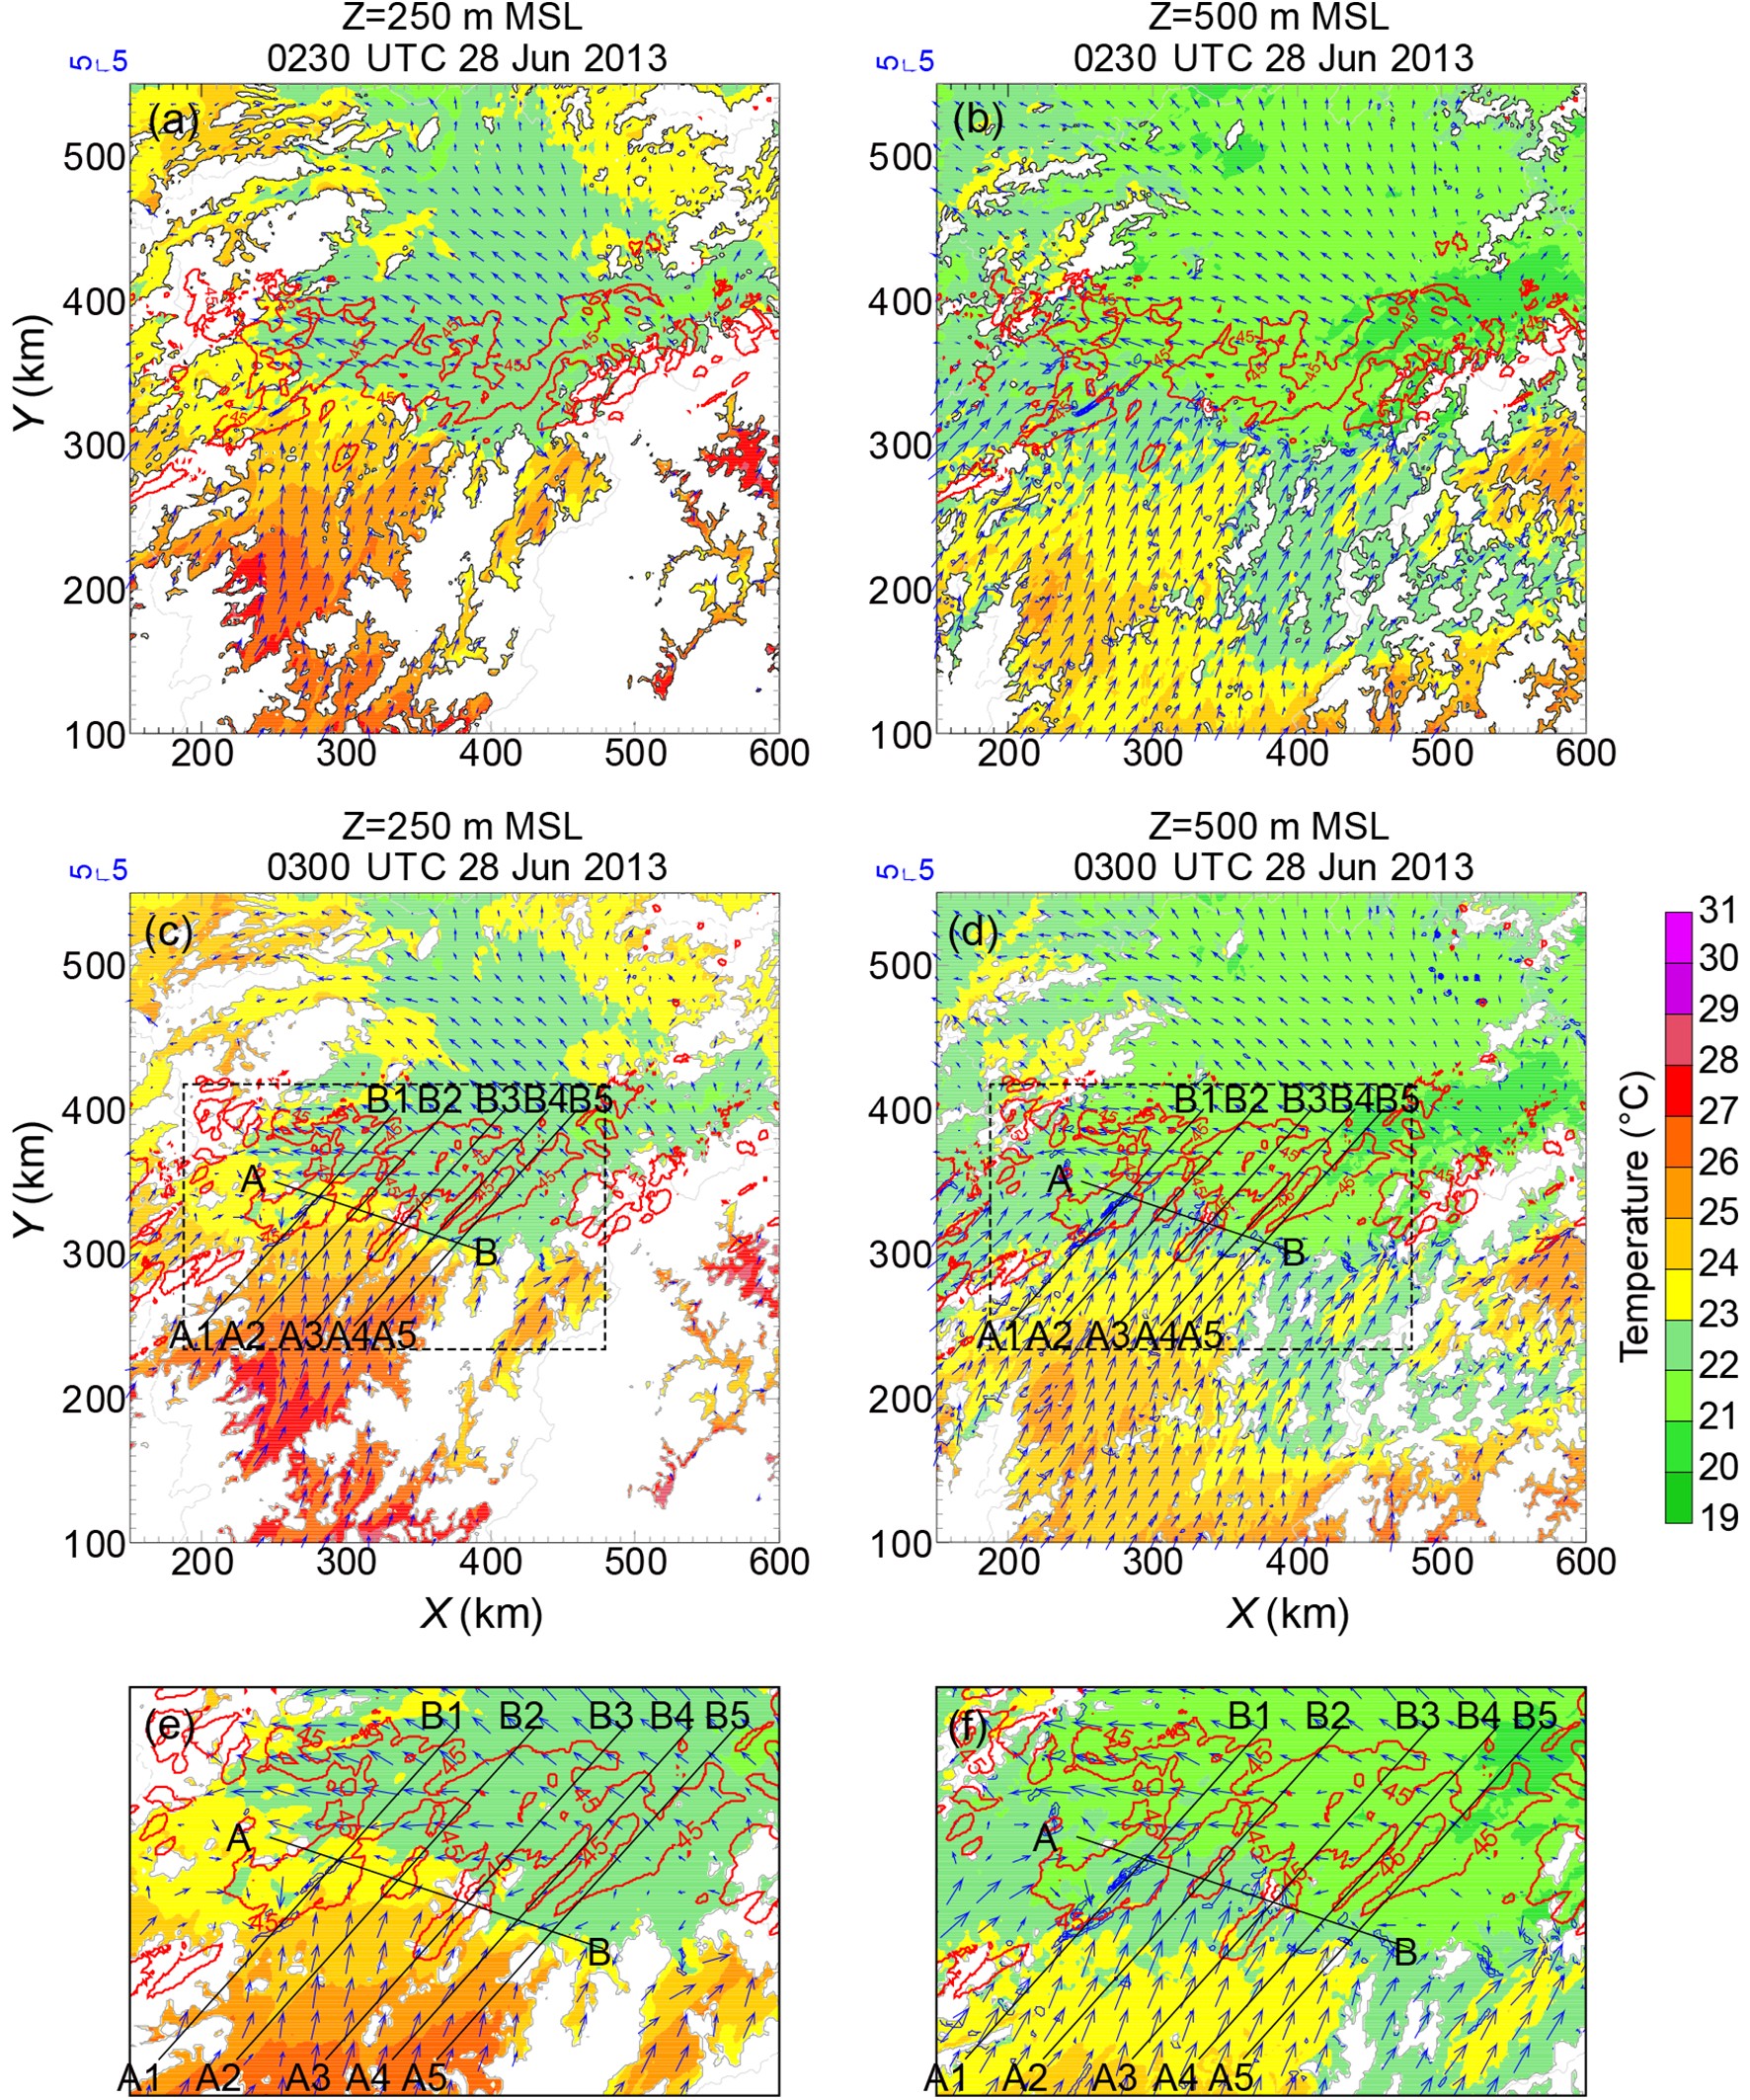 Figure7. Temperature (shaded, °C), wind vectors, and convergence (blue contours, with an interval of 2×10⁻³ s–1) at (left) 250 m and (right) 500 m MSL, with the times at (a, b) 0230 and (c, d) 0300 UTC 28 June 2013. The red contours show the 45 dBZ composite radar reflectivity at the corresponding times. The lines in (c) and (d) indicate the position of the vertical cross-sections shown in Fig. 8. The dashed box regions in (c) and (d) are enlarged in (e) and (f), respectively.
Within 30 minutes prior to the appearance of the line features of the convective group (Figs. 7a-d), the cold outflow centers at 250 m and 500 m MSL are located over the western parts of the basin, and between the Wuyi and Huangshan Mountains, similar to the cold outflow centers near the surface (Fig. 5e). The boundary between the cold outflow and the warm southerly airflow at 250 m MSL is quite consistent with that near the surface (Figs. 5e and 7c) and is in a quasi-steady state (Figs. 7a and 7c). Within the basin, the airflow at 250 m MSL is generally colder than that near the surface because of the temperature lapse rate and less accumulated precipitation and cooling near the surface due to a shorter integration of the model.
At 0230 UTC (Fig. 7a), the warm southerly airflow passes the Nanling, Wugong, and Yushan Mountains and converges with the cold outflow roughly along a line from the Jiuling Mountains to the north of the Yushan Mountains (AB in Figs. 7c-f). At 500 m MSL (Fig. 7b), the airflow pattern is similar, while the southerly airflow is stronger than that at 250 m MSL, resulting in clearer convergence forcing where it meets the cold outflow. The strongest convergence forcing is found downstream of the Wugong Mountains at both of the two levels due to strong lee side convergence (Figs. 7a-b).
The airflows at the two levels maintain a quasi-steady pattern over the next 30 min (Figs. 7c-d), except that the southerly airflow becomes slightly warmer and stronger. The stronger southerly airflow strengthens the convergence forcing downstream of the Wugong Mountains, supporting the maintenance of convection along A1B1 on the warm air side of the convergence zone. The convection along A1B1 on the cold air side displays some features of back-building (Figs. 7c and 7e). On the warm air side, two antecedent convective elements advected toward and tended to merge with the cold air side convective group where back-building features appear. This causes the convective group to take on a linear appearance along A2B2 and A3B3. Where the convective lines A4B4 and A5B5 extend southwestward from the convective group, back-building features show most clearly.
It is easy to understand that the western part of the convective group shifts to the south of the cold-warm airflow boundary due to the convection forming on the warm air side since back-building is generally associated with cold-warm airflow interaction along its boundary. In this case, the interaction between the cold and warm airflow is nonuniform. One possible reason for this is that this interaction was modified by the local mountains, as shown in the vertical cross-section roughly along their boundary (Fig. 8a). Also, the interaction was likely affected by the convection on the warm air side. The detailed interaction and the associated back-building processes are shown in vertical cross-sections through the convective lines A1B1-A5B5 in Figs. 8b-f, respectively.
 Figure8. Vertical cross sections through the lines (a) AB, (b) A1B1, (c) A2B2, (d) A3B3, (e) A4B4, and (f) A5B5 in Figs. 7c-f. Shown are temperature (shaded, °C), wind vectors, vertical velocity (blue contours, with contour levels at 0.5, 1, 2, and 5 m s?1), and 45 dBZ radar reflectivity (red contours).
Figure 8a shows the vertical cross-section along AB in Fig. 7c, five updraft branches can be identified where the convective lines A1B1?A5B5 intersect with AB. The warm (cold) air tends to be deeper on the left (right) side of each of the terrain profiles along AB, indicating modification of the cold-warm airflow interaction by the local terrain. Along each of the five convective lines (Figs. 8b-f), successive updrafts are found to be tilting over the cold air side, which is associated with the general structure of the mei-yu front. New convective updrafts feeding the mei-yu front updraft continuously generate near the cold-warm airflow boundary at low levels, clearly demonstrating a back-building structure.
Upstream of the slantwise updrafts along the convective line A1B1 (Fig. 8b), convection forced by the convergence on the lee side of the Wugong Mountains (Figs. 7c-f) produces an apparent downdraft, which enhances the low-level convergence that contributes to the formation of the back-building new updraft. Along the convective line A2B2 (Fig. 8c), upstream convection is induced by low mountains, which is weak and has no obvious effects on the downstream back-building new updraft. In contrast, the upstream convection along the convective line A3B3 (Fig. 8d) is strongly amplified by higher mountains. The amplified convection can produce a downdraft that strengthens the low-level convergence supporting the formation of the back-building new updraft as that along the convective line A1B1. The back-building features along the convective lines A4B4 (Fig. 8e) and A5B5 (Fig. 8f) are clearer since there is no upstream convection. For some of the convective lines encountering the mountains near the cold-warm airflow boundary, the local mountains play a role in the formation of the back-building new updraft, e.g., through upstream lifting (e.g., Figs. 8d, f) or lee side downslope wind convergence (Fig. 8f).
2
4.3. Formation of convective lines during stage II
The processes associated with the formation of the convective lines during stage II are shown in Fig. 9. The development of the convective lines of stage I results in apparent precipitation-forced latent cooling, and the centers of the cold outflow have shifted to the southeastern part of the basin along the Yushan and Wuyi Mountains by 0830 UTC 28 June 2013 (Figs. 9a and 9b). Note the gap between the Yushan and Wuyi Mountains and the valleys among the mountain branches on the northwest side of the Yushan Mountains. The cold outflow first runs into the gap and the valleys, and strong convergence between the cold outflow and the warm southerly airflow is found along the leading edge, which is more clearly shown at 500 m MSL (Fig. 9b). The convergence boundary is followed by several back-building convective lines, indicating that the forcing for back-building comes from the cold-warm airflow interaction associated with terrain modification at low levels.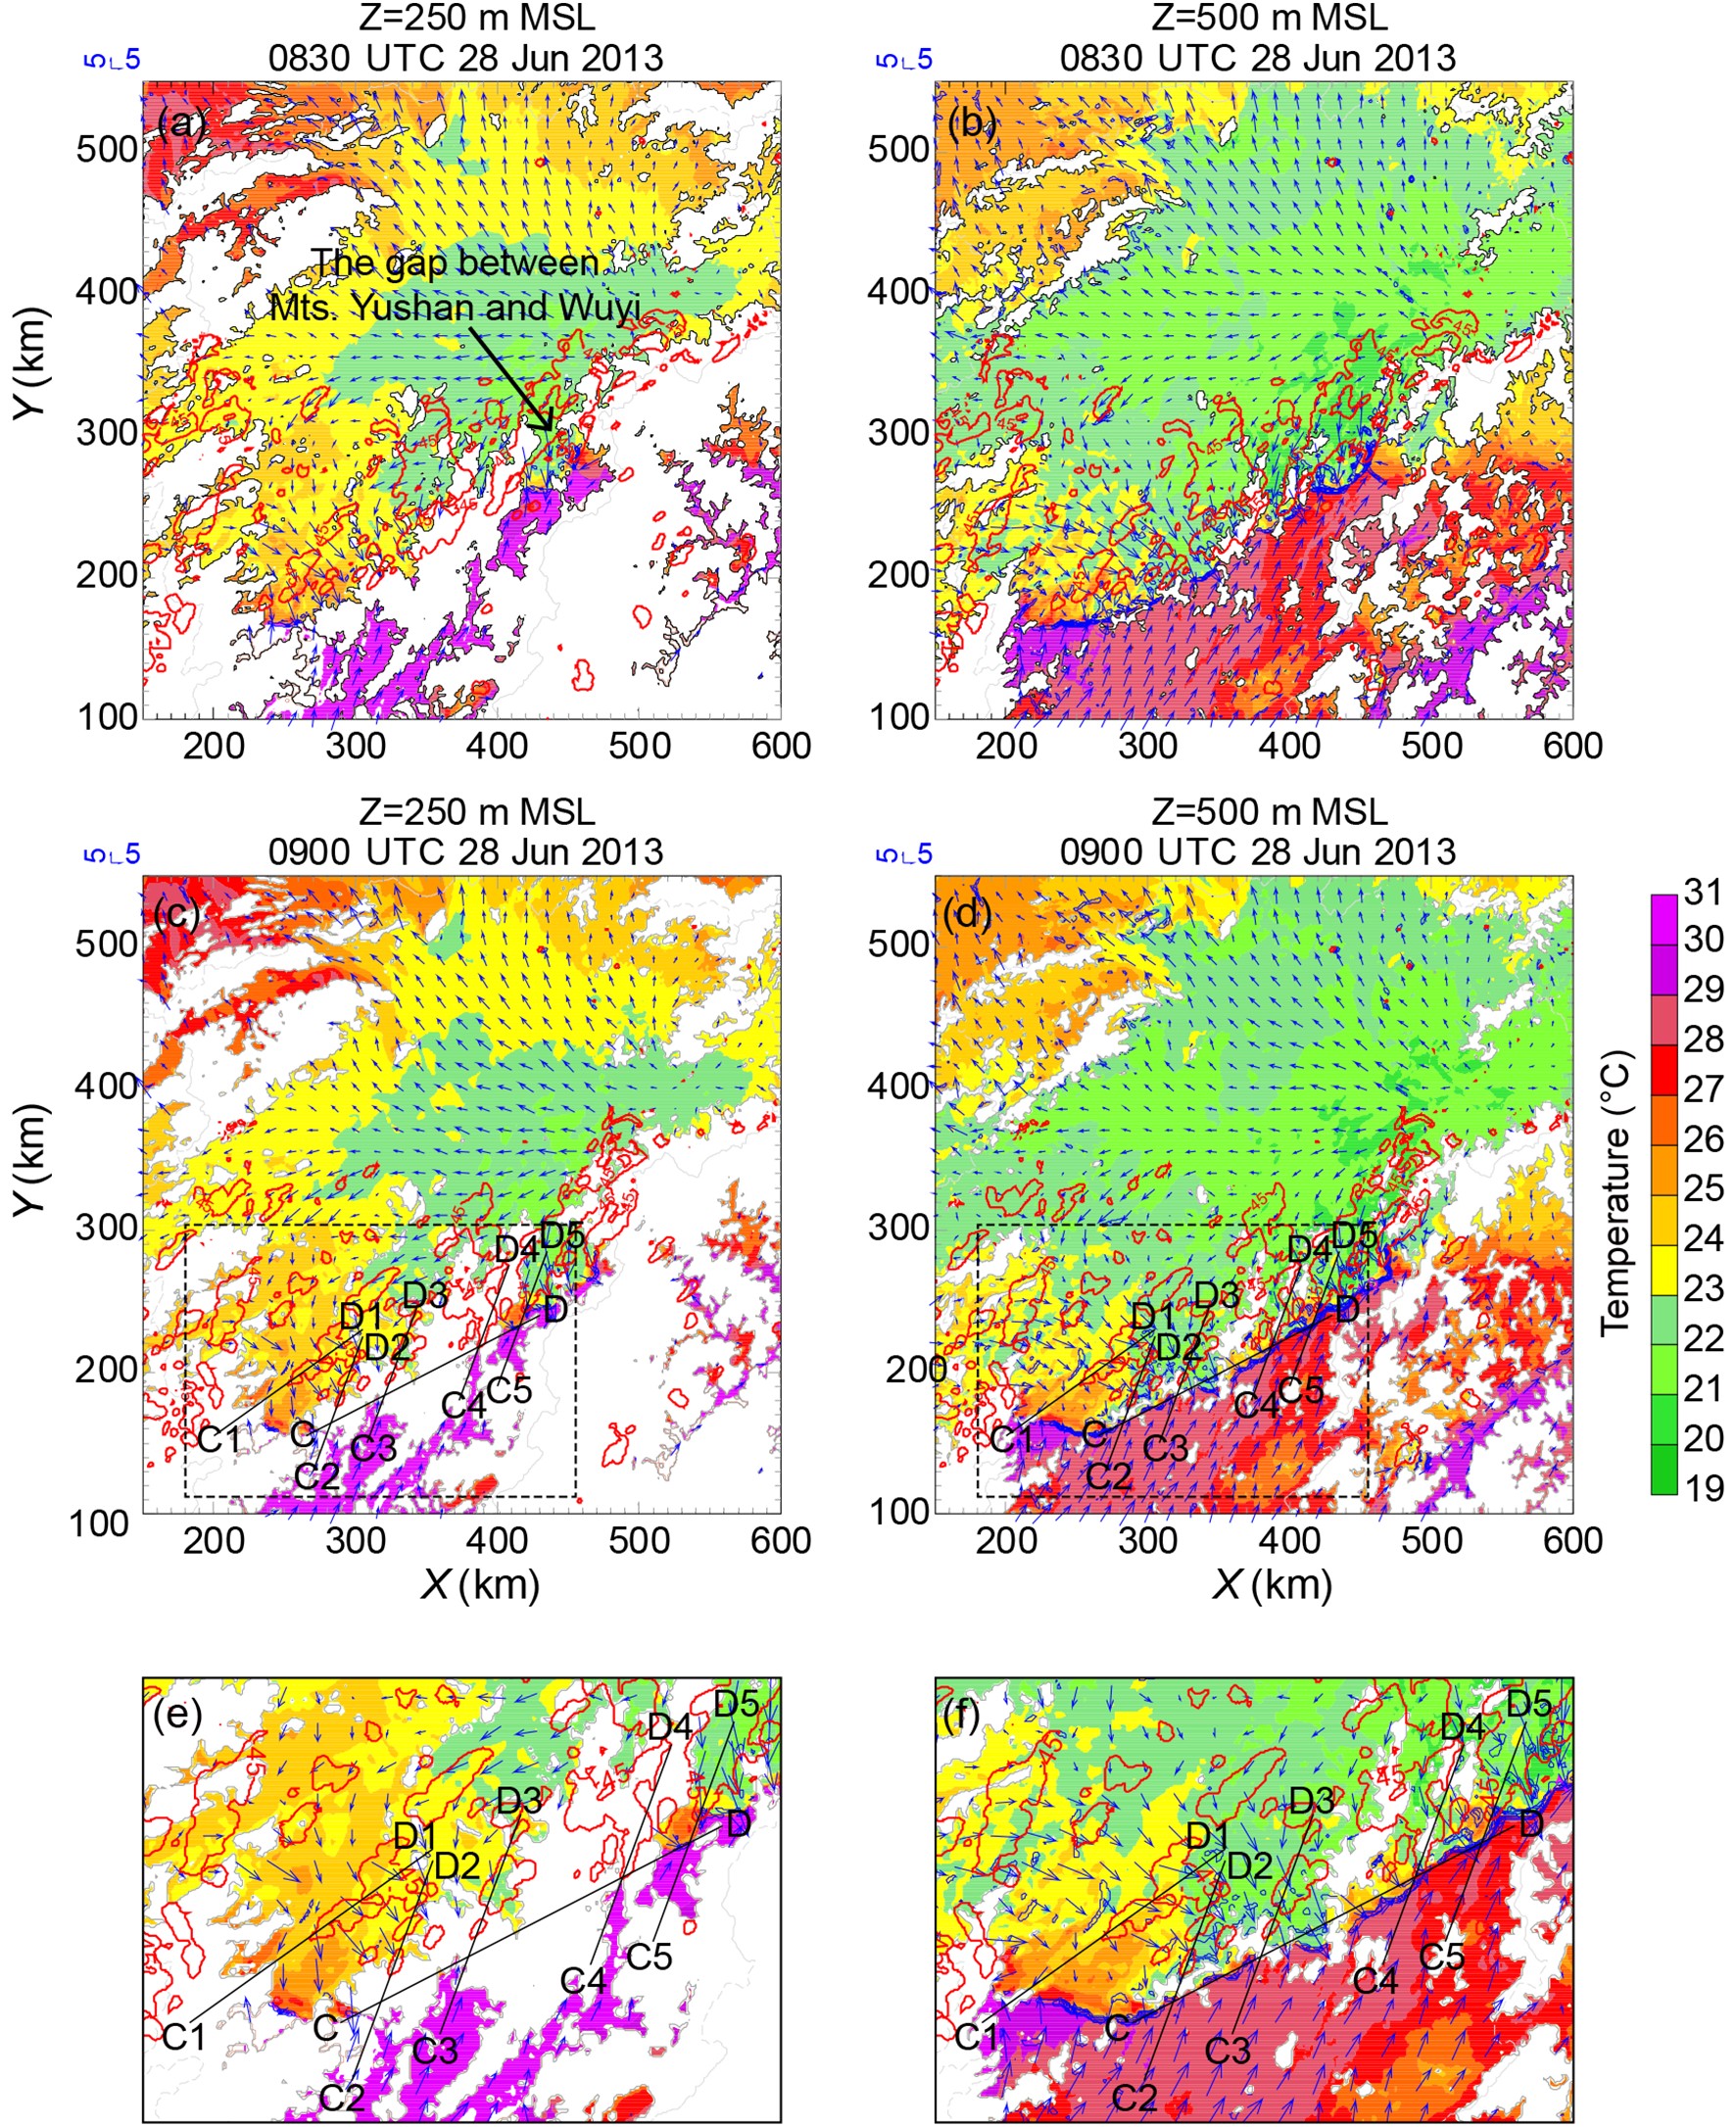 Figure9. The same as in Fig. 7, but for times at (a, b) 0830 and (c, d) 0900 UTC 28 June 2013. The lines in (c) and (d) indicate the position of the vertical cross-sections shown in Fig. 10. The dashed box regions in (c) and (d) are enlarged in (e) and (f), respectively.
The airflows described above maintain a similar interaction pattern for the following 30 min (Figs. 9c-d). During this period, the cold outflow intrusion is quick and strong and results in a stage of clearer back-building at 0900 UTC (Figs. 9c and 9d). The convective group extends southwestward roughly along line CD over the Yushan Mountains. Along the line, the convergence boundary shows a clear wave pattern (Fig. 9f), suggesting modification by the local terrain. Five convective lines are primarily identified. The convective line C1D1 is along the Yushan Mountains and the lee side of the Nanling Mountains. The convective lines C2D2?C4D4 are roughly along the major valleys on the northwest side of the Yushan Mountains, and the convective line C5D5 primarily follows the gap between the Yushan and Wuyi Mountains. Vertical cross-sections along these lines shown in Fig. 10 illustrate the processes resulting in the forcing that supports the back-building.
 Figure10. The same as in Fig. 8, but for vertical cross sections through the lines (a) CD, (b) C1D1, (c) C2D2, (d) C3D3, (e) C4D4, and (f) C5D5 in Figs. 9c-f.
Warm air alternating with cold air along the line CD show nonuniform interaction between the warm southerly airflow and the cold outflow (Fig. 10a), and the associated updrafts can be found roughly where the horizontal gradient of temperature is higher. The updrafts corresponding to the selected convective lines C2D2?C5D5 are near where they intersect with the line CD (Figs. 9c and 9d). For the convective line C1D1 that extends to the lee side of the Nanling Mountains (Fig. 10b), the airflow interaction at low levels and the associated convergence forcing are not strong due to the mountain-reduced southwest airflow on the lee side. Instead of being surface-based, the new updraft is due to the interaction between the mid-level (3?5 km MSL) stronger southerly airflow and the leading convection (Fig. 10b). The back-building new updrafts for convective lines C2D2?C5D5 are all surface-based (Figs. 10c-f), but the sources of forcing are different in detail depending on the cold-warm airflow boundary related to the topography. When the cold outflow has not reached the mountain top (Fig. 10d), the cold-warm airflow convergence provides the forcing for back-building on the near-basin side of the mountain, and the existing convection gains support from the lifting of the cold outflow by the mountain. As the cold outflow just surmounts the mountain top (Fig. 10c), the leading updraft is associated with the convergence between the warm air and a thin near-surface layer of cold downslope outflow and the lifting of the warm southerly airflow by the mountain above. When the leading convection passes the top of the mountain (Fig. 10e), the mountain downslope can enhance the cold outflow associated with the downdraft of the convection, which will strengthen the cold-warm airflow interaction, and thus the leading updraft. Along the gap between the Yushan and Wuyi Mountains (Fig. 10f), the processes are similar to that along convective line C4D4 (Fig. 10e), except the topographic effects can be neglected since the terrain along the gap is much lower.
2
4.4. The role of the mountains within and surrounding the basin
For the formation of the convective lines during stage I, the low mountains along the leading edge of the cold outflow are within the basin. They are discontinuous (Figs. 7c and 8a), and the importance of these low mountains is unclear since some studies show that back-building convective lines can form over flat terrain (e.g., Luo et al., 2013). For the convective line formation of stage II, the mountains ahead of the cold outflow are on the southeast side of the basin and are continuous (Figs. 9c and 10a). The mountains play an important role, as was discussed in section 4.3. The experiment NoMidMts investigates the role of the low mountains within the basin in the formation of stage I convective lines, and the experiment NoNorthMts will examine the role of the mountains on the north side of the basin that probably changes the strength of cold outflow and subsequently the back-building processes.As the control experiment (CNTL), both of the two experiments are initiated at 1200 UTC 27 June 2013 and are integrated until 0000 UTC 29 June 2013. The modified terrain for each of the two experiments is smoothed to avoid integration instability associated with terrain removal that could result in a very sharp terrain profile. The smoothed terrain for the two experiments maintain the primary characteristics of the terrain in the experiment CNTL where they are not modified (Figs. 11 and 12), whereas the modified terrain should alter the processes of the convective line formation associated with different terrain conditions.
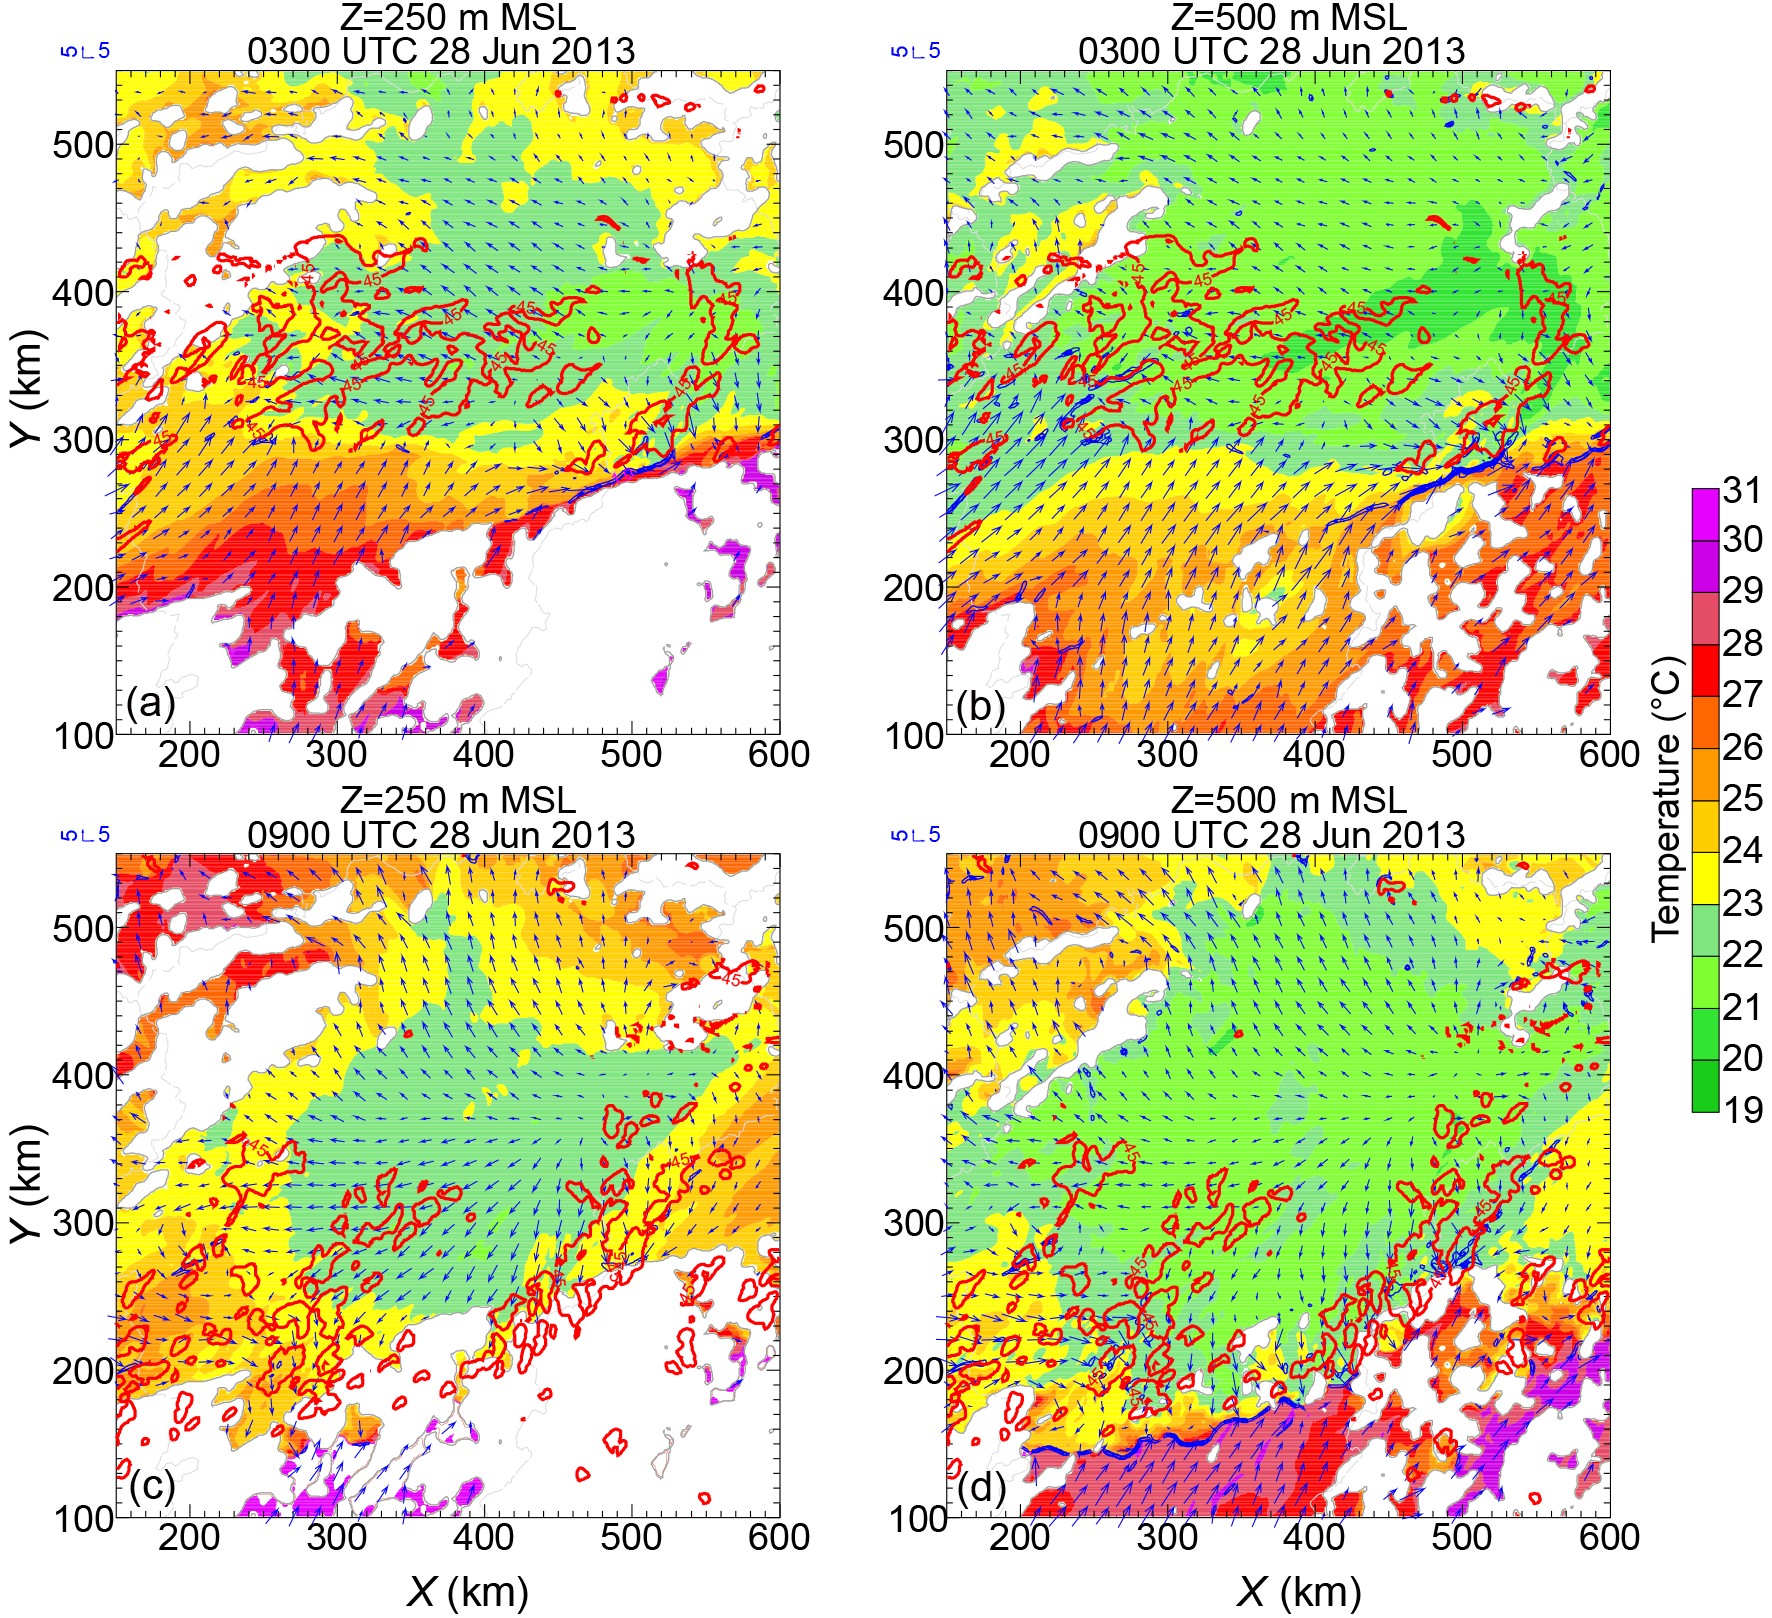 Figure11. Fields shown are the same as in Fig. 7 but for experiment with the mountains within the basin removed (NoMidMts) at times of (a, b) 0300, and (c, d) 0900 UTC 28 June 2013.
 Figure12. Fields shown are the same as in Fig. 7 but for experiment with the mountains on the north side of the basin removed (NoNorthMts) at times of (a, b) 0300, and (c, d) 0900 UTC 28 June 2013.
In the experiment NoMidMts (Fig. 11), the convective group shows line features. Still, the convective line number decreases since the interaction between the cold outflow and the warm southerly airflow becomes less ununiform without being disturbed by the low mountains (Figs. 11a and 11b). In the absence of the Wugong Mountains and the enhanced convergence forcing on its lee side, the convective group is primarily along the cold-warm airflow boundary instead of shifting its western part to the warm side of the boundary as in the experiment CNTL (Figs. 11a and 7c). Some parts of the Yushan and Wuyi Mountains are also removed in the experiment NoMidMts. This makes the cold outflow spreads toward the Yushan and Wuyi Mountains more quickly than that in the experiment CNTL (Figs. 11c-d and 9c-d).
The experiment NoNorthMts shows that the cold outflow over the original basin area becomes broader (Fig. 12), merging with the cold air that should be between the north side of the mei-yu front and the Mufu-Jiuling and Huangshan Mountains in the experiment CNTL (Fig. 1b). The merger more or less enhances the cold outflow over the basin area, whose low-level leading edge by 0300 UTC 28 June 2013 is roughly at y = 300 km (Figs. 12a-b) that is south to the leading edge of the cold outflow in the experiment CNTL (Figs. 7c-f). The convective group in the experiment NoNorthMts forms and develops further southward and later results in a quicker advance of the cold outflow into the Yushan and Wuyi Mountains than that in the experiment CNTL (Figs. 12c-d and 9c-d).
To illustrate the terrain effects on the low-level forcing that contribute to the formation of the convective lines during stage I, the time evolution of key relevant fields along AB in Fig. 7c at 250 m MSL is compared between the CNTL case and the NoMidMts and NoNorthMts experiments in Fig. 13. In the CNTL case (Figs. 13a and 13b), more low-level convergence bands (slash-filled blue contours in Fig. 13a) coupling with lifting forcing (slash-filled blue contours in Fig. 13b) form due to ununiform cold-warm airflow interaction. The terrain around x = 100 km induces warm airflow convergence on the left side and cold outflow convergence on the right side. This results in convergence forcing supporting the development and maintenance of two of the convective lines (dash-filled red contours in Figs. 13a and 13b) later. The right shifting of the convective lines with time clearly shows an eastward “band training” organization of the convective lines, as summarized in Luo et al. (2013). In the NoMidMts experiment (Figs. 13c and 13d), bands of convergence forcing cannot form around x = 100 km where the terrain is removed, and the adjacent convective lines are more intermittent instead of continuous. The cold outflow becomes stronger in the NoNorthMts experiment (Figs. 13e and 13f), and it is clear that the terrain along AB in Fig. 7c still helps to maintain warm airflow convergence on its left side and cold outflow convergence lifting on its right side. This confirms that the low mountains along the cold-warm airflow boundary increase the non-uniformity of the cold-warm airflow interaction by inducing long-lasting low-level convergence forcing that favors the formation of back-building convective lines.
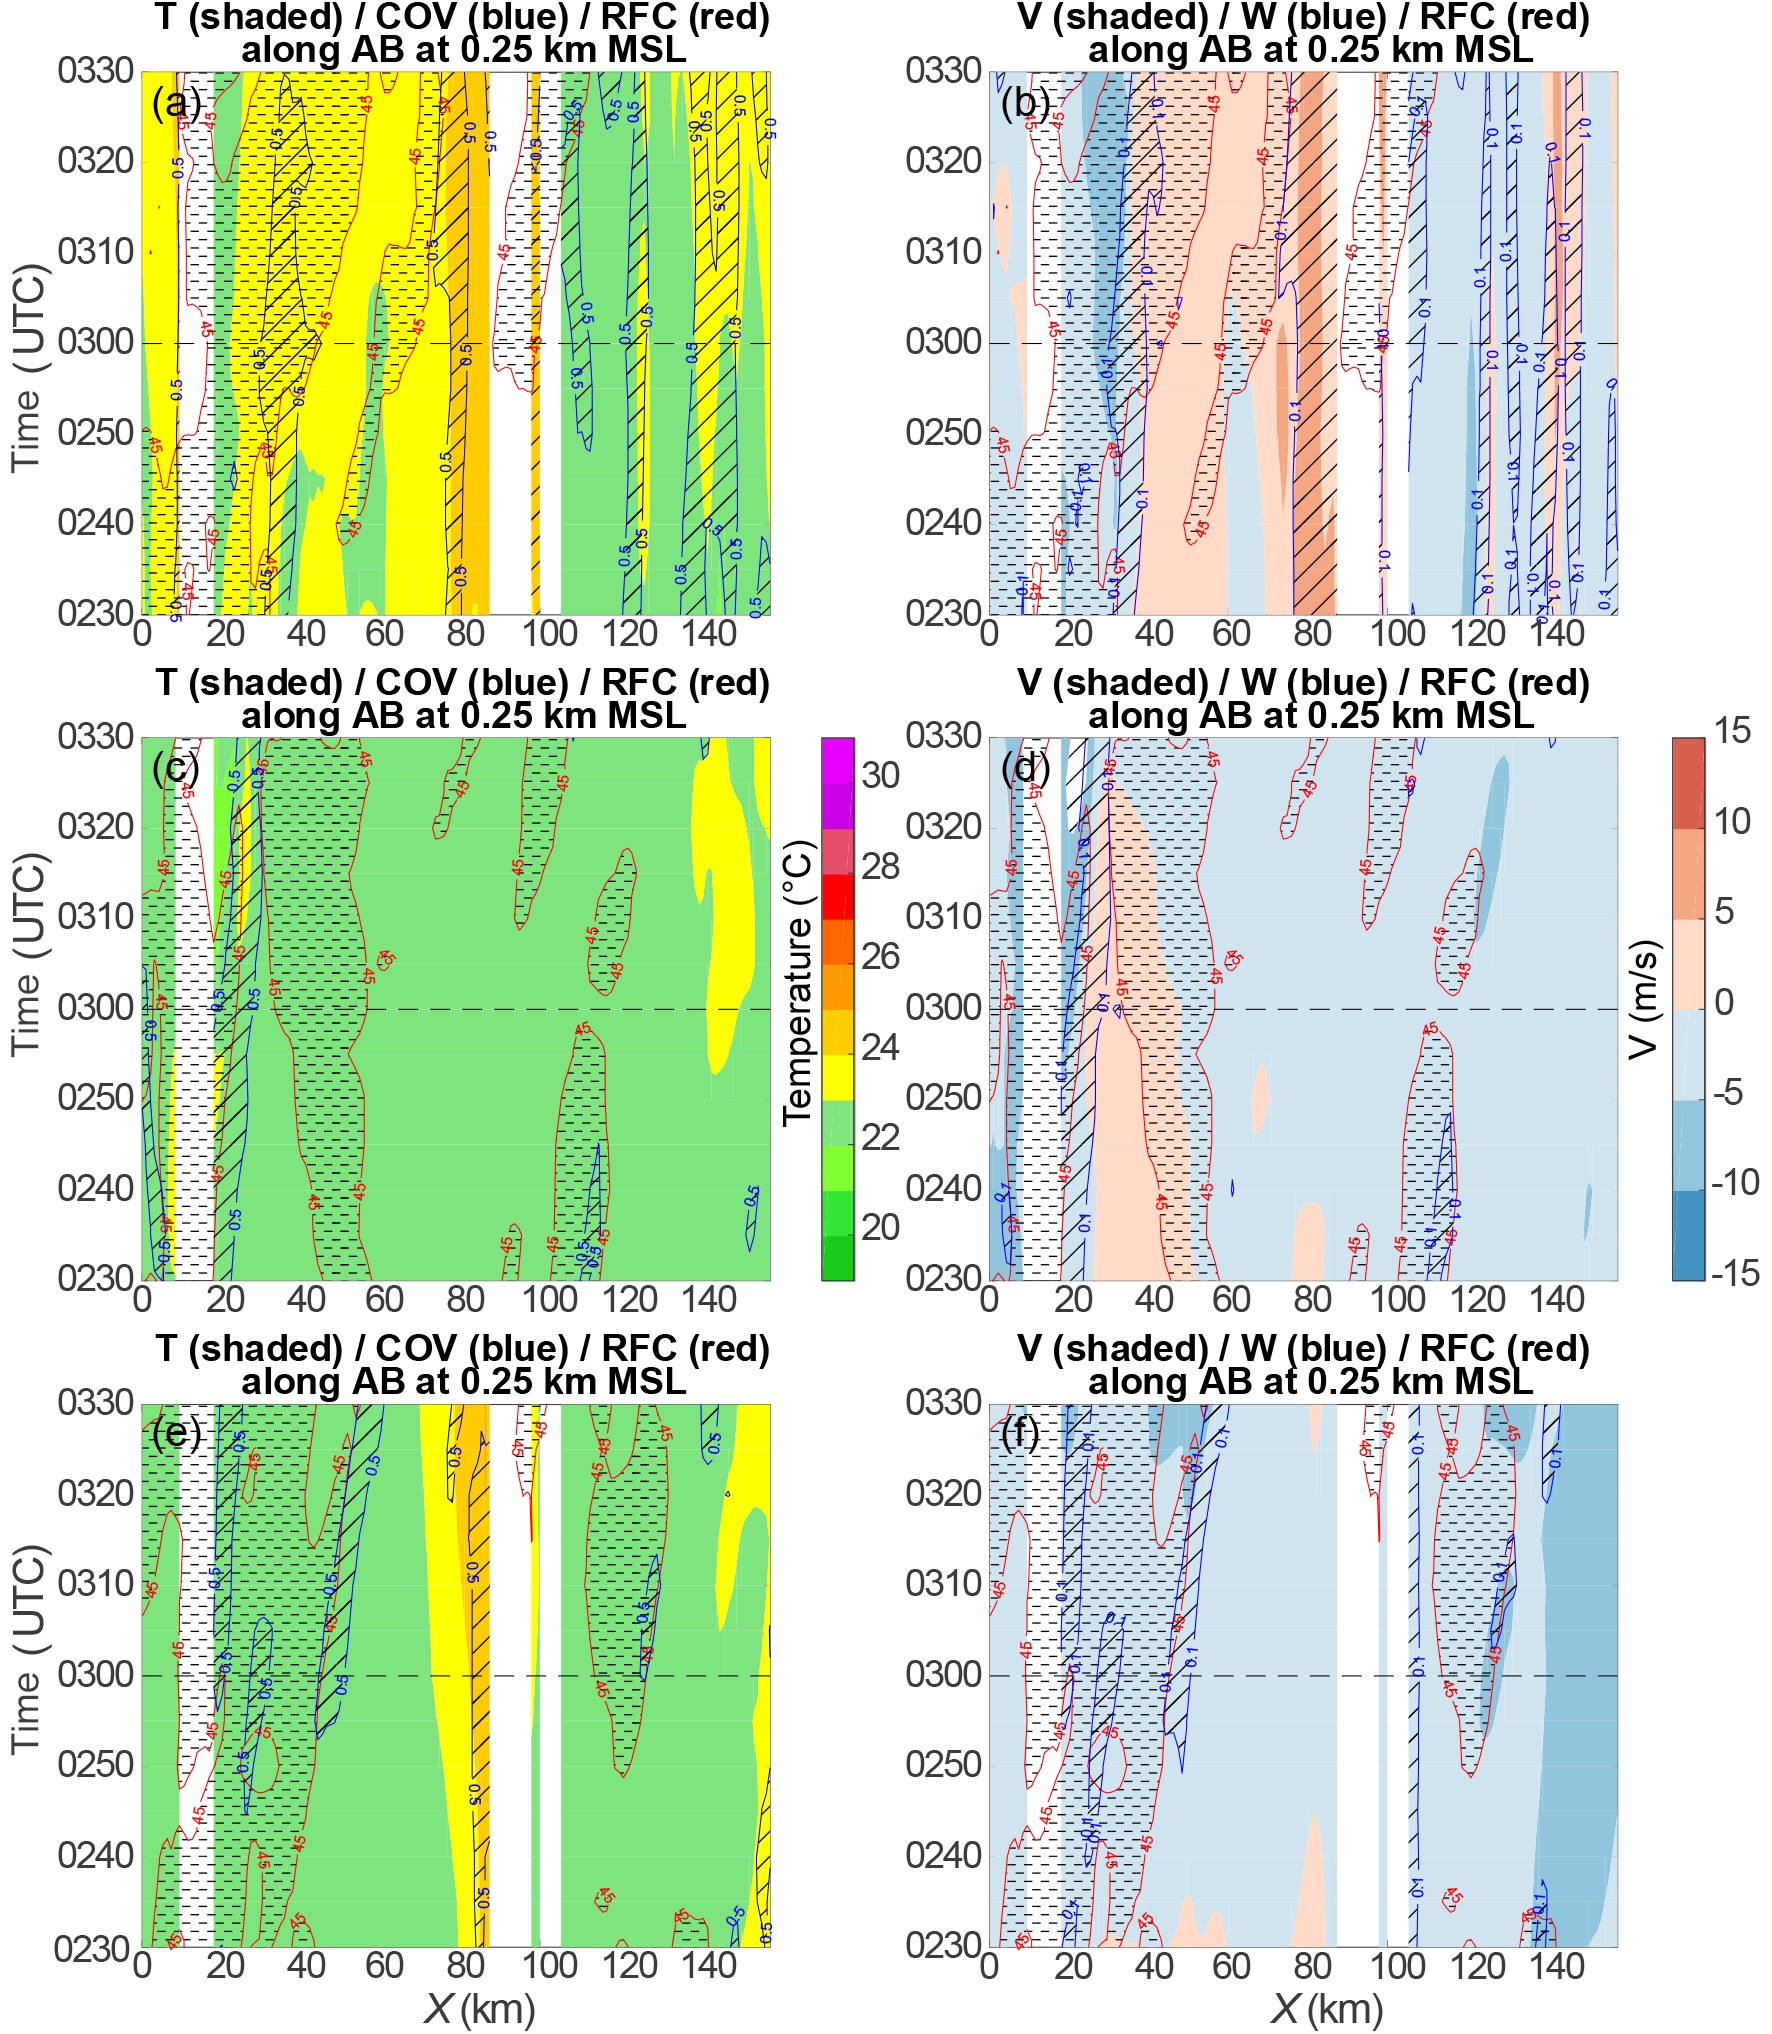 Figure13. Time evolution of (a) temperature (shaded) and convergence (blue contours, > 0.5×10?3 s?1 filled with slashes), or (b) cross-line horizontal wind speed (shaded) and vertical velocity (blue contours, > 0.1 m s?1 filled with slashes) during stage I along line AB in Fig. 7c at 0.25 km MSL. The same as (a) and (b), respectively, (c) and (d) are for experiment NoMidMts, and (e) and (f) are for experiment NoNorthMts. The 45 dBZ composite radar reflectivity shown as red contours filled with dashed lines outline the convective lines.
The time evolution of the same fields along CD in Fig. 9d at 500 m MSL is shown in Fig. 14 to illustrate the low-level forcing associated with terrain effects that contribute to the formation of the convective lines during stage II. In the CNTL case (Figs. 14a and 14b), the convergence lifting forcing starts where the cold outflow meets the warm southerly airflow. The wavy boundary of cold-warm airflow interaction is primarily controlled by the mountain tops and valleys along CD (Fig. 10a). Several convective lines originate from some of the convergence forcing, and their maintenance along CD indicates continuous back-building that supports the formation of some of the convective lines shown in Figs. 9c-d. Note not all the convective lines in Figs. 9c-d have corresponding RFC field in Figs. 14a-b because the line CD is roughly through the cold-warm airflow boundary instead of crossing the leading parts of all the convective lines. As with the organization of the convective lines during stage I, the northeastward “band training” along CD is clear during this stage. Similar features exist in the NoMidMts (Figs. 14c and 14d) and NoNorthMts (Figs. 14e and 14f) experiments. However, the cold-warm airflow interaction near the line CD occurs about 1 hour earlier due to quicker development of the stronger cold outflow in the two experiments, as discussed above. The terrain plays a controlling role in the convective line formation during stage II.
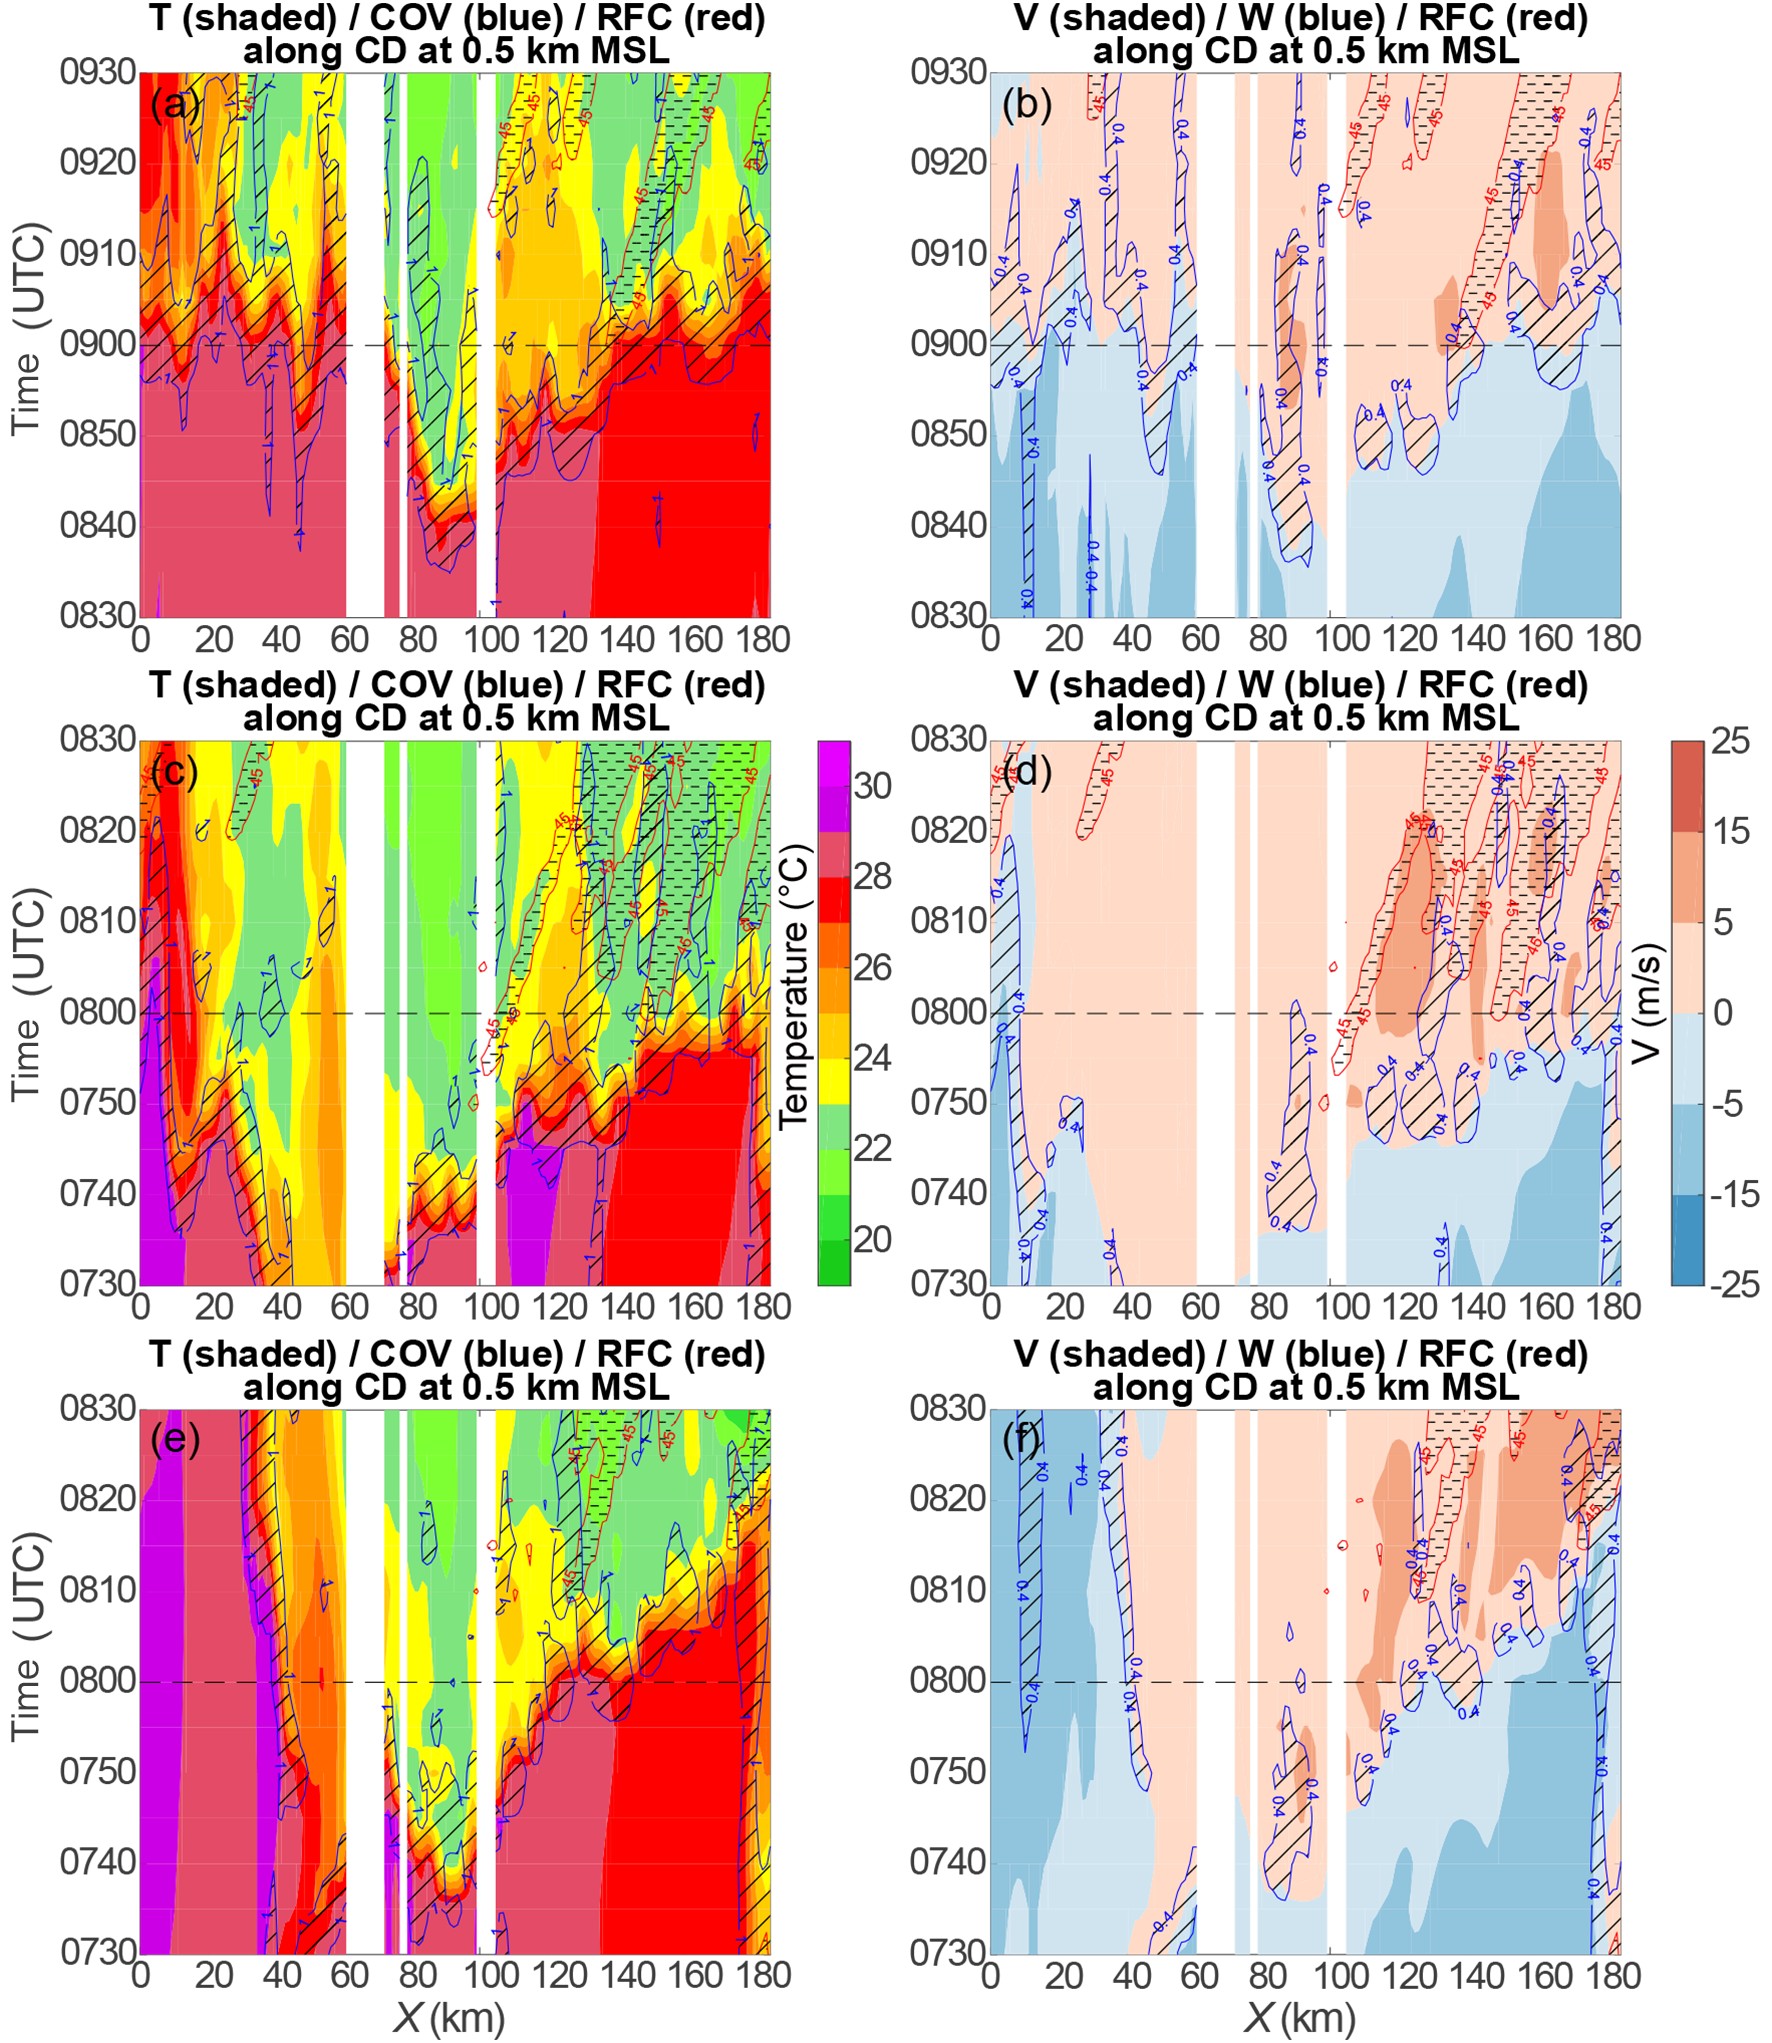 Figure14. The same as Fig. 13, but during stage II, along line CD in Figs. 9c at 0.5 km MSL. The initiation of convective lines in (c?d) and (e?f) is about 1 hour earlier than that in (a?b).
The two stages of convective line formation are associated with the interaction between the warm southerly airflow ahead of the mei-yu front and the cold outflow induced by the mei-yu front mesoscale convective systems (MCSs) evolving over a basin surrounded by the Wuyi, Yushan, Wugong, Jiuling, Mufu, Dabie, and Huangshan Mountains. The mountains within and on the southeast side of the basin play important roles during the two stages of convective line formation, respectively, which is summarized in a conceptual model, as illustrated in Fig. 15.
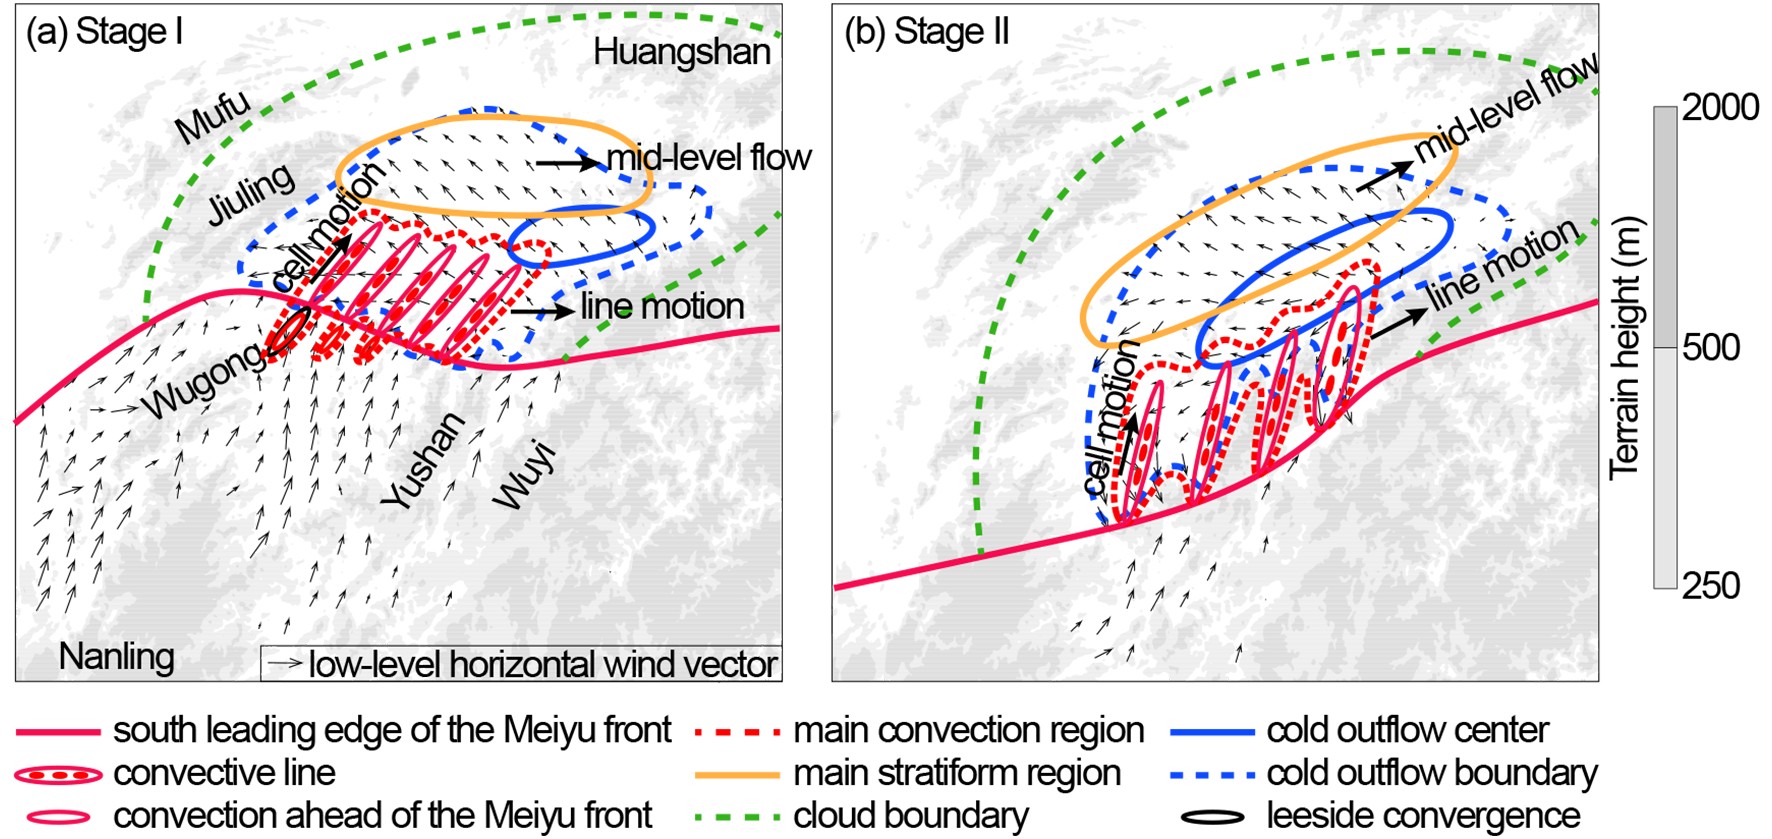 Figure15. The conceptual model of convective line formation during (a) stage I and (b) stage II. The warm southerly airflow boundary or the south leading edge of the mei-yu front, the cold outflow center, and the cold outflow boundary are shown as red bold, blue, and blue-dashed lines, respectively. The main convection region, the main stratiform region, and the cloud boundary are outlined with red-dashed, orange, and green-dashed lines, respectively. Red ellipses embedded with small ovals indicate the convective lines, with a wider one denoting a stronger convective line. Small red ellipses represent the convection ahead of the mei-yu front. The motion of the convective cells along the convective line and the motion of the convective lines primarily following the mid-level flow are denoted with bold arrows. Terrain height is shaded, and the main mountains are labeled in (a). Important low-level wind vectors are shown, and the black ellipse in (a) indicate a sustained low-level convergence on the lee side of the Wugong Mountains.
During stage I (Fig. 15a), the warm southerly airflow passes the Nanling, Wugong, and Yushan Mountains and meets the cold outflow within the basin. A convection region initiates from the cold-warm air boundary (or the leading edge of the mei-yu front). It is followed by a main stratiform region within a broad cloud sector covering the basin. The cold outflow within the basin is primarily due to precipitation-forced cooling associated with MCSs that propagated along the mei-yu front from the Mufu-Jiuling Mountains while it was prevented by the Wuyi and Huangshan Mountains on the east side of the basin earlier. The cold outflow center is between the Wuyi and Huangshan Mountains, where the accumulated precipitation is larger. The low-level cold outflow spreads from the cold outflow center and interacts with the warm southerly airflow nonuniformly along the leading edge of the mei-yu front. The low mountains along the leading edge of the mei-yu front can increase the non-uniformity of the interaction. Back-building processes continuously occur where the interaction is stronger along the quasi-steady leading edge of the mei-yu front and supports the formation and maintenance of the convective lines. Also, low-level convergence forcing due to interaction between the mountains and the warm southerly airflow induces several convective pieces ahead of the mei-yu front, especially the convergence forcing to the lee side of the Wugong Mountains. The convective elements are found in line with and approaching some of the convective lines. The associated downdrafts were shown to have played a role in enhancing the back-building processes near the leading edge of the mei-yu front. For each of the convective lines, the cell motion is along the convective line. In contrast, the motion of the convective lines is primarily consistent with the mid-level west-eastward flow associated with the front.
The development and eastward propagation of the convective lines formed during stage I results in new precipitation-forced cooling that strengthens the cold outflow. The cold outflow center becomes broad and extends southwestward along the southeast side of the basin, resulting in a sharp southwest shift of the convection region, the stratiform region, and the cloud sector (Fig. 15b). The strong cold outflow intrudes into the valleys on the northwest side of the Yushan Mountains and the gap between the Yushan and Wuyi Mountains and pushes the warm airflow southward. Convective lines form along the main valleys and the gap, with the convective line along the gap being stronger since the gap is broader than the valleys, and the intrusion of the cold outflow into the gap is more intense. The gap plays a role in accelerating the cold outflow and thus to enhance its interaction with the warm southerly airflow. The valleys can induce additional forcing through confluence and uplifting or downslope flow to enhance the cold-warm airflow interaction. These result in a controlling role of the terrain in the formation of the convective lines during stage II. During this stage, the cell motion is also along each of the convective lines, and the motion of the convective lines is still primarily consistent with the mid-level flow associated with the front, which has changed to be southwest-northeastward.
This conceptual model contains a broad stratiform region and is different from the schematic diagram of the quasi-linear-shaped MCS in Luo et al. (2013), in which the stratiform rainfall is insignificant. The conceptual model appears to be similar to that of the MCS climatology with training line and adjoining stratiform in North America (Schumacher and Johnson, 2005) in terms of the stratiform region, but differs in terms of the causes for the formation of the convective lines and the motion of the echo training. The echo training along the convective lines is similar to that of the back-building MCS in Schumacher and Johnson (2005) and Luo et al. (2013). More importantly, the mountains play significant roles in the conceptual model. Sensitivity experiments confirm the modification role of the low mountains within the basin during stage I and the controlling role of the Yushan and Wuyi Mountains on the southeast side of the basin during stage II of the convective line formation. Knowledge of the effects of the mountains on the convective line formation is helpful for the understanding and prediction of heavy precipitation events over the basin region during the mei-yu season in China.
Acknowledgements. This work was primarily supported by the National Key R&D Program of China (Grant No. 2017YFC1501603), the Major Research Plan of the National Natural Science Foundation of China (Grant No. 91937301), and the National Natural Science Foundation of China (Grant Nos. 41775054, 41375061 and 40705019). The NCEP reanalysis data used to reproduce the weather background and to initialize the simulations were downloaded from the NCAR Data Archive. The infrared brightness temperature data used to show the cloud clusters were obtained from the satellite data archive for research and education at
