 , 耿修瑞1,2
 1. 中国科学院空天信息创新研究院 中国科学院空间信息处理与应用系统技术重点实验室, 北京 100094;
2. 中国科学院大学, 北京 100049
2019年10月29日 收稿; 2020年3月27日 收修改稿
基金项目: 国防科工局高分重大专项(06-Y20A17-9001-17/18,30-Y20A15-9003-17/18,30-Y20A28-9004-15/17)和国家自然科学基金委重大科研仪器研制项目(41427805)资助
通信作者: 计璐艳, E-mail: jily@mail.ustc.edu.cn
摘要: 随着遥感技术的快速发展,遥感图像得到广泛的应用,其中目标检测是遥感图像众多应用中非常重要的一个分支。目前大多数目标检测算法都是基于单时相遥感图像,对于多时相遥感数据的处理方法较少。最近发表的多时相目标检测算法有滤波张量分析,其将多重线性函数与张量相对应的关系应用于遥感图像目标检测,但该算法只能进行单目标检测,无法同时检测多个目标。本文借鉴多目标约束能量最小化算法中对于多个目标输出能量的约束和滤波张量分析中对于应用张量滤波器的思想,提出多目标滤波张量分析算法,能够在多时相遥感数据中实现同时检测多个目标。模拟和真实数据实验结果均表明,该算法可以有效地提高多时相图像中多目标检测精度。
关键词: 多目标检测多时相滤波张量分析约束能量最小化遥感图像
An algorithm for multi-target detection in multi-temporal remote sensing images
XI Yanxin1,2, JI Luyan1

 , GENG Xiurui1,2
 1. Key Laboratory of Technology in Geospatial Information Processing and Application System of CAS, Aerospace Information Research Institute, Chinese Academy of Sciences, Beijing 100094, China;
2. University of Chinese Academy of Sciences, Beijing 100049, China
Abstract: With the rapid development of remote sensing technology, the remote sensing data become valuable in many practical applications. Among them, target detection has always been an important topic. However, most of the target detection algorithms in remote sensing images merely concentrate on single-temporal data, and there are few algorithms for multi-temporal data. In the field of target detection in multi-temporal remote sensing data, filter tensor analysis (FTA) has achieved great success which outperforms other target detection algorithms for single-temporal data. Yet FTA is designed only for single target detection, which means it can not meet the need for practical applications in circumstances where it has to detect more than one target simultaneously. So, in this paper, a modified algorithm for multi-target detection in multi-temporal data has been proposed based on the target constraints in multiple target constrained energy minimization and the tensor filter in FTA. Both the experiment results on simulation data and real remote sensing data from Landsat 8 prove that the algorithm proposed in this paper can effectively detect several targets in multi-temporal data.
Keywords: multi-target detectionmulti-temporalfilter tensor analysisconstrained energy minimizationremote sensing data
在遥感领域,目标检测一直是重要的研究方向,其在军用及民用项目上,均有着重要作用,如伪装目标检测、灾情控制、土地规划、城区监控以及目标跟踪等[1-3]。在高/多光谱图像目标检测中,目标和背景的光谱差异,是目标能够被有效检测的物理依据。
理论上来看,遥感图像目标检测实际上是一个二分问题:将像元标记为目标或者背景。经过多年的发展,该领域提出了很多关于高/多光谱图像目标检测算法[4],其中大部分都是在压制背景信息的基础上,突出目标,如1)基于概率统计模型的检测方法:匹配滤波(matched filter,MF)算法[4]、自适应余弦估计(adaptive cosine estimator,ACE)算法[5]、约束能量最小化(constrained energy minimization, CEM)算法[6]和“慧眼”(clever eye,CE)算法[7];2)基于光谱间相似性度量:光谱角度填图(spectral angle mapping,SAM)算法[8];3)基于子空间模型的检测算法:正交子空间投影(orthogonal subspace projection,OSP)算法[9-10]。
虽然以上这些方法取得了令人瞩目的成就并得到广泛应用,但都是基于单时相的遥感图像,没有有效利用遥感图像时间维信息。而目前研究表明,多时相遥感数据对地物目标分类和探测能够起到十分重要的作用,如基于多时相红外图像的浅层地下目标探测应用[11];使用多时相SPOT-4植被传感器数据的中国东北森林的分类[12];基于MODIS NDVI数据的土地利用/覆盖分类及变化检测[13];基于多时相MODIS图像的中国南部的水稻田分布检测[14]和基于多时相遥感数据及景观指标的地表分类和变化检测[15]等。在高/多光谱目标探测领域,Geng等[16]提出基于多重线性函数的多时相目标检测方法——滤波张量分析(filter tensor analysis,FTA),其利用不同时相的遥感图像作为输入来检测目标,提高检测精度。从机理上讲,多时相的目标检测方法,因为使用多个时相的光谱特征,所以相当于对目标特征维度的增长。多时相的数据相比于单时相,因为其特征维度的增加,所以更具有可分性,因此对于一些在单个时相上难以区分的光谱,通过其加长的特征维度,可以实现更准确的分类。所以本质上多时相目标检测方法就是通过增加目标的特征维度以更好地区分目标和背景。
上述目标检测算法均只能检测单个类型的目标(简称为“单目标”),但如果单个目标的光谱出现变化、同种目标的光谱不完全一致或多个目标光谱差异较大时,单目标检测算法的效果将会变差,在实际应用中效果不佳。为在一幅遥感图像中同时检测多个目标光谱,Ren等[17]在CEM的基础上,提出多目标约束能量最小化(multiple target CEM,MTCEM),使得CEM的输入目标增加为多个;此外,多目标探测算法还包括加和约束能量最小化(sum CEM, SCEM)[17]和胜者全赢约束能量最小化(winner-take-all CEM,WTACEM)算法[17]。在此基础上,尹继豪等[18]对上述3种多目标检测算法进行改进,修正原有算法中的自相关矩阵,减少目标向量对自相关矩阵的影响,如修正的多目标约束能量最小化(revised MTCEM,RMTCEM)算法使用修正的自相关矩阵代替原有的自相关矩阵。但从时相角度来看,以上算法都是基于单时相遥感图像的算法,无法解决多时相问题。
因此本文在FTA的基础上,通过引入多目标形式,从FTA推导出多时相高/多光谱数据的多目标检测算法,以解决高/多光谱的多时相、多目标检测问题。
1 背景介绍本节介绍基于多时相数据的目标检测算法FTA[16]。
若X(t)={r1(t), r2(t), …, rN(t)}表示在时刻t(t=1, 2, …, M, 其中M表示总的时相数目,且M≥1)的遥感数据,N表示总的像元数目,并且每个时相对应的波段数目是L1, L2, …, LM。对于不同的时相,像元的总数需要相等,但是波段数目L1, L2, …, LM可不等。对于第i个像元,它由M个向量组成,记作ri(1), ri(2), …, ri(M)。对于一个给定的目标,它由M个向量组成,记为d(1), d(2), …, d(M),则存在一个M阶的张量滤波器W(L1×L2×…×LM维),在目标的输出能量恒定为1的情况下最小化滤波器输出能量,可以描述如下:
| $\left\{\begin{array}{l}\min \limits_{\boldsymbol{W}} \frac{1}{N} \sum\limits_{i}\left(\boldsymbol{W} \times{ }_{1} \boldsymbol{r}_{i}^{(1)} \times{ }_{2} \boldsymbol{r}_{i}^{(2)} \cdots \times{ }_{M} \boldsymbol{r}_{i}^{(M)}\right)^{2} \\\text { s.t. } \boldsymbol{W} \times{ }_{1} \boldsymbol{d}^{(1)} \times{ }_{2} \boldsymbol{d}^{(2)} \cdots \times{ }_{M} \boldsymbol{d}^{(M)}=\mathit{\pmb{1}}\end{array}\right.,$ | (1) |
| $\begin{gathered}\boldsymbol{W} \times{ }_{1} \boldsymbol{r}_{i}^{(1)} \times{ }_{2} \boldsymbol{r}_{i}^{(2)} \cdots \times_{M} \boldsymbol{r}_{i}^{(M)}= \\\left(\boldsymbol{r}_{i}^{(M)} \otimes \boldsymbol{r}_{i}^{(M-1)} \otimes \cdots \otimes \boldsymbol{r}_{i}^{(1)}\right)^{\mathrm{T}} \operatorname{vec}(\boldsymbol{W}),\end{gathered}$ | (2) |
| $\begin{array}{c}\boldsymbol{W} \times{ }_{1} \boldsymbol{d}^{(1)} \times{ }_{2} \boldsymbol{d}^{(2)} \cdots \times{ }_{M} \boldsymbol{d}^{(M)}=\\\left(\boldsymbol{d}^{(M)}\right.\left.\otimes \boldsymbol{d}^{(M-1)}\otimes \cdots \otimes \boldsymbol{d}^{(1)}\right)^{\mathrm{T}} \operatorname{vec}(\boldsymbol{W}),\end{array}$ | (3) |
| $\left\{\begin{array}{l}\min \limits_{\hat{\boldsymbol{w}}} \hat{\boldsymbol{w}}^{\mathrm{T}} \hat{\boldsymbol{R}} \hat{\boldsymbol{w}} \\\text { s.t. } \hat{\boldsymbol{d}}^{\mathrm{T}} \hat{\boldsymbol{w}}=\mathit{\pmb{1}}\end{array}\right..$ | (4) |
| $\hat{\boldsymbol{w}}_{\mathrm{FTA}}=\frac{\hat{\boldsymbol{R}}^{-1} \hat{\boldsymbol{d}}}{\hat{\boldsymbol{d}}^{\mathrm{T}} \hat{\boldsymbol{R}}^{-1} \hat{\boldsymbol{d}}}.$ | (5) |
2 多时相多目标检测算法上一节介绍的FTA在相关性比较低的多时相图像中单目标检测效果良好,但是实际应用中,目标光谱通常会有变化。在大多数高/多光谱图像中,存在多个目标情况或者目标本身的光谱曲线会因为传感器或光照等发生变化,不同区域的同一个目标会有不同的光谱。但是FTA无法适用于上述情况,因此需要多目标的检测算法来解决这个问题。本节以多目标替换单目标的方式,提出多时相多目标检测算法(multiple target FTA,MTFTA)。
设图像总共有M个时相,包含q个感兴趣目标,那么对于任何一个给定的目标di(i=1, 2, …, q, q≥1),它由M个向量组成,记为{di(1), di(2), …, di(M)},则式(1)变为
| $\left\{\begin{array}{l}\min \limits_{\boldsymbol{W}} \frac{1}{N} \sum\limits_{i}\left(\boldsymbol{W} \times_{1} \boldsymbol{r}_{i}^{(1)} \times{ }_{2} \boldsymbol{r}_{i}^{(2)} \cdots \times{ }_{M} \boldsymbol{r}_{i}^{(M)}\right)^{2} \\\text { s.t. }\ \boldsymbol{W} \times{ }_{1} \boldsymbol{d}_{1}^{(1)} \times{ }_{2} \boldsymbol{d}_{1}^{(2)} \cdots \times{ }_{M} \boldsymbol{d}_{1}^{(M)}=\mathit{\pmb{1}} \\\ \ \ \ \ \ \ \ \boldsymbol{W} \times{ }_{1} \boldsymbol{d}_{2}^{(1)} \times{ }_{2} \boldsymbol{d}_{2}^{(2)} \cdots \times{ }_{M} \boldsymbol{d}_{2}^{(M)}=\mathit{\pmb{1}} \\\ \ \ \ \ \ \ \ \ \ \ \ \ \ \ \ \ \ \ \ \ \ \ \ \ \ \ \ \ \ \ \ \ \ \vdots \\\ \ \ \ \ \ \ \ \boldsymbol{W} \times{ }_{1} \boldsymbol{d}_{q}^{(1)} \times{ }_{2} \boldsymbol{d}_{q}^{(2)} \cdots \times{ }_{M} \boldsymbol{d}_{q}^{(M)}=\mathit{\pmb{1}}\end{array},\right.$ | (6) |
| $\begin{gathered}\boldsymbol{W} \times{ }_{1} \boldsymbol{d}_{i}^{(1)} \times{ }_{2} \boldsymbol{d}_{i}^{(2)} \cdots \times{ }_{M} \boldsymbol{d}_{i}^{(M)}= \\\left(\boldsymbol{d}_{i}^{(M)} \otimes \boldsymbol{d}_{i}^{(M-1)} \otimes \cdots \otimes \boldsymbol{d}_{i}^{(1)}\right)^{\mathrm{T}} \operatorname{vec}(\boldsymbol{W}),\end{gathered}$ | (7) |
| $\left\{\begin{array}{l}\min \limits_{\hat{\boldsymbol{w}}} \hat{\boldsymbol{w}}^{\mathrm{T}} \hat{\boldsymbol{R}} \hat{\boldsymbol{w}} \\\text { s. t. }\ \hat{\boldsymbol{d}}_{1}^{\mathrm{T}} \hat{\boldsymbol{w}}=\mathit{\pmb{1}} \\\ \ \ \ \ \ \ \ \ \hat{\boldsymbol{d}}_{2}^{\mathrm{T}} \hat{\boldsymbol{w}}=\mathit{\pmb{1}} \\\ \ \ \ \ \ \ \ \ \ \ \ \ \ \ \ \ \ \vdots \\\ \ \ \ \ \ \ \ \ \hat{\boldsymbol{d}}_{q}^{\mathrm{T}} \hat{\boldsymbol{w}}=\mathit{\pmb{1}}\end{array}\right.,$ | (8) |
| $\left\{\begin{array}{l}\min \limits_{\hat{\boldsymbol{w}}} \hat{\boldsymbol{w}}^{\mathrm{T}} \hat{\boldsymbol{R}} \hat{\boldsymbol{w}} \\\text { s. t. } \hat{\boldsymbol{D}}^{\mathrm{T}} \hat{\boldsymbol{w}}=\mathit{\pmb{1}}\end{array}\right.,$ | (9) |
| $\hat{\boldsymbol{w}}_{\text {MTFTA }}=\hat{\boldsymbol{R}}^{-1} \hat{\boldsymbol{D}}\left(\hat{\boldsymbol{D}}^{\mathrm{T}} \hat{\boldsymbol{R}}^{-1} \hat{\boldsymbol{D}}\right)^{-1} \mathit{\pmb{1}},$ | (10) |
| $\begin{aligned}\operatorname{MTFTA}(\boldsymbol{r}) &=\hat{\boldsymbol{w}}_{\mathrm{MTFTA}}^{\mathrm{T}} \boldsymbol{r} \\&=\left(\hat{\boldsymbol{R}}^{-1} \hat{\boldsymbol{D}}\left(\hat{\boldsymbol{D}}^{\mathrm{T}} \hat{\boldsymbol{R}}^{-1} \hat{\boldsymbol{D}}\right)^{-1} \mathit{\pmb{1}}\right)^{\mathrm{T}} \boldsymbol{r} .\end{aligned}$ | (11) |
Table 1
| 表 1 二分类的混淆矩阵Table 1 Confusion matrix of binary classification | |||||||||||||
| $\mathrm{OA}=\frac{T_{\mathrm{P}}+T_{\mathrm{N}}}{T_{\mathrm{P}}+F_{\mathrm{P}}+F_{\mathrm{N}}+T_{\mathrm{N}}},$ | (12) |
| $\text { F-score }=\left(1+\beta^{2}\right) \cdot \frac{\text { precision } \cdot \text { recall }}{\beta^{2} \times \text { precision }+\text { recall }},$ | (13) |
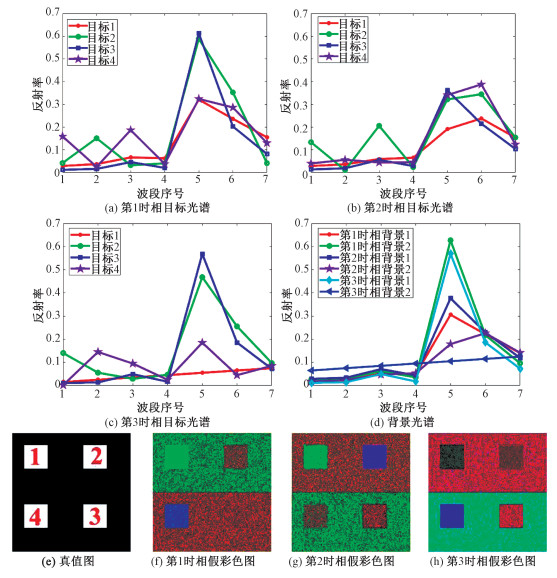
3.1 模拟数据实验在模拟实验中,模拟3个时相的多光谱图像,每个图像有7个波段,每个时相的图像大小为200像元×200像元,其中设置4个目标,分别为40像元×40像元,添加的目标光谱曲线分别为图 1(a)~1(c)所示。对图像的上半部分(背景1,100像元×200像元)和下半部分(背景2,100像元×200像元)添加不同的背景光谱(背景光谱数据见图 1(d))。为方便表述,将左上角目标称作目标1,顺时针方向标记目标2、3、4,如图 1(e)所示。为了模拟自然界可能出现的异物同谱现象,在3个时相中,分别人为设置目标与背景光谱相似的情况:在第1时相模拟数据(图 1(f))中,目标1、3分别与背景1、2光谱相似;在第2时相数据中(图 1(g)),令目标1和背景2光谱相似;在第3时相中(图 1(h)),目标3的光谱与背景1光谱完全一样。之后对目标和背景光谱添加信噪比为13 dB,均值为0的高斯白噪声。模拟数据的目标和背景光谱(光谱数据值是从2014年的Landsat8 (path=029, row=031)图像随机挑选的植被或裸土的光谱)、真值图及假彩色图像(已加高斯白噪声)如图 1所示。
Fig. 1
 | Download: JPG larger image |
| 图 1 模拟数据光谱、真值图及假彩色图像(红: 波段5, 绿: 波段4, 蓝: 波段3) Fig. 1 Spectral signatures, ground truth images, and false-color images (R: band5, G: band4, B: band3) of the simulation data 图 1 模拟数据光谱、真值图及假彩色图像(红: 波段5, 绿: 波段4, 蓝: 波段3) Fig. 1 Spectral signatures, ground truth images, and false-color images (R: band5, G: band4, B: band3) of the simulation data --> | |
Fig. 2
 | Download: JPG larger image |
| 图 2 模拟数据检测结果图 Fig. 2 Detection results on the simulation data 图 2 模拟数据检测结果图 Fig. 2 Detection results on the simulation data --> | |
首先将目标1、2、3和4作为目标光谱分别使用FTA进行检测,分别称作FTA1、FTA2、FTA3和FTA4。之后将4个目标的光谱向量作为多目标输入,使用MTCEM、RMTCEM、SCEM与MTFTA进行检测(在使用MTCEM、RMTCEM与SCEM时,将3个时相的模拟数据组合在一起,形成200像元×200像元×21波段的图像进行目标探测)。实验结果显示如图 2。
从检测结果来看:首先,单目标的检测算法FTA(图 2(a)~2(d))只能检测对应的单个目标,因此FTA只具备单目标检测能力;其次,MTCEM、RMTCEM和SCEM在多目标检测方面均要好于FTA(图 2(e)~2(g)),因为他们均利用了所有目标的光谱;但是在背景压制方面效果较差,而且对噪声敏感。从视觉角度来看:MTFTA(图 2 (h))对背景的压制要好于前3种单时相算法,且对噪声敏感程度下降,检测结果更接近于真值图。
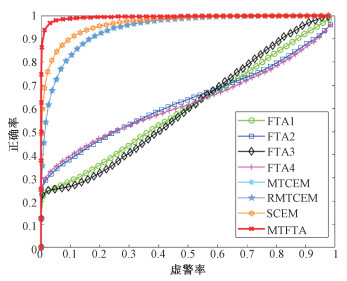
为了定量化比较各算法性能,图 3给出所有算法的ROC曲线,可以看出,MTFTA的ROC曲线要明显高于其余算法,表明检测性能最佳。此外,还计算了相应的AUC、OA和F-score(表 2),同样表明MTFTA在模拟数据上的检测效果要明显好于其他算法。
Fig. 3
 | Download: JPG larger image |
| 图 3 模拟数据检测ROC曲线 Fig. 3 ROC curves of detection results on the simulation data 图 3 模拟数据检测ROC曲线 Fig. 3 ROC curves of detection results on the simulation data --> | |
Table 2
| 表 2 模拟数据检测结果的AUC, OA以及F-scoreTable 2 The AUC, OA, and F-score of detection results on the simulation data |
3.2 真实数据实验此部分实际数据包含3景Landsat8图像,图像大小均为137像元×300像元×7波段,3景图像分别为2014年的第148天(春天)、第180天(夏天)和第308天(冬天)(假彩色图像见图 4(a)~4(c))。研究区域位于美国内布拉斯卡州,主要包含6种地物,分别是水体(池塘)、大豆、玉米、草地、冬小麦和苜蓿。真值图来源于2014年美国农业部网站上的农田数据层(cropland data layer, CDL)(https://nassgeodata.gmu.edu/CropScape/),如图 4(d)所示(蓝色为水体,棕色为冬小麦田,粉色为苜蓿田,绿色为大豆田,浅黄色为草地,黄色为玉米田)。
Fig. 4
 | Download: JPG larger image |
| 图 4 Landsat8农田数据假彩色图像(红: 波段5, 绿: 波段4, 蓝: 波段3),真值图及目标光谱曲线 Fig. 4 False color images (R: band5, G: band4, B: band3), ground truth image, and target signatures of the farmland data of Landsat8 图 4 Landsat8农田数据假彩色图像(红: 波段5, 绿: 波段4, 蓝: 波段3),真值图及目标光谱曲线 Fig. 4 False color images (R: band5, G: band4, B: band3), ground truth image, and target signatures of the farmland data of Landsat8 --> | |
本实验选取图 4(d)左上角蓝色的水体(目标1)、右下角棕色的冬小麦田(目标2)以及粉色的苜蓿田(目标3)作为检测目标。根据图 4(e)所示的光谱曲线来看,水体的光谱曲线在3个时相中变化不大;冬小麦田也一直都是植被;而苜蓿田在第1时相中是裸土,在后2个时相中展现了植被的光谱特征。与模拟实验类似,对目标1、2和3分别使用FTA算法,结果称作FTA1、FTA2和FTA3;对3个目标同时应用MTCEM、RMTCEM、SCEM和MTFTA,检测结果如图 5所示。
Fig. 5
 | Download: JPG larger image |
| 图 5 Landsat8农田数据检测结果图 Fig. 5 Detection results on farmland data of Landsat8 图 5 Landsat8农田数据检测结果图 Fig. 5 Detection results on farmland data of Landsat8 --> | |
从检测结果(图 5)可以看出,FTA可以很好地将某一个目标单独检测出来,但是仅对单个目标有效(图 5 (a)~5(c))。而将3个时相的影像组合在一起,使用MTCEM、RMTCEM和SCEM检测的效果不佳(图 5 (d)~5(f)),原因在于:有些背景像元与目标在某个时相内具有相似的光谱特征。比如,图 5 (g)中红框内部的很多背景像元,在图 5 (d)~5(f)的检测结果中被错检测为目标。而使用基于滤波张量分析的MTFTA算法时,可以较好地压制图 5 (g)中红框内部的大部分背景像元,原因是MTFTA能够更加有效地使用多时相信息, 从而其检测结果(图 5 (g))效果最好。
以上检测方法对应的ROC曲线如图 6所示,可以看出MTFTA算法的ROC曲线表现也是最好的,相对应的AUC、OA和F-score(表 3)也最高。综上,MTFTA在农田的检测效果是最佳的。
Fig. 6
 | Download: JPG larger image |
| 图 6 Landsat8农田数据检测ROC曲线(横轴使用对数坐标) Fig. 6 ROC curves of detection results on the farmland data of Landsat8 (The x-axis is plotted in logarithmic coordinates) 图 6 Landsat8农田数据检测ROC曲线(横轴使用对数坐标) Fig. 6 ROC curves of detection results on the farmland data of Landsat8 (The x-axis is plotted in logarithmic coordinates) --> | |
Table 3
| 表 3 Landsat8农田数据检测结果AUC, OA和F-scoreTable 3 The AUC, OA, and F-score of detection results on the farmland data of Landsat8 |
4 分析与讨论本节主要讨论多时相多目标检测算法MTFTA的时间复杂度。
MTFTA的计算复杂度包含3部分:
?
?
?
其中:L=L1×L2×…×LM,因此总共的时间复杂度是O(L2N+L3+(L2q+Lq2))。在L>>q时,时间复杂度将简化为O(L2(N+q)+L3),也就是((L1×L2×…×LM)2(N+q)+(L1×L2×…×LM)3)。因此可以知道,MTFTA的时间复杂度随着N和L1×L2×…×LM增加而增加。尤其是当时相数M或者相应的波段数L1, L2, …, LM很大的时候,计算复杂度将会变得很大。这里还给出FTA、MTCEM、RMTCEM和SCEM的时间复杂度,如表 4所示。
Table 4
| 表 4 FTA, MTCEM, RMTCEM, SCEM及MTFTA的计算复杂度Table 4 Computational complexity of FTA, MTCEM, RMTCEM, SCEM, and MTFTA |
根据表 4,可以得到各个算法的计算复杂度随着单个时相的波段数La(此处令L1=L2=…=LM=La)、总像元数N、时相数M变化的曲线如图 7所示。从图 7可以看出,MTFTA和FTA的计算复杂度基本相当,两者的计算复杂度在大部分情况下都大于MTCEM、SCEM和RMTCEM,并且随着波段数La、像元数N和时相数M的增长,增长幅度远大于MTCEM、RMTCEM和SCEM。
Fig. 7
 | Download: JPG larger image |
| 图 7 算法的浮点运算次数与波段数La、像元数N和时相数M的关系(纵轴使用对数坐标系) Fig. 7 Number of flops varying with number of bands La, number of pixels N, and number of time phases M (The y-axis is plotted in logarithmic coordinates) 图 7 算法的浮点运算次数与波段数La、像元数N和时相数M的关系(纵轴使用对数坐标系) Fig. 7 Number of flops varying with number of bands La, number of pixels N, and number of time phases M (The y-axis is plotted in logarithmic coordinates) --> | |
在空间复杂度方面,主要在于
5 结论随着遥感技术的快速发展,遥感图像的获取变得极为方便,图像的质量也愈来愈好,空间分辨率、时间分辨率及光谱分辨率得到很大的提升。但是作为遥感图像处理领域的一个很重要的分支,遥感图像目标检测算法要么集中于使用单时相的图像,对于多时相的信息利用不够充分;要么仅限于单目标的多时相探测,如FTA,对目标光谱的一致性要求较高。本文通过对限制条件进行改进,令算法对每个目标的输出能量都限制为1的前提下,得到基于FTA的多时相遥感图像的多目标检测算法,在模拟多光谱图像及真实多光谱图像上检测效果良好。但是与CEM和FTA一样,本文的MTFTA算法目前只适用于目标在图像中的比例比较小或者目标光谱变化比较小的情况。另外,由于MTFTA的计算复杂度较高,所以当遥感图像的波段数或者时相数很大时,会出现耗时较多以及占用内存增大的情况,因此未来的工作将致力于提高MTFTA的计算效率和存储效率。
参考文献
| [1] | Han J W, Zhang D W, Cheng G, et al. Object detection in optical remote sensing images based on weakly supervised learning and high-level feature learning[J]. IEEE Transactions on Geoscience and Remote Sensing, 2015, 53(6): 3325-3337. Doi:10.1109/TGRS.2014.2374218 |
| [2] | Liu W, Yamazaki F, Vu T T. Automated vehicle extraction and speed determination from quickbird satellite images[J]. IEEE Journal of Selected Topics in Applied Earth Observations and Remote Sensing, 2011, 4(1): 75-82. Doi:10.1109/JSTARS.2010.2069555 |
| [3] | Manolakis D, Marden D, Shaw G A. Hyperspectral image processing for automatic target detection applications[J]. Lincoln Laboratory Journal, 2003, 14(1): 79-116. |
| [4] | Manolakis D, Shaw G. Detection algorithms for hyperspectral imaging applications[J]. IEEE Signal Processing Magazine, 2002, 19(1): 29-43. Doi:10.1109/79.974724 |
| [5] | Kraut S, Scharf L L, Butler R W. The adaptive coherence estimator: a uniformly most-powerful-invariant adaptive detection statistic[J]. IEEE Transactions on Signal Processing, 2005, 53(2): 427-438. Doi:10.1109/TSP.2004.840823 |
| [6] | Harsanyi J C. Detection and classification of subpixel spectral signatures in hyperspectral image sequences[D]. University of Maryland, Baltimore County, 1993. |
| [7] | Geng X R, Ji L Y, Sun K. Clever eye algorithm for target detection of remote sensing imagery[J]. ISPRS Journal of Photogrammetry and Remote Sensing, 2016, 114: 32-39. Doi:10.1016/j.isprsjprs.2015.10.014 |
| [8] | Narumalani S, Mishra D R, Burkholder J, et al. A comparative evaluation of ISODATA and spectral angle mapping for the detection of saltcedar using airborne hyperspectral imagery[J]. Geocarto International, 2006, 21(2): 59-66. Doi:10.1080/10106040608542384 |
| [9] | Du Q, Ren H, Chang C I. A comparative study for orthogonal subspace projection and constrained energy minimization[J]. IEEE Transactions on Geoscience and Remote Sensing, 2003, 41(6): 1525-1529. Doi:10.1109/TGRS.2003.813704 |
| [10] | Harsanyi J C, Chang C I. Hyperspectral image classification and dimensionality reduction: an orthogonal subspace projection approach[J]. IEEE Transactions on Geoscience and Remote Sensing, 1994, 32(4): 779-785. Doi:10.1109/36.298007 |
| [11] | 高仕博, 程咏梅, 赵永强, 等. 基于多时相红外图像探测浅层地下目标[J]. 红外与毫米波学报, 2009, 28(1): 25-30. Doi:10.3321/j.issn:1001-9014.2009.01.007 |
| [12] | Xiao X M, Boles S, Liu J Y, et al. Characterization of forest types in Northeastern China, using multi-temporal SPOT-4 VEGETATION sensor data[J]. Remote Sensing of Environment, 2002, 82(2/3): 335-348. |
| [13] | Usman M, Liedl R, Shahid M A, et al. Land use/land cover classification and its change detection using multi-temporal MODIS NDVI data[J]. Journal of Geographical Sciences, 2015, 25(12): 1479-1506. Doi:10.1007/s11442-015-1247-y |
| [14] | Xiao X M, Boles S, Liu J Y, et al. Mapping paddy rice agriculture in Southern China using multi-temporal MODIS images[J]. Remote Sensing of Environment, 2005, 95(4): 480-492. Doi:10.1016/j.rse.2004.12.009 |
| [15] | Fichera C R, Mehmet G, Polino M. Land Cover classification and change-detection analysis using multi-temporal remote sensed imagery and landscape metrics[J]. European Journal of Remote Sensing, 2012, 45(1): 1-18. Doi:10.5721/EuJRS20124501 |
| [16] | Geng X R, Ji L Y, Zhao Y C. Filter tensor analysis: a tool for multi-temporal remote sensing target detection[J]. ISPRS Journal of Photogrammetry and Remote Sensing, 2019, 151: 290-301. Doi:10.1016/j.isprsjprs.2019.03.008 |
| [17] | Ren H, Du Q, Chang C I, et al. Comparison between constrained energy minimization based approaches for hyperspectral imagery[C]//IEEE Workshop on Advances in Techniques for Analysis of Remotely Sensed Data, Greenbelt, MD, USA: IEEE Press, 2003: 244-248. |
| [18] | 尹继豪, 王艳, 王义松. 一种改进的高光谱图像中多小目标检测算法[J]. 电子学报, 2010, 38(9): 1975-1978. |
| [19] | 张贤达. 矩阵分析与应用[M]. 2版. 北京: 清华大学出版社, 2013. |
| [20] | Youden W J. Index for rating diagnostic tests[J]. Cancer, 1950, 3(1): 32-35. Doi:10.1002/1097-0142(1950)3:1<32::AID-CNCR2820030106>3.0.CO;2-3 |
