

中国科学院大学资源与环境学院, 北京 101407
摘要: 在宁夏回族自治区的葡萄种植园中,现多采用沟灌结合冲施肥的灌溉方法,部分种植园已施行滴灌结合随水施肥的灌溉方法.为探讨沟灌-冲施肥系统和滴灌-随水施肥系统对宁夏葡萄园土壤氧化亚氮(N2O)排放的影响,应用静态箱-气象色谱技术对该问题展开研究.结果表明:在2012年和2013年葡萄生长季中,较之于沟灌系统,滴灌系统可分别减少N2O年均排放量(18.24±2.79)kg/(hm-2 ·a-1)和(3.37±0.37)kg/(hm-2 ·a-1),约占沟灌系统排放量的61.1%和78.9%.在此基础之上计算排放系数,可估算出应用滴灌系统替换宁夏现有葡萄园中全部沟灌系统后,N2O减排总量分别约为2012年的704 264~770 756 kg和2013年的215 550~223 920 kg.可见,滴灌系统可以有效减少土壤N2O的排放损失,是一种更具N2O减排潜力的灌溉方式.
关键词: 滴灌沟灌排放因子葡萄园氧化亚氮
The production and emission of soil N2O in agro-ecological systems is a complex process which can be affected by slight changes in the climate,vegetation,soil factors,and farmland management practices[1-2]. In irrigated agro-ecosystems,irrigation and fertilisation are the major factors that influence the leaching of NO3-,which is a groundwater contaminant. Nitrogen lost from fertilized fields through NO3- leaching can also contribute to the N2O emissions by conversion of NO3- to N2O in a receiving aquatic ecosystem [3].
In Ningxia Hui autonomous region,formland of more than 40000hm2 is used for cultivating grapes in 2015. In the local vineyards,furrow irrigation system with fertiliser dissolved in the irrigation water (FIS) is widely applied. Meanwhile the drip irrigation and fertigation system (DIS) has been implemented in some areas. The DIS reduces the usage amount of irrigation water and residual soil-N accumulation,and subsequently the potential for denitrification in these vineyards. In addition,DIS also improves the efficiency of agricultural production through a relative decrease in production costs,and affects soil N2O production because water and fertiliser are delivered directly to crop roots in small quantities but at high frequencies [4]. Therefore,long-term application of different irrigation systems will exert different influences on the production of soil N2O. Previously,some field experiments were conducted to demonstrate that vineyards may not produce as much N2O as annual crops [5-6]. However,nitrous oxide emissions were highly variable in these vineyard studies with coefficients of variation of 100%,similar to some studies conducted in annual cropping systems [7-8]. It is still important to study the abilities of different irrigation systems to emit N2O emissions in vineyards.
The objectives of this study are: 1) to compare N2O emissions from different irrigation systems (FIS and DIS) applied in a vineyard,2) to analysis how these different systems affect the N2O emission pathways,and 3) to provide theoretical basis about evaluations of comprehensive eco-environmental effects under different irrigation and fertilisation regimes. The results of this experiment would help to establish strategies to mitigate N2O emissions from irrigated agricultural soils.
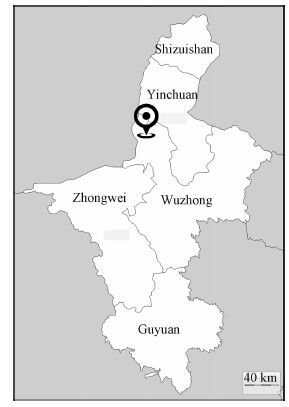
1 Materials and methods1.1 Natural conditionsThis experiment was conducted at the Vine and Wine Engineering Research Centre of Ningxia University from July to August in 2012 and from July to September in 2013 (Fig. 1). The site (38°14′21″N,106°01′43″E) is located at Yuquanying in Yinchuan city of Ningxia Hui autonomous region,with an elevation of 1130m and a mean atmospheric pressure of 887 hPa on sunny days[9]. The test sample was a vineyard consisting of two pieces of agricultural land which had different irrigation systems (DIS and FIS) with different irrigation and fertilisation amounts since 2005. Under the long-term application of different irrigation systems,soil structure and plant growth would change and then affect soil N2O emissions in each growing season. The low-frequency sampling can also verify the experimental hypothesis to a certain extent. In Ningxia,most of the wineries and vineyards use the same or similar irrigation and fertilisation scheme in the same year. Therefore,the farmland management measures of this experiment site were taken as the benchmark.
Fig. 1
 | Download: JPG larger image |
| Fig. 1 Location of the study site in Ningxia | |
The soils in the study area,which are mainly derived from alluvial deposits,are classified as sierozems with a sandy loam texture. The soils have high pH values and low nutrient levels. In particular,the content of organic matter is less than 5g·kg-1,which is characteristic of low organic carbon accumulation in semi-arid and barren sandy soils. Details are given in Table 1. Due to furrow irrigation,fertilisation,and tillage in the vineyards year after year,the nitrogen and potassium contents in the subsurface are higher than in the surface [10].
Table 1
| Table 1 The main soil physicochemical properties [10] |
The local climate is typical warm temperate continental monsoon climate,and the mean annual temperature is higher than or equal to 10℃. The mean annual precipitation is 193.4-202.2mm and most of the precipitation occurs during the grape growing season. The mean annual reference evaporation is 1787.3mm,the the sunshine hours per year is 2851-3106h,and the average daily temperature is 13.6℃ [9]. The large temperature difference between day and night promotes the synthesis and accumulation of organic matter[11]. The planting of vineyards in this area began in 1980s.
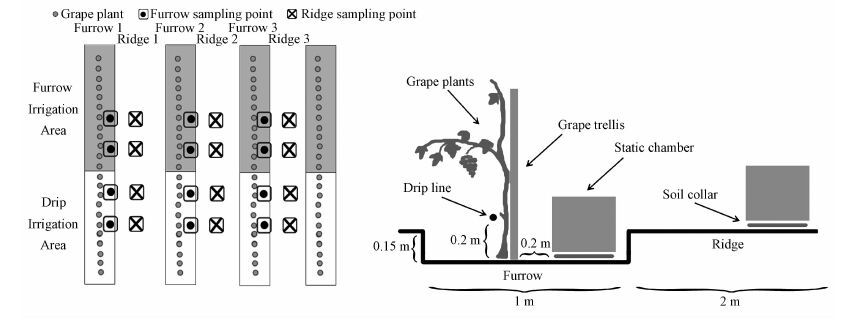
1.2 Experiment designThe study was based on an experimental proposal (Fig. 2) by the Vine and Wine Engineering Research Centre of Ningxia University. A split-plot design was adopted in the experiment. The DIS treatment block (drip irrigation and fertigation) and FIS treatment block (furrow irrigation and water dissolved fertiliser) were established at the east and west sides,respeatively,and were completely isolated by a levee. In each of the blocks,both the ridge and furrow were sampled by placing static chambers. Four-years-old cabernet sauvignon grape vines were grown using a single-arm trellis with continuous cultivation.
The individual amounts of water applied in DIS and FIS were 300m3·hm-2 and 1200m3·hm-2 in 2012 and 225m3·hm-2 and 1200m3·hm-2 in 2013,respectively. The actual date of furrow irrigation was approximately 2 days late because the experimental area was located at the far end of the vineyard. The first and last irrigation events were conducted using furrow irrigation across the entire study area. Typical tillage practices and weeding methods were used. The DIS and FIS fertilisation practices slightly differed in timing and total N input.
Fig. 2
 | Download: JPG larger image |
| Fig. 2 Description of the whole experimental area (left) and schematic of the experimental design (right) | |
1.3 In situ observationsIn 2012 and 2013,the closed static chamber method was used to collect N2O,and gas samples were acquired in mid-morning (0900-1100 GMT+8) when the soil temperature was close to the mean daily soil temperature [12]. The height of the chamber was 0.4m,and the cross-sectional area of the chamber was 0.16m2 (0.4m×0.4m). Gas measurements were obtained from ridge and furrow zones,and a weighted average of the two sampling zones was used to estimate the total crop-bed emissions for each sampling date. During sampling,gas samples of more than 100mL were collected by large syringes from each static chamber 5 times in 2012 and 4 times in 2013 at 10-min intervals per day,and the temperature in the chamber was measured using a temperature recorder panel at the same time. The gas samples were then transferred to the 0.5L one-way cock gas sampling bags for temporary storage and transport. The underground volumetric soil moisture contents at depths of 0-5cm and 0-10cm were tested at each sampling block using TZS-II Global Positioning System Time Domain Reflectometry in 2012 and portable HS2 TDR in 2013. These values were measured at three different points close to each collar and were converted to percent water-filled pore space (%WFPS) using the known bulk density and a particle density value of 2.65g·cm-3 to obtain the pore volume [9].
An Agilent 7890A gas chromatograph was used to detect the N2O,CO2,and CH4 concentrations in the gas samples. The rate of N2O emissions was calculated using the formula F=M/V0×P/P0× T0/T×H× dCt/dt,where F is the N2O flux per hour (μg/(m-2·h-1)),M is the molar mass of gas (g·mol-1),V0 is the molar volume of the gas under standard conditions (22.41×10⁻³ m3),T0 and P0 are the absolute air temperature and pressure under standard conditions; P is the pressure at the sampling site which is obtained from the existing literatures; T is the absolute temperature determined at the sampling time; dCt/dt is the rate of variation of the N2O concentration,which can be measured in the static chamber; and H is the height of the static chamber [13-14]. Temperature and precipitation were provided by the local meteorological station. An approximately 1-week sampling interval during the growing season was used in this study,which is just adequate for making event-based comparisons,especially when sampling is weighted by events,which are likely to increase emissions,such as fertilisation,heavy rainfall,and irrigation.
1.4 Data processingStatistical comparisons between events within each management system were performed by ANOVA. All data were tested for normality using the Shapiro-Wilk test and tested for homogeneity of variance using the one-way ANOVA. Data transformations were not required. The differences between the means within each management system were analysed using repeated measures ANOVA and Tukey-Kramer pair-wise comparisons in IBM SPSS Statistics 20. Significance was accepted at a probability level of P≤0.05. The relationships among the measured parameters were assessed using correlation analyses,and Pearson’s correlation coefficients were calculated on a per event basis. Microsoft Excel 2010 was used for data manipulation[9].
2 Results and discussionDifferent irrigation and fertilisation types can result in significant variations in soil N2O emissions. For example,different irrigation and fertilisation requirements lead to variations in the soil moisture content,which may affect the soil N2O emissions [15]. These factors will be tested in this study.
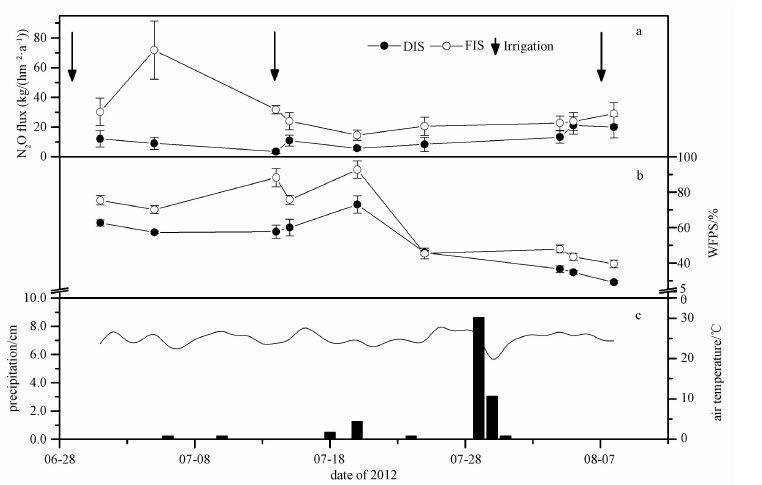
2.1 N2O emissionBecause of numerous constraints,it was not possible to generate a curve of diurnal variation of soil N2O emission fluxes through in situ observations in 2012. However,the existing data just showed that the annual N2O flux was largely influenced by farmland management practices such as irrigation and fertilisation,as well as by air temperature and precipitation (Fig. 3). The N2O emissions exhibited an upward trend after the irrigation events. The annual N2O flux Values under DIS and FIS were (11.62±1.59) and (29.86±3.29)kg/(hm-2·a-1) (n=72),respectively. The treatment differences in the N2O emissions were highly significant (P <0.01) in the growing season. In 2012 the DIS treatment reduced N2O emissions by (18.24±2.79)kg/(hm-2·a-1) compared with the FIS treatment.
Fig. 3
 | Download: JPG larger image |
| Fig. 3 Comparison of nitrous oxide (N2O) emissions (a) and water-filled pore space (WFPS) (0-10 cm) (b) between the two irrigation methods,and the air temperature and precipitation data during the growing season in 2012 (c) | |
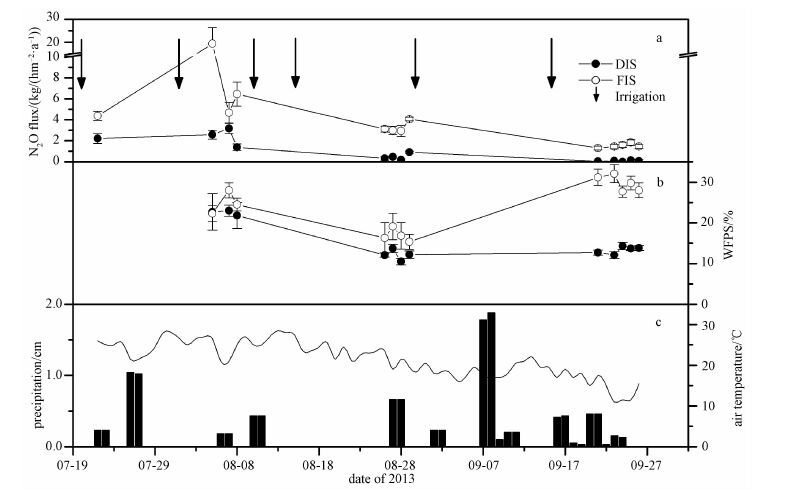
In 2013,the annual N2O emissions were also largely influenced by the irrigation,fertilisation,and meteorological conditions (Fig. 4). Following irrigation and rainfall events,the N2O emissions increased rapidly. The N2O emissions decreased with a downtrend in air temperature. Pulses in N2O emissions were observed when soil wetting was combined with a high supply of C or N [16]. The annual N2O emissions under drip irrigation and furrow irrigation were (0.9±0.2) and (4.27±0.94)kg/(hm-2·a-1)(n=104),respectively. DIS had lower N2O emissions,compared with FIS,for all sampling dates,and the differences between the treatments were highly significant (P <0.01) in the growing season. In 2013,the DIS treatment reduced N2O emissions by (3.37±0.37)kg/(hm-2·a-1) compared with the FIS treatment.
Fig. 4
 | Download: JPG larger image |
| Fig. 4 Comparison of N2O emissions (a) and WFPS (0-10 cm) (b) between the two irrigation methods,and the air temperature and precipitation data during the growing season in 2013(c) | |
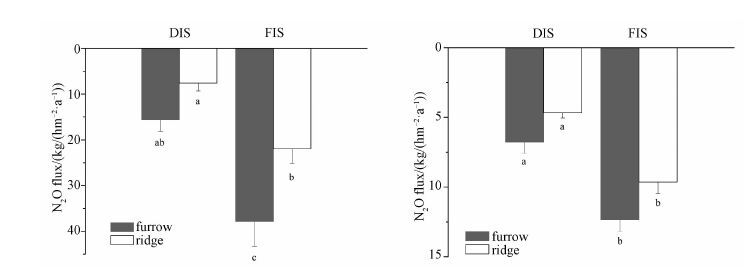
In 2012,differences in irrigation and N application amounts resulted in large differences in N2O emissions between the furrow and ridge locations (Fig. 5). The annual N2O emissions in the DIS treatment were (15.64±2.52)kg/(hm-2·a-1) at the furrow location and (7.61±1.74)kg/(hm-2·a-1) at the ridge location,and the corresponding values were (37.83±5.45) and (21.89±3.24) kg/(hm-2·a-1) in the FIS treatment. The N2O emissions at the furrow locations were higher than at the ridge locations under the same irrigation treatment. Meanwhile the N2O emissions under FIS were significantly higher (P>0.05) than under DIS.
Fig. 5
 | Download: JPG larger image |
| Fig. 5 Comparison of N2O emissions at different functional locations during the growing season in 2012 (left) and 2013 (right) between the two irrigation methods | |
In 2013,the annual N2O emissions in the DIS treatment were (6.77±0.78) kg/(hm-2·a-1) at the furrow locations and (4.67±0.38) kg/(hm-2·a-1) at the ridge location,and the corresponding values were (12.33±0.88) and (9.64±0.83) kg/(hm-2·a-1) in the FIS treatment. The N2O emissions at the furrow location were higher than at the ridge location under the same irrigation treatment. This result could be attributed to the same reasons mentioned above for 2012. The FIS treatments also caused higher N2O emissions significantly (P>0.05) than the DIS treatments.
2.2 Soil moisture contentThere were significant differences in the soil moisture content between the two irrigation systems in 2012. The soil moisture content was strongly influenced by plant growth,irrigation,precipitation,and air temperature. This was observed in the surge of WFPS that accompanied irrigation events. The soil moisture content affects the N2O emission from nitrification and denitrification by controlling the biotic and abiotic processes involved in the production,consumption,and diffusion of N2O within the soil and by affecting the soil aeration,soil redox,and soil microbial and enzyme activity [17]. Maximum N2O emission generally occurs at a soil moisture content of 90%-100% field capacity or 77%-86% WFPS. Under higher soil moisture content,denitrification is the main process through which N2O is generated,and then N2O emissions gradually decrease with an increase in the soil moisture content [18]. The WFPS values under DIS and FIS in the upper soil layer (0-5 cm) were (31.2±1.36)% and (41.8±1.989)% (n=72),respectively,with highly significant differences (P<0.01). The WFPS values at a depth of 0-10 cm were (50.77±1.88)% and (64.27±2.5)% (n=72) under DIS and FIS,respectively,and these differences were also highly significant (P <0.01). The highest growing season WFPS values were observed under FIS in the furrow location,where values higher than 60% WFPS frequently occurred following irrigation events. The high amount and rate of water applied under the FIS regime resulted in insignificantly higher soil moisture content compared with the drip irrigation method. However,at many times during the growing season,the soil moisture was lower than the WFPS,which resulted in high N2O emissions. The N2O emissions under DIS were lower than under FIS by this time.
In 2013,the differences in the soil moisture content between DIS and FIS were also significant. The soil moisture content was influenced by irrigation and precipitation,which increased the WFPS. The WFPS values under DIS and FIS at a depth of 0-5 cm were (5.72±0.85)% and (10.98±1.07)% (n=96),respectively. The WFPS values at a depth of 0-10 cm were (15.21±1.31)% and (24.26±2.22)% (n=96) under DIS and FIS,respectively. These differences were highly significant (P<0.01) in both groups of data. A correlation analysis indicated that there was no significant correlation between N2O emissions and WFPS. It could be attributed to the same reasons mentioned above for 2012 that the variation in N2O emissions was mainly due to variations in meteorological conditions as well as other factors that include the growth period of the crop,farmland management practices such as irrigation and fertilisation,the experimental design,and sampling scheme[19]. It was difficult to explain the mechanism of N2O emissions only in the respect of soil moisture content. As the results,compared with the in situ data observed in 2012,the low soil moisture content contributed directly to the significantly lower annual N2O emissions in 2013.
2.3 Emission factorThe concept of the emission factor (EF) was introduced by the IPCC to quantify the N2O emissions caused by agricultural N fertiliser application based on the significant correlation between the amount of nitrogen applied in agriculture and the N2O emissions[20-21]. The EF is evaluated by dividing the cumulative N2O emissions by the N applied as fertiliser. It refers to the percentage difference between the amounts of N2O emitted from a fertilised treatment and from a treatment without fertiliser relative to the total N applied. This value reflects the ability of soil to emit N2O and can be used to estimate the N2O emissions from farmland based on the N fertiliser dose [17]. Based on the correlation between N2O emissions and the amount of N applied,the N2O EFs of N fertiliser are widely used in the compilation of regional and global farmland N2O emissions. Under different water management practices,N2O emissions vary considerably and consequently the N2O EFs vary.
In 2012,the EFs of organic and inorganic nitrogen fertiliser were 1.37% and 5.06% under DIS and FIS,respectively. These values were higher than 1%(the default value of the farmland soil N2O emission factor presented in the GHG Emission Inventory by the IPCC in 2006),which is caused by the unusually large amounts of precipitation within this year [22]. The annual N application rate in local vineyards is approximately 180-270kg·hm-2. Therefore,converting the existing furrow irrigation vineyards to drip irrigation vineyards could reduce annual N2O emissions by approximately 704264-770756kg,estimated using the EF in Ningxia. In 2013,the EFs of the nitrogen fertiliser under DIS and FIS were 0.39% and 0.85%,respectively,which are both lower than the default value of 1%. On this basis,converting the existing furrow irrigation system in the vineyards to drip irrigation system could reduce the annual N2O emissions by approximately 215550-223920 kg in Ningxia. The emissions of N2O from farmland soils account for more than 70% of the total N2O emitted during the growing season [23-25]. Then the cumulative N2O emissions under drip irrigation were 21%-38.9% lower than under furrow irrigation.
Above all,the low N2O emissions and EFs under DIS,compared with those under FIS,could be due to 1) the patterns and duration of soil water saturation,which are related to the type of irrigation system,2) different fertiliser forms and placement,3) different frequencies and rates of fertiliser application,and 4) more efficient plant N uptake in the DIS,indicated by the yield and partial factor productivity. In addition,long-term effects of management practices on soil properties,such as increases in bulk density due to soil compaction by agricultural equipment and variations in total C levels in cropped soils compared with fallow soils,could influence N2O emissions under different management practices [26].
3 ConclusionsThe irrigation and fertilisation methods may significantly affect soil N2O emissions by changing the soil moisture content and other soil characters. This study shows that there is a close relationship between soil N2O emissions and the type of irrigation system used. The DIS used in the growing season reduced the annual N2O emissions by (18.24±2.79) kg/(hm-2·a-1) (61.1%) in 2012 and (3.37±0.37) kg/(hm-2·a-1) (78.9%) in 2013,compared with FIS. Furthermore,the EFs under DIS and FIS were 1.37% and 5.06%,respectively,in 2012 and 0.39% and 0.85%,respectively,in 2013. On this basis,the annual N2O emission reductions,caused by converting the existing FIS vineyards to DIS vineyards in Ningxia,were approximately 704264-770756kg in 2012 and 215550-223920kg in 2013. Compared with the FIS treatment,DIS is an environmental irrigation system which can significantly reduce soil N2O emissions and has great reduction potential for N2O emissions in Ningxia vineyards.
Although the results indicate that DIS contributes to low emissions of N2O,more studies will be necessary to evaluate the influence of several parameters related to drip irrigation such as the amount,rate,and frequency of water application and soil characteristics. Additionally,since fertigation technology is often applied with drip irrigation,further work is needed to evaluate the influence of soluble N fertilizers applied through drip irrigation on the N2O emissions.
References
| [1] | Amos B, Arkebauer T J, Doran J W. Soil surface fluxes of greenhouse gases in an irrigated maize-based agroecosystem[J].Soil Science Society of America Journal, 2005, 69:387–395.DOI:10.2136/sssaj2005.0387 |
| [2] | Scheer C R, Wassmann, Kienzler K. Nitrous oxide emissions from fertilized, irrigated cotton (Gossypiumhirsutum L.) in the Aral Sea Basin, Uzbekistan: influences of nitrogen applications and irrigation practices[J].Soil Biology Biochemistry, 2008, 40:290–301.DOI:10.1016/j.soilbio.2007.08.007 |
| [3] | Maharjan B, Venterea R, Rosen C. Fertilizer and irrigation management effects on nitrous oxide emissions and nitrate leaching[J].Agronomy Journal, 2014, 106:703–714.DOI:10.2134/agronj2013.0179 |
| [4] | Turner N C. Plant water relations and irrigation management[J].Agricultural Water Management, 1990, 17:59–73.DOI:10.1016/0378-3774(90)90056-5 |
| [5] | Smart D R, Schwass E, Lakso A, et al. Grapevine rooting patterns: a comprehensive analysis and a review[J].American Journal of Enology and Viticulture, 2006, 57:89–104. |
| [6] | Steenwerth K, Belina K M. Cover crops and cultivation: impacts on soil N dynamics and microbiological function in a Mediterranean vineyard agroecosystem[J].Applied Soil Ecology, 2008, 40:370–380.DOI:10.1016/j.apsoil.2008.06.004 |
| [7] | Stehfest E, Bouwman L. N2O and NO emission from agricultural fields and soils under natural vegetation: summarizing available measurement data and modeling of global annual emissions[J].Nutrient Cycling in Agroecosystems, 2006, 74:207–228.DOI:10.1007/s10705-006-9000-7 |
| [8] | Bouwman AF, Boumans LJM, Batjes NH. Emissions of N2O and NO from fertilized fields: summary of available measurement data[J].Global Biogeochemical Cycles, 2002, 16:1058. |
| [9] | Zhang Y J, Niu H S, Wang S P, et al. Application of the DNDC model to estimate N2O emissions under different types of irrigation in vineyards in Ningxia, China[J].Agricultural Water Management, 2016, 163:295–304.DOI:10.1016/j.agwat.2015.10.006 |
| [10] | Wang R, Sun Q, Guo J, et al. Sandy wine vineyards soil moisture distribution in the east of Helan Mountain[J].Journal of Irrigation and Drainage, 2013, 32:69–73. |
| [11] | Su Z S, Wang L X. Observation and analysis on mountain climate in the semi-arid mountainous district in south of Ningxia[J].Arid Meteorology, 2005, 23:17–20. |
| [12] | Parkin TB, Kaspar TC. Temporal variability of soil carbon dioxide flux: effect of sampling frequency on cumulative carbon loss estimation[J].Soil Science Society of America Journal, 2004, 68:1234–1241.DOI:10.2136/sssaj2004.1234 |
| [13] | Dong Y H, Ouyang Z, Li Y S, et al. Influence of different fertilisation on CO2 and N2O fluxes from agricultural soil[J].Soil and Fertilizer Science in China, 2007, 4:34–39. |
| [14] | Dai Z H, Trettin C C, Li C S, et al. Effect of assessment scale on spatial and temporal variations in CH4, CO2, and N2O fluxes in a forested wetland[J].Water Air Soil Pollution, 2012, 223:253–265.DOI:10.1007/s11270-011-0855-0 |
| [15] | Weitz A M, Linder E, Frolking S, et al. N2O emissions from humid tropical agricultural soils: effects of soil moisture, texture and nitrogen availability[J].Soil Biology Biochemistry, 2001, 33:1077–1093.DOI:10.1016/S0038-0717(01)00013-X |
| [16] | Lee X, Wu H W, Sigler J, et al. Rapid and transient response of soil respiration to rain[J].Global Change Biology, 2004, 10:1017–1026.DOI:10.1111/gcb.2004.10.issue-6 |
| [17] | Li X L, Xu H, Cai Z C. Effect of water management on nitrous oxide emission from rice paddy field: a review[J].Soils, 2009, 41:1–7. |
| [18] | Hou A X, Chen G X, Cleemput O V. Effect of different nitrogen fertilizers on N2O emission from soil[J].Chinese Journal of Applied Ecology, 1998, 9:176–180. |
| [19] | Feng K, Yin S X. Some soil factors of nitrous oxide emissions[J].Progress in Soil Science, 1995, 23:35–42. |
| [20] | Eichner M. Nitrous oxide emissions from fertilized soils: summary of available data[J].Journal of Environmental Quality, 1990, 19:272–280. |
| [21] | Bouwman A F. Direct emission of nitrous oxide from agricultural soils[J].Nutrient Cycling in Agroecosystems, 1996, 46:53–70.DOI:http://html.rhhz.net/ZGKXYDXXB/10.1007/BF00210224 |
| [22] | Eggleston H S, Buendia L, Miwa K, et al. IPCC guidelines for national greenhouse gas inventories, prepared by the national greenhouse gas inventories programme[R]. Japan: IGES, 2006. |
| [23] | Mosier A R, Hutchinson G L. Nitrous Oxide Emissions from Cropped Fields[J].Journal of Environmental Quality, 1981, 10:169–173. |
| [24] | Sun Z G, Liu J S, Yang J S, et al. N2O flux characteristics and emission contributions of Calamagrostis angustifolia wetland during growth and non-growth seasons[J].Actaprataculturae Sinica, 2009, 18:242–247. |
| [25] | Jiang C S, Wang Y S, Zheng X H, et al. CH4 and N2O emission from a winter-time flooded paddy field in a hilly area of Southwest China[J].Chinese Journal of Applied Ecology, 2005, 16:539–544. |
| [26] | Kennedy LT, Suddick CE, Six J. Reduced nitrous oxide emissions and increased yields in California tomato cropping systems under drip irrigation and fertigation[J].Agricultural Ecosystem Environment, 2013, 170:16–27.DOI:10.1016/j.agee.2013.02.002 |
