 , 李金岭1,3, 松本晃治4, 花田英夫4, 李文潇2,3
1. 中国科学院上海天文台天文地球动力学研究中心, 上海 200030;
2. 中国科学院国家天文台月球与深空探测重点实验室, 北京 100012;
3. 中国科学院大学, 北京 100012;
4. 日本国立天文台RISE研究室, 奥州 0230861
2017年04月16日 收稿; 2017年05月24日 收修改稿
基金项目: 中俄政府间国际科技合作项目(2016YFE0120000)、国家自然科学基金(41590851)和国家重点基础研究发展计划(2015CB857101)资助
通信作者: 杨永章, E-mail:yzyang@shao.ac.cn
摘要: 利用最新的GRAIL月球重力数据和LRO地形数据,计算重力/地形导纳及其相关性。结果表明,最新的测月数据能够在球谐系数达到500阶的时候依然保持比较高的相关性,精度得到很大的提高。全月重力/地形导纳在50阶以下(波长大于~220 km),之后迅速增加,维持在110 mgal/km附近。利用Gauss-Newton迭代法计算得到全月弹性平均厚度Te=11.7 km,表明很有可能月球地形在月球早期就已经形成。
关键词: 重力地形导纳弹性层厚度Gauss-Newton方法
Average elastic thickness of the Moon estimated using admittance
YANG Yongzhang1,2,3

 , LI Jinling1,3, MATSUMOTO Koji4, HANADA Hideo4, LI Wenxiao2,3
 1. Center for Astro-geodynamics Research, Shanghai Astronomical Observatories, Chinese Academy of Sciences, Shanghai 200030, China;
2. Key Lab of Lunar and Deep Space Exploration, National Astronomical Observatories, Chinese Academy of Sciences, Beijing 100012, China;
3. University of Chinese Academy of Sciences, Beijing 100012, China;
4. RISE Project, National Astronomical Observatory, Oshu 0230861, Japan
Abstract: In this paper, we consider the free-air gravity model by the GRAIL (Gravity Recovery and Interior Laboratory) mission and the topographic model from the LRO (Lunar Reconnaissance Orbiter) laser altimetry. They showed high correlation up to ~500 (0.8) degree. The gravity-topography admittance (the ratio of gravity to topography in spectral domain) was low for degrees below ~50 (i.e., wavelength longer than ~220 km), but it increased sharply and was kept at constant value of ~110 mgal/km. We employed the Gauss-Newton method and simple model to estimate the elastic thickness of the Moon at 11.76 km. This thickness value is not significantly different from those found in the present Earth in spite of the smaller dimension of the Moon. This implies that the significant portion of topographic features on the Moon was formed in the early ages of the Moon, when the heat flow was comparable to that in the present Earth.
Key words: gravitytopographyadmittanceelastic thicknessGauss-Newton method
利用对绕月卫星跟踪测量得到的重力数据,结合搭载激光高度计和相机的绕月卫星得到的月面地形数据,可以得到月球浅层构造的信息。由于二者在特定波长的范围内具有较高的相关性,可以通过计算二者的振幅比(即导纳),来推测月表层弹性体的平均厚度(elastic thickness, Te),并进一步推测当时热状态。
从地形和重力的比较出发计算Te,需要地形和重力较高分辨率的数据。1994年Zuber等[1]首先使用美国发射的Clementine卫星的数据分析研究全月导纳情况,但遗憾的是重力数据和地形数据仅在10阶以内有较好的相关性,无法从导纳出发对Te进行较好的约束。
以1998到1999年间美国发射Lunar Prospector探测器开始,月球的重力场探测有了长足的进步[2],然而当时的卫星追踪主要依赖于地面台站,月球公转与地球的自转基本同步,因此月球背面的重力场模型精度较差。日本2007年开始的SELENE月球探测计划,创造性地使用中继卫星,解决了月球背面重力测量问题[3],并提出SGM100 h重力模型[4]。Yan等[5]利用中国自主发射并实施的嫦娥系列探测卫星,结合SELENE等以前的探测数据,提出CEGM02重力模型。
同期,Araki等[6]和Ping等[7]分别根据SELENE和嫦娥系列任务解算了月球高度模型LALT_SH和CLTM-s01,但这些模型仅仅能保证60阶次的精度,无法有效进行全球范围的导纳计算。
另一方面,美国2011年进行的GRAIL探测计划,采用低轨(20~50 km)双卫星追踪的测量方式,对全月进行高精度的重力测量[8],同期开展的Lunar Reconnaissance Orbiter(LRO)计划利用搭载的高精度激光高度计得到月球地形数据。本文将利用这两种数据对全月导纳进行计算,进而对弹性厚度Te进行约束。
1 重力和地形的相关性天体的重力场和地形,经常用球谐函数的展开即Stokes系数来表示,式(1)和式(2)分别表示重力场和地形的球谐函数展开:
| $\begin{align} &\ \ \ \ \ \ \ \ \ \ \ \ \ \ \ \ \ \ \ \ \ \ \ \ \ \ \ \ \mathit{V}\left( \mathit{r}\text{, }\mathit{\varphi }\text{, }\mathit{\lambda } \right)\text{=}\frac{\mathit{gM}}{\mathit{r}} \\ &\left[ \sum\limits_{\mathit{l}\text{=0}}^{{{\mathit{N}}_{\text{max}}}}{\sum\limits_{\mathit{m}}^{\mathit{l}}{{{\left( \frac{\mathit{R}}{\mathit{r}} \right)}^{\mathit{m}}}}}{{{\mathit{\bar{P}}}}_{\mathit{lm}}}\text{(sin}\mathit{\varphi }\text{)(}\mathit{\bar{C}}_{\mathit{lm}}^{\mathit{g}}\text{cos}\mathit{m\lambda }\text{+}\mathit{\bar{S}}_{\mathit{lm}}^{\mathit{g}}\text{sin}\mathit{m\lambda }\text{)} \right], \\ \end{align}$ | (1) |
| $\mathit{H}\left( \mathit{\varphi }\text{, }\mathit{\lambda } \right)\text{=}\sum\limits_{\mathit{l}\text{=0}}^{{{\mathit{N}}_{\text{max}}}}{\sum\limits_{\mathit{m}}^{\mathit{l}}{{{{\mathit{\bar{P}}}}_{\mathit{lm}}}}}\text{(sin}\mathit{\varphi }\text{)(}\mathit{\bar{C}}_{\mathit{lm}}^{\mathit{t}}\text{cos}\mathit{m\lambda }\text{+}\mathit{\bar{S}}_{\mathit{lm}}^{\mathit{t}}\text{sin}\mathit{m\lambda }\text{)}\text{.}$ | (2) |
根据阶次不同,全月地形对于自由空气重力异常的导纳Zl和二者相关性Rl有如下定义[9],
| ${{\mathit{Z}}_{\text{l}}}\text{=}\frac{\sum\limits_{\mathit{m}\text{=0}}^{\mathit{l}}{\text{(}\mathit{C}_{\mathit{lm}}^{\mathit{g}}\mathit{C}_{\mathit{lm}}^{\mathit{t}}\text{+}\mathit{S}_{\mathit{lm}}^{\mathit{g}}\mathit{S}_{\mathit{lm}}^{\mathit{t}}\text{)}}}{\sum\limits_{\mathit{m}\text{=0}}^{\mathit{l}}{\text{(}\mathit{C}{{_{\mathit{lm}}^{\mathit{t}}}^{\text{2}}}\text{+}\mathit{S}{{_{\mathit{lm}}^{\mathit{t}}}^{\text{2}}}\text{)}}}\text{, }$ | (3) |
| ${{\mathit{R}}_{\mathit{l}}}\text{=}\frac{\sum\limits_{\mathit{m}\text{=0}}^{\mathit{l}}{\text{(}\mathit{C}_{\mathit{lm}}^{\mathit{g}}\mathit{C}_{\mathit{lm}}^{\mathit{t}}\text{+}\mathit{S}_{\mathit{lm}}^{\mathit{g}}\mathit{S}_{\mathit{lm}}^{\mathit{t}}\text{)}}}{\sqrt{\sum\limits_{\mathit{m}\text{=0}}^{\mathit{l}}{\text{(}\mathit{C}{{_{\mathit{lm}}^{\mathit{t}}}^{\text{2}}}\text{+}\mathit{S}{{_{\mathit{lm}}^{\mathit{t}}}^{\text{2}}}\text{)}}}\sqrt{\sum\limits_{\mathit{m}\text{=0}}^{\mathit{l}}{\text{(}\mathit{C}{{_{\mathit{lm}}^{\mathit{g}}}^{\text{2}}}\text{+}\mathit{S}{{_{\mathit{lm}}^{\mathit{g}}}^{\text{2}}}\text{)}}}}\text{.}$ | (4) |
| $\mathit{l} \cdot \mathit{\lambda }\text{=2 } \pi \mathit{R}\text{.}$ | (5) |
 | Download: JPG larger image |
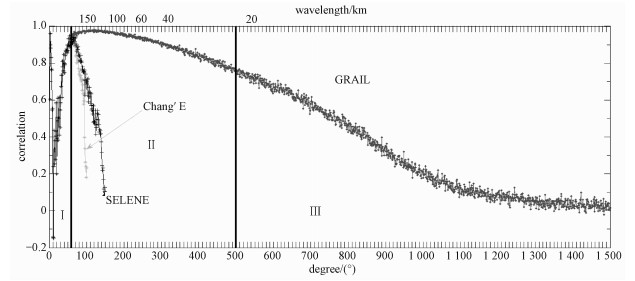
| 图 1 不同探月数据计算得到的全月重力/地形相关性 Fig. 1 Correlation between the lunar gravity and topography, as a function of the degree of spherical harmonics obtained from GRAIL, Chang'E, and SELENE 图 1 不同探月数据计算得到的全月重力/地形相关性 Fig. 1 Correlation between the lunar gravity and topography, as a function of the degree of spherical harmonics obtained from GRAIL, Chang'E, and SELENE --> | |
从图 1可以发现,50~60阶以下的长波部分(第Ⅰ部分)相关性较低,而与之相比波长较短的短波(60~500阶次)部分(第Ⅱ部分),具有较高的相关性。其中第Ⅰ部分相关性较低的可能原因是由地形变化引起的重力变化被月壳均衡较好地进行了补偿,因此掩盖了这些变化;对于第Ⅱ部分,月球表面地形的高低起伏明显地体现了重力变化;而对于更高阶次的部分(第Ⅲ部分),由于重力场短波长部分演算精度的下降,相关性逐渐下降。从图中可以看出,日本SELENE和中国嫦娥系列探测任务得到的重力场,由于探测能力的限制,在80阶左右就开始出现相关性降低;相比之下,美国的GRAIL探测结果精度得到前所未有的极大提高,到500阶次的时候依然保持较高的相关性。
2 重力地形导纳与月球的弹性体厚度根据月球月壳均衡模型(t弹性板块模型),板块上存在作为弹性体的低温层,地形被浮力和表层弹性支持,地形得以维持平衡[10]。一般而言,长波长地形的月壳均衡易于实现,因此与地形相关的重力异常比较小(导纳表现为比较小),但是对于弹性层较厚的情况,由于弹性层对于更长波长的地形的支撑作用,导纳会变得比较大;并且,通过比较不同波长的重力地形导纳,可以推测弹性层的厚度Te。因此,对于月球而言,弹性层的厚度一定程度上反映月球热流量的性质,提供了地形形成年代热状态信息分析的机会。
需要指出的是,文献[10]中的Te跟地震波理论对低速层上存在的岩石圈(lithosphere)厚度的定义不同,它表示的是支撑地表的起伏的弹性体的厚度,岩石圈(lithosphere)下的温度大约在1 400 ℃,后者下面的温度却只有450~600 ℃[9],并且相比岩石圈的厚度,Te往往很小。
下面,根据重力地形导纳对波数的依赖性,考虑弹性体的厚度Te。根据弹性体的扭曲性依赖于作用力的空间波长,重力地形导纳也可以看作是波数k的函数:
| $\mathit{Z}\left( \mathit{k} \right)\text{= } \Delta \mathit{g}\left( \mathit{k} \right)\text{/}\mathit{H}\left( \mathit{k} \right)\text{, }$ | (6) |
另一方面,文献[10]提出,重力地形导纳可以有如下的公式计算:
| $\mathit{Z}\left( \mathit{k} \right)\text{=2 } \pi \mathit{g}{{\mathit{\rho }}_{\text{c}}}\text{(1-}\phi {{\text{e}}^{\text{-}\mathit{kt}}}\text{)}\text{.}$ | (7) |
| $\phi \text{= } \{ \text{ } [ \mathit{D}{{\mathit{k}}^{\text{4}}}\text{/(}{{\mathit{\rho }}_{\text{m}}}\text{-}{{\mathit{\rho }}_{\text{c}}}\text{)}\mathit{g} ] \text{ +1}{{ \} }^{\text{-1}}}\text{, }$ | (8) |
| $\mathit{D}\text{=}\mathit{ET}_{\text{e}}^{3}\text{/12(1-}{{\mathit{\nu }}^{\text{2}}}\text{), }$ | (9) |
由式(6)~式(9),Te和ρc未知,根据实际观测的重力地形导纳值,对未知量进行约束。球谐函数的阶次和波数之间可以通过月球的半径进行转换即k=l/R,并根据已有的文献[11-12],将杨氏模量、泊松比率、月面重力加速度、月球壳幔密度差分别设定为30 GPa,0.25,1.623 m/s2,0.4×103 kg/m3。月壳的平均厚度假定为40 km。
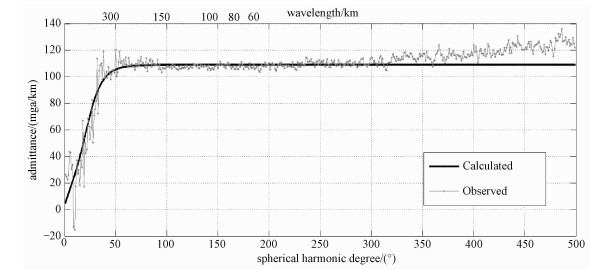
根据以上的理论分析,我们将全月重力地形导纳的观测和理论结果进行对比。图 2中的绿线表示用GRAIL重力场数据和LRO地形数据计算得到的全月观测重力地形导纳,从图中可以看出,在长波长(低阶)时,导纳值比较低,但随着次数的增加(50阶以后),导纳值急剧增长,最终稳定在110 mgal/km附近;图 2中的红线表示全月导纳的理论计算值,Te和ρc分别设定为14 km和2.6×10³ kg/m3。同时,考虑到地形和重力的相关性限制,我们截断到500阶,由图 2可以看出我们的模型和观测值之间符合度较高。
Fig. 2
 | Download: JPG larger image |
| 图 2 全月导纳的理论值和观测值(截断到500阶) Fig. 2 Gravity-topography admittance of the Moon from the observed data and equations (5)—(8) 图 2 全月导纳的理论值和观测值(截断到500阶) Fig. 2 Gravity-topography admittance of the Moon from the observed data and equations (5)—(8) --> | |
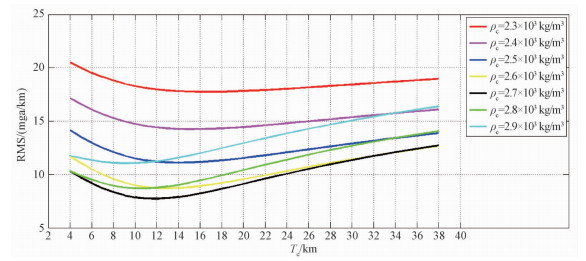
通过比较计算观测值和理论值的均方根(RMS, root mean square)的方法寻求最优的Te和ρc,RMS定义如下:
| $\text{RMS=}\sqrt{{\frac{\sum\nolimits_{\mathit{l}\text{=2}}^{500}{{\text{(}{{\mathit{Z}}_{\text{obs}}}\text{-}{{\mathit{Z}}_{\text{calc}}}\text{)}}^{\text{2}}}}{\text{500}}}}\text{.}$ | (10) |
Fig. 3
 | Download: JPG larger image |
| RMS表明最小值在ρc=2.7×10³ kg/m3和Te=12 km。 图 3 不同Te和ρc对应的均方根 Fig. 3 Behavior of the RMS for different combinations of Te and ρcρc=2.7×10³ kg/m3和Te=12 km。 图 3 不同Te和ρc对应的均方根 Fig. 3 Behavior of the RMS for different combinations of Te and ρc --> | |
为了更精确地求得参数值,采用非线性最小二乘问题的Gauss-Newton迭代方法对参数进行求解,Gauss-Newton方法的迭代公式[13]为
| $\begin{align} &{{\mathit{\boldsymbol{x}}}_{\mathit{k}\text{+1}}}\text{=}{{\mathit{\boldsymbol{x}}}_{\mathit{k}}}\text{-(}\mathit{\boldsymbol{J}}{{\text{(}{{\mathit{\boldsymbol{x}}}_{\mathit{k}}}\text{)}}^{\text{T}}}\mathit{\boldsymbol{J}}\text{(}{{\mathit{\boldsymbol{x}}}_{\mathit{k}}}\text{)+} \\ &\ \ \ \ \ \ \ \ \ \ \ \mathit{S}\text{(}{{\mathit{\boldsymbol{x}}}_{\mathit{k}}}\text{)}{{\text{)}}^{\text{-1}}}\mathit{\boldsymbol{J}}\text{(}{{\mathit{\boldsymbol{x}}}_{\mathit{k}}}\text{)(}{{\mathit{Z}}_{\text{calc}}}\text{-}{{\mathit{Z}}_{\text{obs}}}\text{), } \\ \end{align}$ | (11) |
Table 1
| 表 1 Gauss-Newton法参数迭代过程Table 1 Gauss-Newton iteration process |
3 总结Crosby和MaKenzie[14]根据Lunar Prospector的测速数据推算月表Te的范围为(12±5) km,Matsumoto等[11]使用贝叶斯反演方法计算得到ρc的范围为(2.4~2.8)×103 kg/m3,本文使用最新的测月数据和一个简单的理论模型得到的结果与之前的研究结果是符合的,说明了结果的一致性。需要指出的是,对于固体天体来说,一般情况下,地质活动剧烈区域的弹性层厚度比较大,而相对安定的区域厚度比较低,例如地球上的西伯利亚地区Te=15.5 km,火山活动剧烈的夏威夷地区的弹性层厚度达到Te=28.4 km[15],因此对于月球局部区域弹性层厚度的研究具有更加重要的意义[16-18]。
对于固体行星来说,半径越小,内部热源的相对表面积则越大,散热也越快,因此对于不足地球1/3半径的月球而言,其平均弹性层厚度应该大于地球。不过,通过计算月球的重力地形导纳,得出月球弹性层厚度小于地球的结论,这可能是由于月球的地形形成年代远大于地球,当时的月球并未冷却完毕,保留了较低的弹性层厚度。这些都有待于进一步的探测研究。
感谢中国科学院国家天文台的平劲松研究员和武汉大学鄢建国教授提出的宝贵建议与意见。
参考文献
| [1] | Zuber M T, Smith D E, Lemoine F G, et al. The shape and internal structure of the moon from the clementine mission[J].Science, 1994, 266(5192):1839–1843.DOI:10.1126/science.266.5192.1839 |
| [2] | Konopliv A S, Binder A B, Hood L L, et al. Improved gravity field of the moon from lunar prospector[J].Science, 1998, 281(5382):1476–1480.DOI:10.1126/science.281.5382.1476 |
| [3] | Namiki N, Iwata T, Matsumoto K, et al. Farside gravity field of the moon from four-way Doppler measurements of SELENE (Kaguya)[J].Science, 2009, 323(5916):900–905.DOI:10.1126/science.1168029 |
| [4] | Matsumoto K, Goossens S, Ishihara Y, et al. An improved lunar gravity field model from SELENE and historical tracking data:revealing the farside gravity features[J].Journal of Geophysical Research, 2010, 115(E6):258–273. |
| [5] | Yan J, Goossens S, Matsumoto K, et al. CEGM02:an improved lunar gravity model using Chang' E-1 orbital tracking data[J].Planetary and Space Science, 2012, 62(1):1–9.DOI:10.1016/j.pss.2011.11.010 |
| [6] | Araki H, Tazawa S, Noda H, et al. Lunar global shape and polar topography derived from Kaguya-LALT laser altimetry[J].Science, 2009, 323(5916):897–900.DOI:10.1126/science.1164146 |
| [7] | Ping J, Huang Q, Yan J, et al. Lunar topographic model CLTM-s01 from Chang'E-1 laser altimeter[J].Science China-physics Mechanics & Astronomy, 2009, 52(7):1105–1114. |
| [8] | Zuber M T, Smith D E, Watkins M M, et al. Gravity field of the moon from the gravity recovery and interior laboratory(GRAIL) mission[J].Science, 2013, 339(6120):668–671.DOI:10.1126/science.1231507 |
| [9] | Simons M, Solomon S C, Hager B H, et al. Localization of gravity and topography:constraints on the tectonics and mantle dynamics of Venus[J].Geophysical Journal International, 1997, 131(1):24–44.DOI:10.1111/gji.1997.131.issue-1 |
| [10] | Watts A B. Isostasy and flexure of the lithosphere[M].Cambridge: Cambridge University Press, 2001. |
| [11] | Matsumoto K, Yamada R, Kikuchi F, et al. Internal structure of the moon inferred from Apollo seismic data and selenodetic data from GRAIL and LLR[J].Geophysical Research Letters, 2015, 42(18):7351–7358.DOI:10.1002/2015GL065335 |
| [12] | Lognonne P, Gagnepainbeyneix J, Chenet H, et al. A new seismic model of the moon:implications for structure, thermal evolution and formation of the moon[J].Earth and Planetary Science Letters, 2003, 211(1):27–44. |
| [13] | 袁亚湘, 孙文瑜. 最优化理论与方法[M].北京: 科学出版社, 1999. |
| [14] | Crosby A, Mckenzie D. Measurements of the elastic thickness under ancient lunar terrain[J].Icarus, 2005, 173(1):100–107.DOI:10.1016/j.icarus.2004.07.017 |
| [15] | Mckenzie D, Fairhead D. Estimates of the effective elastic thickness of the continental lithosphere from Bouguer and free air gravity anomalies[J].Journal of Geophysical Research, 1997, 102(B12):27523–27552.DOI:10.1029/97JB02481 |
| [16] | 黄倩. 基于嫦娥一号和其他探月数据的测月学研究[D]. 上海: 中国科学院上海天文台, 2011.http://www.wanfangdata.com.cn/details/detail.do?_type=degree&id=Y2165899 |
| [17] | 李斐, 柯宝贵, 王文睿, 等. 利用重力地形导纳估计月壳厚度[J].地球物理学报, 2009, 52(8):2001–2007. |
| [18] | 钟振, 李斐, 鄢建国, 等. 利用重力/地形导纳和岩石圈单一薄层模型的月球物理参数反演[J].武汉大学学报(信息科学版), 2014, 39(12):1487–1492. |
